Table of Contents
Appearance in Satellite Data
Satellite products prove to be one of the most powerful and useful tools in identifying and tracking the movement of cold fronts around South Africa. Combination imagery, such as the Airmass RGB and the Day Microphysical RGB give clues as to the intensity of the cold fronts, the cloud types associated with them, the state of the atmosphere and airmasses to the east and west of the cold fronts. Satellite products can also show whether the middle and upper troposphere are favorable for intense frontal weather. Satellite imagery from geostationary satellites is also available 24 hours per day, and makes the tracking and placement of cold fronts more accurate.
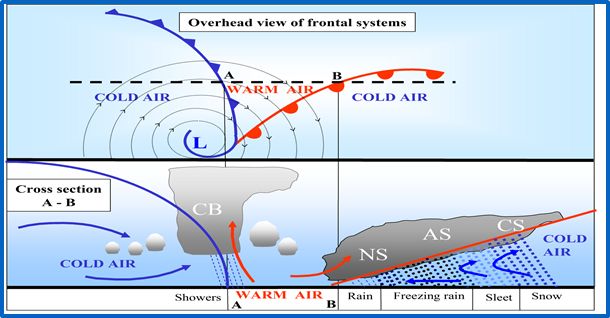
A typical vertical cross section of the cloud types associated with a cold front is given below. The unstable cloud is mostly associated with the cold front, while the more stable/layered cloud can be found around the warm front.
 |
Using the Airmass RGB, one must look for the main cloud band associated with the cold front. Sometimes it is easiest to start by finding the vortex of the low pressure associated with the front and then following the "tail" of the cold front from there. The cloud band associated with the cold front will mostly appear as a bright white cloud band, indicating the presence of cold cloud, or a more mustard or dull yellow colour, indicating mid level cloud (area A on the image). The bright white, cold clouds are mostly cumulonimbus cloud found along the cold front boundary (mainly far south of Africa) , as a result of convergence and upward motion in that area (area B on the image). The upper level trough associated with the surface front will also enhance the convective development because of upper divergence in the area above the surface front. The airmass RGB will also help in identifying the warmer, low level cloud as a smoother, more homogenous, green (high amount of upper level humidity) or yellow colour (low amount of upper level humidity) seen in area C on the image. The red colour is an indication of high values of upper level potential vorticity, which is normally associated with an upper level trough or low pressure system (Area D on the image). The deep blue colour on the RGB depicts low level cold air, and is normally found coincident with or slightly westward of the cold front (area E on the image).
The High Resolution Visible channel can be used to accurately place the surface cold front during daylight hours, and to identify small scale cloud and land features. Ahead of the cold fronts that pass over the southern parts of South Africa, one will often be able to identify mountain and gravity waves in the cloud structures (Area A on the image). When the winds at the mountain tops are perpendicular to the mountains, mountain waves develop in the stable atmosphere to the east of the front. Snow on the mountains and fog on the ground are also clearly visible in this channel. Fog will appear as a smooth white/grey cloud, while snow will be bright white and follow the contours of the topography, as seen south-east of Lesotho in this case. The cumulonimbus cloud associated with the cold fronts can also be identified accurately as bright white, cellular shaped cloud. In this example, the cold front is identified by the grey/white band of thick cloud to the south west of South Africa (Area B on the image).
By making use of the Day Microphysical RGB during daylight hours, many cloud and land features are visible to the user. Phenomena such as fires are easily identifiable by the bright cyan coloured pixels (area A on the image). Fires are common over South Africa during the winter months and more likely to occur ahead of the approaching cold fronts due to the increase in wind speeds during that time. The Day Microphysical RGB makes the identification of low level stratus, stratocumulus, cumulus and cumulonimbus possible. Stratocumulus appears as a layer of bright pink cloud, while the cumulus cloud has more of a cellular shaped and smaller pink clouds (area B on the image). Cumulonimbus cloud appears as a large cellular shaped orange cloud. The identification of the different cloud types is very important when forecasting precipitation types associated with the cold fronts. Snow on the ground can also be seen as a red colour using this RGB (area C on the image), as well as super-cooled water in mid level cloud which appears as a smooth green cloud.
The Night Microphysical RGB allows the user to identify the convective cloud associated with the cold front, as well as the low level cloud over night. Identifying the position of the surface cold front overnight can be very difficult as the cloud top temperatures are often similar to the temperatures of on the ground. A user should look for the vortex of the surface front and trace the position of the tail of the front back towards the country. The tail of the front can either be seen as a band of convective cloud, with smaller cellular shaped cells towards the northern tip of the tail, or even as a narrow band of cellular shaped cells, thinning out into low level stratiform cloud. The single channel IR imagery can also be used for this purpose but the Night Microphysical RGB is the preferred option to use, as various cloud types are easily identifiable. Cumulonimbus clouds appear as a deep red color and have the classical cellular shape (Area A on the image). At times, these cloud will also have some yellow pixels in them, indicating low cloud top temperatures. Low level stratus cloud or fog will appear a more blue/grey color (area B on the image), and should be a smooth layer of cloud. The upper level cirrus cloud will be a dark blue/black and can be easily distinguished from the thicker mid level cloud (area C on the image).
|
18 September 2008, 0900UTC, Meteosat Second Generation, Airmass RGB
|
18 September 2008, 1200UTC, Meteosat Second Generation, High Resolution Visible
|

|

|
|
11 August 2012, 1200UTC, Meteosat Second Generation, Day Microphysical RGB
|
19 September 2008, 0300UTC, Meteosat Second Generation, Night Microphysical RGB
|

|

|
This is a loop of the Airmass RGB, valid from the 11th August 2012 0600UTC, until the 12th August 2012 at 0900UTC. At the start of the loop, the cold front is identifiable by the broad band of mid and upper level cloud, passing over the western parts of South Africa. The vortex of the low pressure is seen to the south of the country and a broad area of cold air cumulus cloud is found beneath the upper air low pressure accompanying this cold front. Ahead of the cold front, the eastern parts of South Africa are dry with high level cloud blowing off the eastern escarpment. The cold front progresses over the western and central parts of South Africa and then starts to dissipate as it moves over the eastern and south-eastern coastal belt. The cloud cover and associated precipitation are limited to the western, central and southern parts of South Africa, spreading to the south-east and eastern coastal areas by the end of the loop.

|
Press "Play Button" to see the loop; 11 August 2012 0600UTC - 12 August 2012 0900UTC Meteosat Second Generation: Airmass RGB. |
Meteorological Physical Background
Introduction
Cold Fronts generally form within a baroclinic boundary between cold and warm air masses. The main physical process for the development of cold fronts is the movement of the cold air against warm air. The warm air ascends along the boundary while the cold air sinks below it. If there is enough humidity, the upward motion leads to condensation and to the development of clouds and precipitation.
The definition of a cold front in the sub tropics is: "a narrow sloping layer with a vertical extent of at least 3km where the temperature decreases by at least 3 C".
Geographical Location
South Africa, located between 25°S and 35°S, lies in subtropics and therefore the descending leg of the Hadley cell. Cold fronts in the sub tropics usually occur from 25°S to 40°S but on a few occasions as far north as 15-20°S. Typically only the tail of cold front moves over South Africa with the Atlantic Ocean High moving behind it from the west and a coastal low about 5° east of the front.
|
Hadley Circulation in the southern hemisphere
|
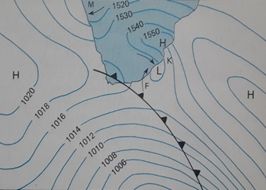
A typical cold front over South Africa
|

|
|
Seasonal variety
Cold fronts have their largest effect on South Africa weather during the Southern Hemisphere autumn, winter and spring (March to October). Cold fronts are most prevalent and most intense in Austral winter but summer cold fronts are not unknown in South Africa. The effect that cold front have on the weather during summer is much less intense than during autumn, winter and spring.
|
Typical Summer pattern
|
Typical Winter Pattern
|

|

|
Life Cycle
The Norwegian cyclone model, named after the Norwegian meteorologists who first conceptualized the typical life cycle of cyclones in the 1910s and 1920s, presents the evolution of a cyclone.
The image indicates the typical life cycle of a cold front. First there is a boundary, or front, separating warm air to the north from cold air to the south. The front is often stationary but the frontal wave may progress eastwards with time. During the second stage a wave forms on the front as an upper level disturbance embedded in the jet stream moves over the front. The front develops a "kink" where the wave is developing. Precipitation starts to occur, heaviest along the frontal boundary (indicated by the green shading). The third stage happens as the wave intensifies and both cold and warm fronts become better organized. The wave becomes a mature low pressure system in stage 4, while the cold front, moving faster than the warm front, "catches up" with the warm front. In the fifth and final stage the cold front overtakes the warm front, an occluded front forms.
|
Typical Life Cycle of the cold front
|
Typical clouds associated with a mature cold front
|

|

|
Surface weather conditions associated with the passage of a cold front in the sub tropics
South Africa has a unique interior plateau separated from the coast by an escarpment. This escarpment results in air descending this plateau on its way to the coast resulting in cyclonic vorticity. Coastal lows form along the coast of Namibia as a cold front approaches South Africa from the west. The high pressure over the interior dominates the synoptic circulation causing an offshore flow along the Namibian coast leading to the formation of a coastal low. As the front progress eastwards, the coastal low moves to the southwest coast, south coast and east coast and later disappears over the coast of Mozambique.
The Tables below outlines the change in conditions at the surface and vertically with the passage of a cold front over South Africa:
Table 1: Characteristic horizontal changes in surface variables during the passage of a cold front along the south coast of South Africa
|
||
| Surface variables | Pre frontal | Post frontal |
|---|---|---|
| Wind direction | NW | SW |
| Pressure tendency | falling | rising |
| Temperature | warm | cold |
| Dew point | dry | moist |
| Equivalent Potential temperature (Θe) | high | low |
| Cloud | clear becoming stratiform | convective |
Table 2: Characteristic vertical changes (surface and 700 hPa) in atmospheric variables during the passage of a cold front along the south coast of South Africa
|
||
| Variables | Pre frontal | Post frontal |
|---|---|---|
| Wind direction | NW | SW |
| Geopotential | falling | rising |
| Air mass change | Decrease in wet bulb potential temperature of at least 3°C up to 700 hPa | |
| Dry bulb Temperature | Decrease in dry bulb temperature of at least 3°C up to 700 hPa | |
Coastal Lows
Coastal lows are shallow weather systems and are as deep as the escarpment is high. The depth of coastal lows vary but will never extend to pressures lower than 850 hPa (5000 ft above sea level). The leading edge the coastal low is associated with an offshore flow (red arrow on image) which leads to dynamic and adiabatic warming as air descends the escarpment. These hot winds are termed bergwinds in South Africa and is similar to the Foehn wind which occurs in the Alps. The flow is onshore to the rear of the coastal low (blue arrow on image) resulting in cooler temperatures. The transition from an offshore flow causing clear and hot conditions along the coastal belt to onshore flow resulting in cloudy and cooler conditions can very often be mistaken the passage of a cold front.
|
Topography of South Africa
|
Flow associated with a Coastal Low
|

|

|
|
|
Press "Play Button" to see the loop; Overland Ridging Process. |
|
|
Press "Play Button" to see the loop; Coastal Ridging Process. |
|
|
Press "Play Button" to see the loop; High Ridging south of South Africa. |
Key Parameters
-
Temperature:
As the cold front approaches South Africa, surface temperatures along the coastline increase due to the dry, off-shore northwesterly flow. If this flow is significantly strong berg winds develop. When the cold front makes landfall and progresses eastwards, surface temperatures west of the frontal boundary decrease along the coast and adjacent interior of South Africa. Depending on the position and strength of the Atlantic high pressure system behind the front, the colder temperatures may spill over the escarpment into the interior of South Africa. In general, it is not possible to identify the location of the surface front by temperature on infra red imagery alone, due to the masking effect of clouds. However, the cloud band associated with the cold front should be located ahead of the coldest surface temperatures.
-
Barometric Pressure:
The sea level pressure falls as the cold front approaches and rise sharply behind it. The rise in pressure is a combination of the frontal trough moving eastwards and the Atlantic Ocean High pressure which ridges behind the cold front. The coastal low which precedes the cold front by a few hundred kilometers will cause a pressure rise to its west and this increasing pressure may mask the approach of the cold front. Along the south and east coasts of South Africa, the coastal low will always precede the cold front and it is advisable to scrutinize all available information in order to distinguish these systems. The cold frontal cloud band will generally lie ahead of the largest pressure rise.
-
Wind Speed:
Wind speeds at the surface increase close to the frontal boundary with gale force (>35kt) winds possible along the South African coastline as the cold front progresses eastwards. The westerly to south-westerly gale behind the cold front can extend over a large area, depending on the positioning and intensity of the Atlantic high pressure ridging behind the front. The cloud band associated with the cold front will normally be found in the area where the wind shifts from a north-westerly to a south-westerly. Over the interior of South Africa, the gusty winds associated with the approach and passage of the surface front, can pick up dry sand, which may result in reduced visibility and more rarely, dust storms or blowing dust. Veld and bush fires also occur under these conditions.
-
Wind Direction:
Ahead of the cold front, one would anticipate a dominantly north-westerly wind and a south-westerly wind to the rear/west of the cold front. If a secondary low develops behind the front, the wind direction behind the front remain westerly and can even become north-westerly. Over the interior of South Africa it is more difficult to use wind direction to place the cold front, as the effects of friction and topography alter the wind direction at the surface. The cloud band associated with the cold front will normally be found in the area where the wind speeds are fairly strong and gusty.
-
Relative Humidity:
Along the coastal belt maximum values of relative humidity occur close to and coincident with the position of the cold front, from the surface to approximately 10000ft (700hPa). Highest values of relative humidity is therefore found in the frontal cloud band (as identified on satellite imagery). Cold fronts over the interior of South Africa are associated with very dry air behind the front.
-
Equivalent potential temperature:
The equivalent potential temperatures (EPT) indicate the airmass boundary between the the warmer (east of the front) and colder (west of the front) temperatures associated with the front. The cold front is normally situated where the gradient of EPT are the highest and there should be at least a 3 degree change from east to west. The vertical profile of EPT is used to identify the convective instability of the airmass behind the cold front. When comparing the location of the cloud band associated with the cold front, it will generally be found behind/west of where there is a rapid transition from warm to cold airmasses. Due to the unique topography in South Africa, it is also possible that the low features of the cold front will become modified as the cold front moves over land. For this reason the tightest EPT gradient can also be found coincident with the low level cloud band associated with the cold front and not always ahead of it.
-
Wind Convergence and Divergence:
Due to the nature of a cold front progressing from west to east, the heavier more dense air behind the cold front will move into an area of warmer and less dense air. Along the boundary of the cold front in the lower levels horizontal wind convergence occurs from the surface to at least 700hPa. The cloud band associated with the cold front will be found in the region of strong surface, low and mid level wind convergence.
-
Vertical Velocity (Omega):
Due to the cold air behind the cold front being more dense than the warm air ahead of the cold front, as the cold air encounters the warm air mass, the cold air will undercut the warm air, forcing it to rise. The low level horizontal wind convergence will also result in air being forced to rise in the lower and mid levels of the atmosphere, close to and along the cold frontal boundary. The maximum values of vertical uplift in the low and mid levels will be found coincident with the cloud band associated with the cold front, when comparing the NWP field to the satellite image.
-
Temperature Advection:
Temperature advection can be described as being the wind induced horizontal temperature change at a specific location. When applying this definition to the passage of a cold front over an area, one would expect to see areas of cold air advection slightly ahead, coincident with and behind the cold front. Warm air advection occur ahead of the cold front. Cold air advection occurs slightly ahead, underneath and behind the cold frontal cloud band.
|
Cape Town Meteogram on 29 August 2013
The cold front moved through Cape Town between 0500 and 0700 as the wind turns southwesterly during this period and the air dries, typical weather behind a front over the Peninsula. |
VIS0.6 overlay with 2m temperature 1200UTC on 29 August 2013
In general, it is not possible to identify the location of the surface front by temperature on infra red imagery alone, due to the presence of cloud, the cloud band associated with the cold front should however be located ahead of the area of where the lowest surface temperatures are being recorded. |
.gif)
|

|
|
Port Elizabeth Meteogram on 29 August 2013
The cold front moved through Port Elizabeth between 1500 and 1700. The pressure starts to increase, temperatures drop and dew point depression fall. Note the southwesterly winds at Port Elizabeth before the passing of the front. This is due to the coastal low which moved through earlier. |
VIS0.6 overlay with mean Sea level pressure and 10m Wind on 29 August 2013
The cloud band associated with the front will generally lie ahead of where the greatest pressure rise occurs and where the surface trough is located. |
.gif)
|

|
Surface temperature
|
IR10.8 overlay with 2m temperatures on 29 August 2013 at 1200UTC
In general, it is not possible to identify the location of the surface front by temperature on infra red imagery alone, due to the presence of cloud, the cloud band associated with the cold front should however be located ahead of the area of where the lowest surface temperatures are being recorded. |
|

|

|
Relative Humidity
|
VIS0.6 overlay with relative Humidity at 850hPa on 29 August 2013 at 1200 UTC
The relative humidity will be highest in the region of the cloud band band associated with the cold front on the satellite image. |
|

|

|
Equivalent potential temperature
Typical Vertical cross section of equivalent potential temperature for Port Elizabeth on 30 August 2013 at 1200UTC
|
Equivalent Potential temperature for 30 August 2013
|
|
|
.gif)
|
|
IR10.8 overlay with Equivalent Potential temperature and 10m wind on 11 August 2012 at 0600UTC
When comparing the location of the cloud band associated with the cold front, it will generally be found behind/west of where there is a rapid transition from cold to warm airmasses. |
|

|
.jpg)
|
Wind Convergence
Only negative values of divergence are displayed on the satellite overlay, where the areas of blue/green depict where most convergence is occurring.
|
Schematic depiction of convergence associated with a cold front.
|
IR10.8 Overlay with wind convergence (negative divergence) at 700Hpa on 11 August 2012 at 0600UTC
The cloud band associated with the cold front will be found in the region of strong surface, low and mid level wind convergence. |

|

|
Vertical Velocity
Only negative values of omega (uplift) are displayed with the satellite overlay, where the blue/green area depict where most uplift is occurring.
|
Schematic depiction of Vertical velocity associated with a cold front.
|
Day Natural Colour overlay with Vertical Velocity at 850hPa on 29 August 2013 at 1200UTC
|

|

|
|
Day Natural Colour overlay with Vertical Velocity at 700hPa on 29 August 2013 at 1200UTC
|
|

|
|
|
Day Natural Colour overlay with Vertical Velocity at 600hPa on 29 August 2013 at 1200UTC
The maximum values of vertical uplift in the low and mid levels will be found coincident with the cloud band associated with the cold front, when comparing the NWP field to the satellite image |
|

|
Temperature Advection
Blue indicates cold air advection and red warm air advection.
|
Schematic depiction of Temperature Advection associated with a cold front.
|
VIS0.6 with Surface Temperature Advection valid on 29 August 2013 at 1200UTC
When comparing the temperature advection NWP to the cloud band associated with the cold front, the cooling will happen slightly ahead, underneath and behind the cold front in the area of cold air cumulus. This indicates that the temperatures are decreasing in these areas with the passage of time. |

|

|
Typical Appearance In Vertical Cross Sections
-
Vertical Uplift:
Negative values of omega (uplift) occurs along the boundary of the cold front, as the cold, more dense air behind the cold front forces the warm, less dense air to rise as the front moves into the relatively warmer air on its path eastwards.
-
Horizontal wind Convergence:
The eastward propagation of the cold front results in the cold, dense air west of the cold front boundary converging with the more stable warm air to the east of the cold front boundary as the front moves. This convergence in the lower levels helps to drive the resultant vertical uplift in the region of the cold front boundary.
-
Temperature advection:
To the west and south-west of the cold front boundary, cold polar air is advected northwards and north-eastwards into a relatively warmer region of air ahead of the cold front. Similarly, the air between the cold front and warm front boundary is relatively warmer than the cooler air to the south of the warm front boundary and hence warm air advection is expected in this zone to the east of the cold front.
Two examples are shown here. The one over the Atlantic Ocean with all the typical features of a cold front and the other over is a sub-tropical example typical of fronts over South Africa.
Areas used for vertical cross sections
|
Classical exampleAirmass RGB valid for 29 August 2013 at 0600UTC
|
Sub-tropical example
Day Microphysical RGB valid for the 11 August 2012 at 1200UTC |

|

|
Vertical Uplift and Equivalent Potential Temperature
In the classical example over the ocean the vertical uplift occurs above the surface cold front with subsidence further west. In the subtropics a deep layer of vertical uplift is also present above the surface cold front but with more significant subsidence west of it. Over the ocean the vertical orientation of the cold front is visible in the tight gradients of equivalent potential temperatures and the uplift is mainly confined to the east of this boundary. The warm front is also clearly evident in the eastward slant of the tight potential temperature gradients and the uplift above the warm front. This boundary is absent in the sub-tropical example.
|
Conceptual model
The solid blue contours are upward motion and the dotted contours downward motion. The black contours are potential temperatures. |
Classical example
The solid blue contours are upward motion and the dotted contours downward motion. The black contours are potential temperatures. |
|
|

|
Horizontal wind Convergence
In the classical example over the ocean strong surface convergence occurs in the and directly to the east of the cold front. The convergence stretches to close to the tropopause although this happens further west of the surface cold front. Above the surface cold front, close to the tropopause divergence occurs. In the sub-tropical example it is apparent how the land mass changes the convergence field with the surface convergence not confined to the cold front but occurring all along the south coast. In the upper layers the convergence field above the surface cold front appears similar to the classical example with a deep layer of convergence but with divergence close to the tropopause.
|
Conceptual model
|
Classical example
Yellow shades are convergence and green shades divergence. Values multiplied by 10ES. CF indicates the position of the cold front at the surface. |
|
|

|
Temperature Advection
In the classical example over the ocean the cold air advection occurs to from the surface to the tropopause with warm air advection east of the front. The subtropical example the cold air advection occurs to close to 400 hPa with a layer of warm air advection above that.
|
Conceptual model
|
Classical example
Red shades are warm air advection and blue shades cold air advection. Values multiplied by 10E3. CF indicates the position of the cold front at the surface. |
|
|

|
Weather Events
South Africa mostly experiences only the tail or very edge of the cold front band and the weather associated with the passage of the cold front can vary greatly. Weather over the southern parts of South Africa can easily be very cold and cloudy with rain, while the north-eastern parts of South Africa experience dry and windy conditions which may lead to runaway fires. When the cold fronts are less intense, some cloudiness and a slight cooling of temperatures can be experienced without any rainfall.
The following 4 images give a schematic view of the weather expected over a 4 day period with the passage of a cold front, including hazardous and non-hazardous conditions. On each image the escarpment (grey line), weather systems and dominant weather phenomena are depicted:

|

|

|

|
Weather Hazards
The following weather hazards/weather alerts are categorized according the threshold values used by the South African Weather Service (SAWS). Examples of each alert is given below. These include satellite imagery and a few photographs of the events and media reports where applicable. Please note that the satellite imagery is of different cases and that each satellite image is meant to represent the current location of the cold front over South Africa for the corresponding day highlighted for each schematic of an alert.
| Parameter | Description |
|---|---|
| Gale force winds or stronger | Average wind speed of more than 34kts or gusts in excess of 44ks (excluding Cape Point under shallow South-easterly conditions). |
| Heavy Rainfall | 50mm or more of rain in a 24hour period. |
| Heavy rain leading to Flash flooding | Any amount of rainfall that could lead to the flooding of small streams as guided by the South African Flash Flood guidance System (SAFFG) or the South African Regional Flash Flood Guidance System (SARFFG). |
| Localised Urban Flooding | Any amount of rain leading to the flooding of urban areas that could cause significant disruptions. |
| Snowfall and Disruptive Snowfalls | Sufficient snow to cause significant traffic danger and/or disruptions to mountain passes, major roads and/or highways and/or populated areas. |
| High Seas | Total wave height in excess of 6m |
| Very Cold Conditions | Maximum temperatures are not expected to exceed 10 °C. |
| Fire Danger | Fire Danger index reaches 75 or greater |

|

|

|

|

|

|

|

|
The above mentioned Weather Hazards are focused on Public Weather Based weather. The following schematics show the possible distribution of weather hazards for the Aviation community with the passage of a cold front.

|

|

|

|
Similarly to the Aviation based weather hazards above, the possible marine based weather hazards are given below:

|

|

|

|
References
General Meteorology and Basics
- Carter, T.J., 2005: the Evolution of coastal lows along the south coast of South Africa, Msc Thesis, University of Zululand
- Taljaard, J.J., 1995: Atmosphere circulation systems, synoptic climatology and weather phenomena of South Africa, Atmospheric circulation systems in the South African Region, Part 2, Technical paper no. 28, Pretoria. South Africa. Weather Bureau. pp. 65.
- Taljaard J.J., Schmidt W and van Loon H., 1961: Frontal analysis with application to the southern hemisphere, Notos, South African Weather Bureau, Pretoria, 10, 25-58.
- Tyson, P.D. & Preston-Whyte, R.A., 2000: The Weather and Climate of Southern Africa, Second Edition, Oxford University Press, Cape Town. pp. 396.
- Van Heerden, J. & Hurry, L., 1995: Southern Africa's Weather Patterns, An Introductory Guide, Via Africa Limited, Acacia Books, Pretoria. pp. 95.
- http://www.srh.weather.gov/srh/jetstream/synoptic/cyclone.htm
General Satellite Meteorology
- http://www.eumetrain.org/satmanu/CMs/Cf/navmenu.php?page=2.0.0
- http://oiswww.eumetsat.org/WEBOPS/msg_interpretation/index.php
- Kerkmann, J., 2005: RGB composites with channels 01-11 and their interpretation, Accessed on 1st March 2016.
http://oiswww.eumetsat.org/WEBOPS/msg_interpretation/msg_channels.php
Specific Satellite Meteorology
- All satellite data was acquired from EUMETSAT
Numerical Weather Prediction Model
The graphics were prepared using:
- AMcIdas VCast version 1.4 : http://www.ssec.wisc.edu/mcidas/software/v/index.html
- NCEP reanalysis data. Kalnay et al. 1996. The NCEP/NCAR 40-year reanalysis project, Bulletin of the American Meteorological Society, 77, 437-470.