Chapter I: Introduction
Table of Contents
- Chapter I: Introduction
- Introduction
Introduction
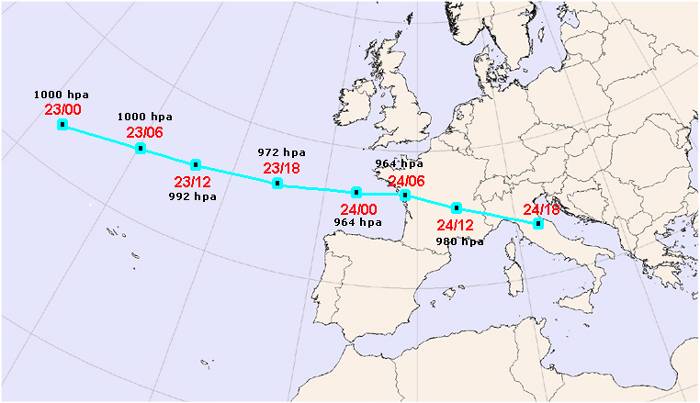
The 2009 Klaus winter storm (00 UTC 23 January to 18 UTC 24 January) has been one of those cyclones that visit us not so often, leaving a serious path of damage behind it, especially in northern Spain and southern France. Reaching explosive development rates as high as 34 mb in 24 hours, and registered maximum surface wind gusts of the order of 200 km/h. Klaus cyclone, as a system with a clear surface pressure signal, approximately started on day 23 about 00 UTC, in the middle of the Atlantic, at position shown below, with a minimum MSLP value of 1000 mb, according to ECMWF / HIRLAM analysis. The track of the cyclone was purely zonal and its speed was markedly high, reaching values above 100 km/h. A minimum surface pressure of about 964 mb at cyclone center took place on day 24 at about 00 UTC, more or less maintained for several hours during the warm seclusion phase of the system. Below, an approximate track of the center of the cyclone, labeled with passing dates, UTC times and minimum MSLP's analyzed by HIRLAM-AEMET numerical model, is presented.
The following 6 hours, the air mass RGB animation shows clearly the fast moving nature of the system, and the nearly zonal path that it followed. Also, we can notice that the cyclone has no remarkable vertical development, compare to other Atlantic cyclones. However, strong thermal contrasts (that will be commented later) and intense descending upper level flow to the rear of the system, can be inferred from some of the images in the loop. These intense upper level descending flow phases, could be associated to the rapidly developing stages in the life cycle of the storm.

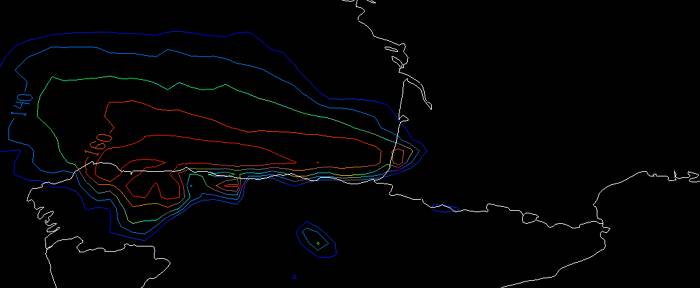
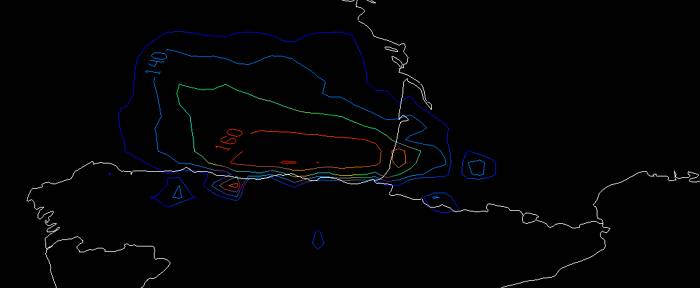
Klaus was quite well forecasted by NWP models, in general terms. Most of those forecasts pointed out more or less precisely the main features of the storm. As an example, check below the 6 and 9 hours forecasts from 00 UTC ECMWF model run, showing maximum surface wind gusts (in km/h, starting from 130) in the previous six hours (from 00 to 06UTC and from 03 to 09UTC).
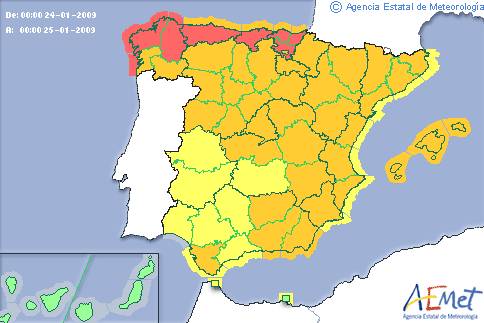
Also, from the forecaster point of view, Klaus effects were properly warned beforehand, as can be seen in AEMET's warning map below. It is not very often that one sees such a wide area covered with red level warnings, mainly for winds and wave heights. Check also that a great part of the map was also filled with orange level warnings.
In good agreement with the forecasts, the damages produced by the storm at the surface were huge and widespread, as it follows from observations registered during the event (see observations section).