The Upper Level Trough Stage
Synoptic situation
|
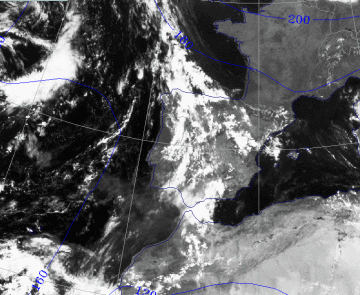
24 September 1997/12.00 UTC - Meteosat VIS image; blue: height contours 1000 hPa
|
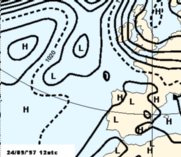
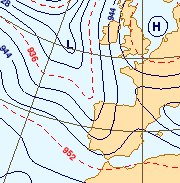
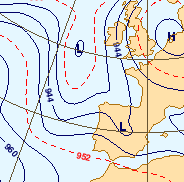
24 September 1997/12.00 UTC - Surface chart
|
A frontal cloud band extends from southern Spain across the Bay of Biscay towards Ireland. The front is quasi stationary in the deformation
area of a "saddle point" between a low over Northwest Africa, another low to the South west of Ireland, a high over the North Sea
and another high north of the Azores.
Between 40N and 50N, at a longitude of about 20W, a frontal zone is moving eastwards in the direction of the Iberian peninsula.
24 September 1997/12.00 UTC
Analysis of the system
|
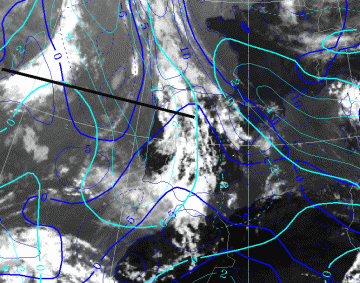
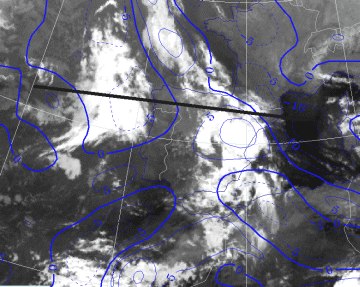
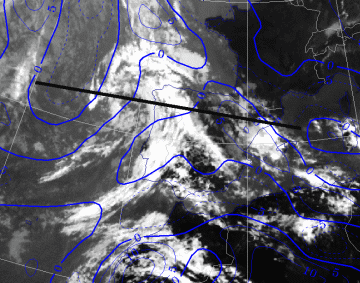
24 September 1997/12.00 UTC - Meteosat IR image; blue: thermal front parameter (TFP) 500/850 hPa, cyan: vorticity 500 hPa; position of
vertical cross section indicated
|
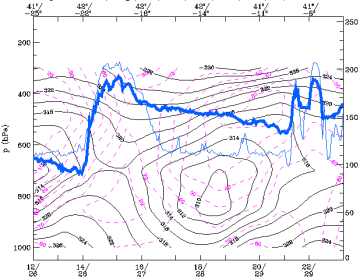
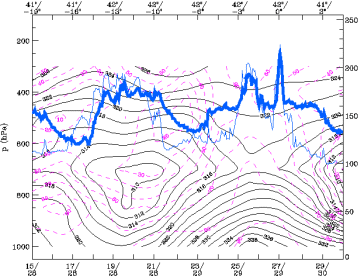
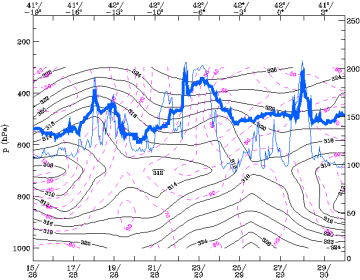
24 September 1997/12.00 UTC - Vertical cross section; black: isentropes (ThetaE), magenta: relative humidity, blue thin: IR pixel
values, blue thick: WV pixel values
|
The front over Spain towards Ireland is well defined in the thermal front parameter but the already decoupled front which approaches from the Atlantic is poorly represented by this model parameter. Also the cloud configuration off the coast of Morocco is not well reflected.
|
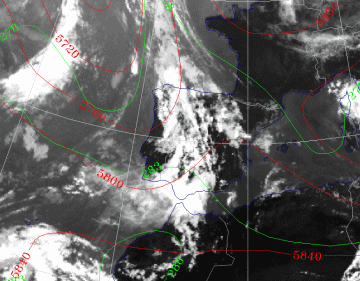
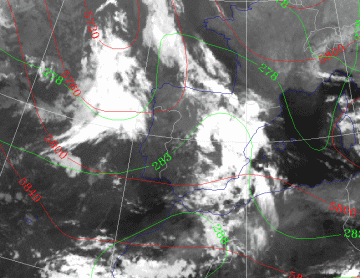
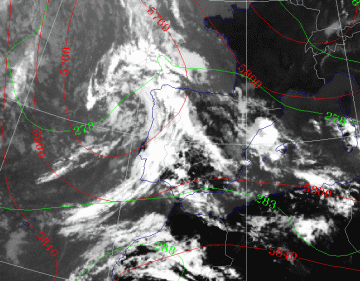
24 September 1997/12.00 UTC - Meteosat IR image; green: equivalent thickness 500/850 hPa, red: height contours 500 hPa
|
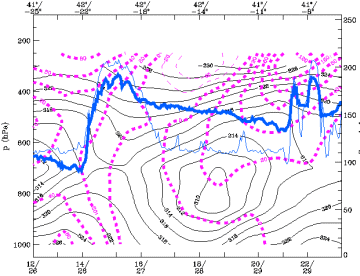
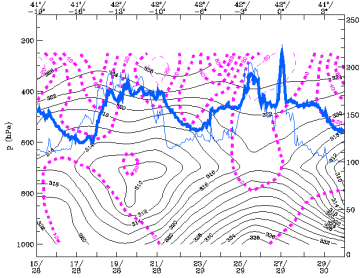
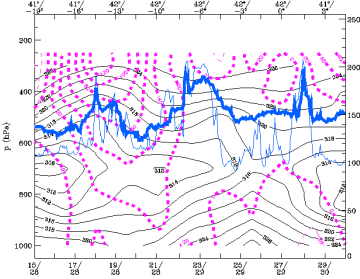
24 September 1997/12.00 UTC - Vertical cross section; black: isentropes (ThetaE), magenta: relative vorticity, blue thin: IR pixel
values, blue thick: WV pixel values
|
The front over Spain lies in the axis of a thickness ridge and, in the cross section, has the characteristics of an occlusion in the ThetaE pattern. This is also the case with the rapidly moving front over the Atlantic. To the rear of the first front, there is a trough visible in the height contours at 500 hPa and in the thickness pattern.
The vorticity maxima in the troughs behind both fronts are very distinct, both at the 500hPa level and in the cross section. In the cross section the highest values of vorticity appear at a higher level than 500 hPa. The 300hPa level is more representative of the situation (see chart below).
|
24 September 1997/12.00 UTC - 300 hPa contours
|
|
The trough at 300 hPa over the west part of the Iberian Peninsula is much sharper than at lower levels.
The smaller trough at 20W is of particular interest. This trough is moving rapidly eastward into the main trough and reactivates this trough
for the further development of the trough into an Upper Level Low ("trigger" mechanism).
25 September 1997/00.00 UTC
Analysis of the system
|
25 September 1997/00.00 UTC - Meteosat IR image; blue: thermal front parameter (TFP) 500/850 hPa; position of vertical cross section
indicated
|
25 September 1997/00.00 UTC - Vertical cross section; black: isentropes (ThetaE), magenta: relative humidity, blue thin: IR pixel
values, blue thick: WV pixel values
|
The front over Spain has moved slightly eastward and is also well defined in the model parameters. It is visible in the TFP values in the image as well as in the humidity parameter in the cross section. The performance of the model fields in detecting the rapidly eastward moving front west of Portugal is poor. Negative TFP and low humidity values don't fit with the cloud configuration in the IR image. Most striking is the strong instability in the front over Spain with a strong lapse rate up to 700 hPa, as seen in the ThetaE values in the cross section.
|
25 September 1997/00.00 UTC - Meteosat IR image; green: equivalent thickness 500/850 hPa, red: height contours 500 hPa
|
25 September 1997/00.00 UTC - Vertical cross section; black: isentropes (ThetaE), magenta: relative vorticity, blue thin: IR pixel
values, blue thick: WV pixel values
|
The Upper Level trough now covers a broad zone containing both systems while in the relative topography the system over Spain is in a thickness ridge and the one west of Portugal is in a trough. In the cross section two maxima of relative vorticity can be distiguished both to the rear of the two systems.
|
25 September 1997/00.00 UTC - 300 hPa contours
|
|
The two vorticity maxima which are visible in the cross section are very distinct at 300hPa as two pronounced troughs.
25 September 1997/12.00 UTC
Analysis of the system
|
25 September 1997/12.00 UTC - Meteosat IR image; blue: thermal front parameter (TFP) 500/850 hPa; position of vertical cross section
indicated
|
25 September 1997/12.00 UTC - Vertical cross section; black: isentropes (ThetaE), magenta: relative humidity, blue thin: IR pixel
values, blue thick: WV pixel values
|
The most easterly front has deformed and dissolved more and more but is still visible in the TFP over north eastern Spain and the Bay of
Biscay. A cluster of CBs is visible in the Barcelona area. The more westerly front is now over Portugal with still no clear indications in the
model fields. In the cross section, the humidity field of the latter system doesn't fit with the actual pixel values of IR and WV; the maximum
of the relative humidity from the model is situated left (west) of the maximum pixel values. The deep unstable layer which was visible in the
ThetaE at 00.00 UTC is still present at the same position now to the rear of the easterly front.
In the area of the cloud band over Morocco the model also indicates a well developed TFP.
|
25 September 1997/12.00 UTC - Meteosat IR image; green: equivalent thickness 500/850 hPa, red: height contours 500 hPa
|
25 September 1997/12.00 UTC - Vertical cross section; black: isentropes (ThetaE), magenta: relative vorticity, blue thin: IR pixel
values, blue thick: WV pixel values
|
Both fronts are now in a broad thickness ridge. The 500hPa trough has deepened and sharpened. The trough axis lies at the rear of the thickness ridge and ahead of a distinct thickness trough which means warm advection over the Iberian peninsula and cold advection more to the west. A very strong maximum of relative vorticity is present in the axis of the 500hPa trough, which can be seen in the cross section.
|
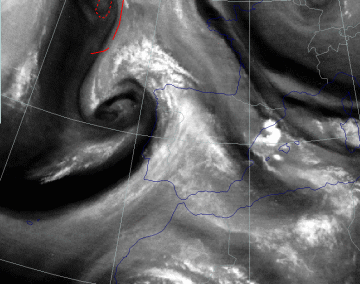
25 September 1997/12.00 UTC - Meteosat WV image; red: height of PV=1 unit
|
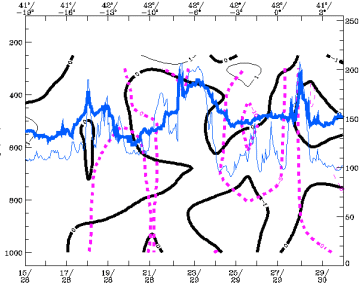
25 September 1997/12.00 UTC - Vertical cross section; black thin: divergence, black thick: convergence, magenta thick: vertical motion
(omega) - upward motion, magenta thin: vertical motion (omega) - downward motion, blue thin: IR pixel values, blue thick: WV pixel
values
|
In the WV image the second front over the Iberian Peninsula is very distinct. But in the cross section no significant vertical velocity is evident while in the (old) front that is located more to the east, relatively strong vertical motion (omega) is visible. West of Portugal a WV dark stripe can be seen indicating dry sinking air. There is a minimum of the height of the tropopause more to the north in the Upper Level Trough but the values are not particularly low.
