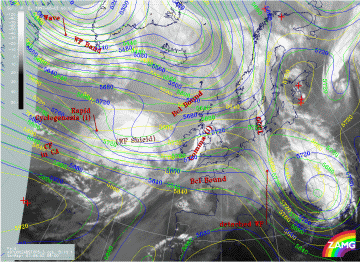
02 - 03 August 1997 - Very Short Range Forecast From 02 August 06.00 UTC - 18.00 UTC
|
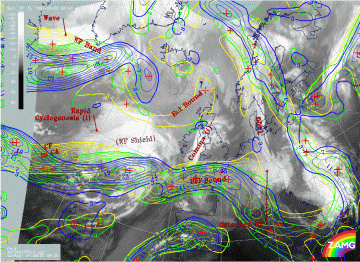
02 August 1997/06.00 UTC - Meteosat IR image; yellow: thermal front parameter (TFP) 500/850 hPa 06.00 UTC, green: thermal front
parameter (TFP) 500/850 hPa 12.00 UTC, blue: thermal front parameter (TFP) 500/850 hPa 18.00 UTC; SatRep overlay: names of conceptual
models
|
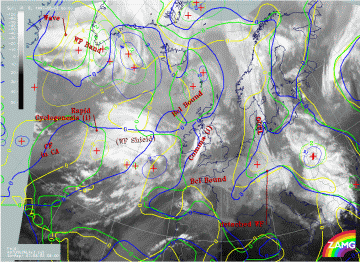
02 August 1997/06.00 UTC - Meteosat IR image; yellow: temperature advection - WA 1000 hPa 06.00 UTC, green: temperature advection - WA
1000 hPa 12.00 UTC, blue: temperature advection - WA 1000 hPa 18.00 UTC; SatRep overlay: names of conceptual models
|
|
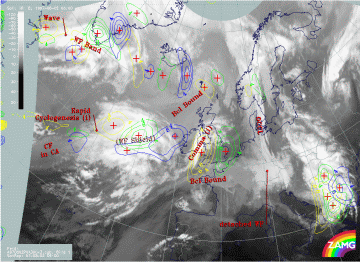
02 August 1997/06.00 UTC - Meteosat IR image; yellow: positive vorticity advection (PVA) 300 hPa 06.00 UTC, green: positive vorticity
advection (PVA) 300 hPa 12.00 UTC, blue: positive vorticity advection (PVA) 300 hPa 18.00 UTC; SatRep overlay: names of conceptual
models
|
|
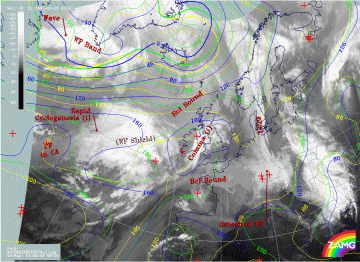
The images show the displacement of the key parameters TFP (left image top), WA (right image top), PVA at 300 hPa (left image bottom), surface (left image below) and finally upper level minimum (right image below). The TFP remains nearly stationary as a whole, which supports the idea of an air mass boundary, but shows rather strong eastward displacement of TFP waves within the west - east oriented zone. Strong eastward propagation can also be seen in the fields of the WA maximum and the PVA maximum which is already very close to Ireland at 18.00 UTC. Both parameters maintain their intensity which could imply that no intensification or decay takes place during the VSRF period. The same is true for the surface minimum which is very indistinct at all times. In contrast to this the upper level height minimum intensifies distinctly during its eastward propagation.
|
02 August 1997/06.00 UTC - Meteosat IR image; yellow: height contours 1000 hPa 06.00 UTC, green: height contours 1000 hPa 12.00 UTC,
blue: height contours 1000 hPa 18.00 UTC; SatRep overlay: names of conceptual models
|
02 August 1997/06.00 UTC - Meteosat IR image; yellow: height contours 500 hPa 06.00 UTC, green: height contours 500 hPa 12.00 UTC,
blue: height contours 500 hPa 18.00 UTC; SatRep overlay: names of conceptual models
|
In particular, the latter two parameters contradict the classical development of a Rapid Cyclogenesis, which in the ideal case shows a dramatic intensification of the surface but a less distinct one for the upper level minimum. This means that although even at 18.00 UTC the existence of Rapid Cyclogenesis cannot be denied, a different conceptual model is developing in the area of the Rapid Cyclogenesis and thereby surpassing its development. It is the development of an Upper Level Low.
