02 - 03 August 1997 - Key Parameters On Isobaric Surfaces For 02 August 06.00 UTC
|
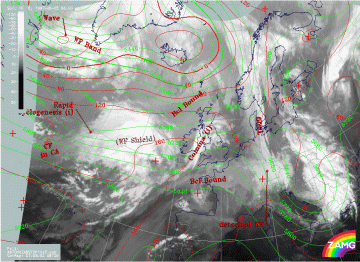
02 August 1997/06.00 UTC - Meteosat IR image; red: height contours 1000 hPa, green: height contours 500 hPa; SatRep overlay: names of
conceptual models
|
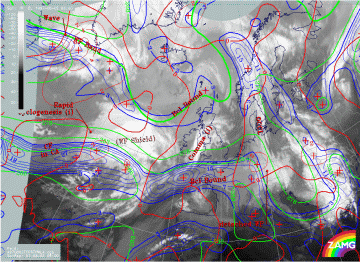
02 August 1997/06.00 UTC - Meteosat IR image; blue: thermal front parameter (TFP) 500/850 hPa, green: equivalent thickness 500/850
hPa, red: temparature advection - WA 1000 hPa; SatRep overlay: names of conceptual models
|
|
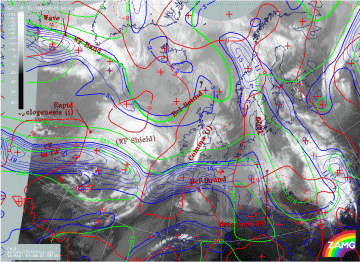
02 August 1997/06.00 UTC - Meteosat IR image; blue: thermal front parameter (TFP) 500/850 hPa, green: equivalent thickness 500/850
hPa, red: temparature advection - CA 1000 hPa; SatRep overlay: names of conceptual models
|
|
To enhance the existence of the conceptual models mentioned above relevant numerical key parameters have to be inspected.
Diagnosis of frontal systems (WF shield, CF in CA) and comma over Ireland
For the frontal systems and the Comma over Ireland the following parameters are indicative: upper level height at 1000 and 500 hPa (left image top), as well as a combination of thickness, thermal front parameter (TFP) and temperature advection TA (right image top and left image bottom).
There is a well-developed west - east oriented zone of high thickness gradients and a maximum of the TFP at the southern edge of the CF in CA and the WF shield. Although there is warm advection (WA) accompanying the biggest part of the Warm Front cloud shield the relative WA maximum, which is a very prominent feature for Warm Fronts, is not very intensive neither from its configuration nor from its absolute values (right image top); the diagnosis as Warm Front is therefore mostly based on the satellite features. There is a distinct maximum of cold advection (CA) superimposed on the Cold Front cloud band with low tops (left image bottom). Also the Comma feature is under the influence of CA which fits to the classical ideas of this conceptual model.
The most important features in the height fields (left image top) can be seen in the upper level (500 hPa) with two small scale upper level troughs. The eastern one is at the rear side of the Comma which consequently can be regarded as an upper level feature caused by PVA indicating the movement of cyclonic vorticity (curvature vorticity in connection with the upper level trough). The western trough is at the rear side of the frontal cloud shield and will be discussed together with the Rapid Cyclogenesis below.
Summarizing, one can say that frontal characteristics do exist but that temperature advection is rather weak. Therefore there is more the situation of an air mass boundary than the situation of an active moving frontal system. The biggest deviations can be noticed for the conceptual model of the Warm Front Shield which is accompanied by a huge cloud shield but only by very weak WA. Small scale upper level troughs seem to be of interest for non-frontal features like the Comma and will be discussed below.
Diagnosis of Rapid Cyclogenesis
|
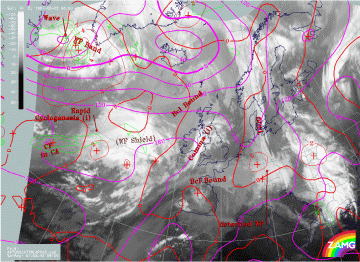
02 August 1997/06.00 UTC - Meteosat IR image; magenta: height contours 1000 hPa, green: positive vorticity advection (PVA) 500 hPa,
red: temparature advection - WA 1000 hPa; SatRep overlay: names of conceptual models
|
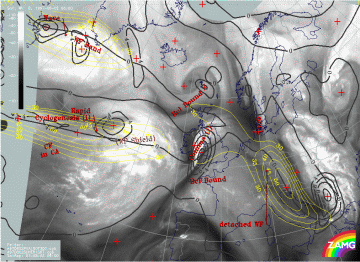
02 August 1997/06.00 UTC - Meteosat WV image; yellow: isotachs 300 hPa, black: shear vorticity 300 hPa; SatRep overlay: names of
conceptual models
|
As already mentioned, there are some distinct indications for Rapid Cyclogenesis in the cloud features. Key parameters and their combinations resulting from the numerical model have to support two different qualities of the conceptual model Rapid Cyclogenesis:
- A Wave development represented by a surface minimum (1000 hPa), a PVA maximum at 500 hPa and the juxtaposition of CA and WA (left image)
- A jet streak with a PVA maximum in the left exit region indicating sinking dry air on the cyclonic side of the jet axis as well as upward motion in the left exit region (right image).
The parameters indicative of Wave development (left image) are not incompatible with Rapid Cyclogenesis development; characteristic features of the parameters exist to the right position of the cloud features. But the surface low is rather weak compared to the ideal situation of this conceptual model. The jet parameters (right image) support a Rapid Cyclogenesis process, too, showing the existence of a jet streak parallel to the higher cloudiness and a PVA maximum in the left exit region. But there are also some deviations: compared with the WV image the jet axis (zeroline of shear vorticity at 300 hPa) is too far to the south, a fact which is even more pronounced in the area of the Warm Front Shield. A northward shift of this zeroline would also result in a northward shift of the PVA maximum in the direction of the higher cloud tops.
|
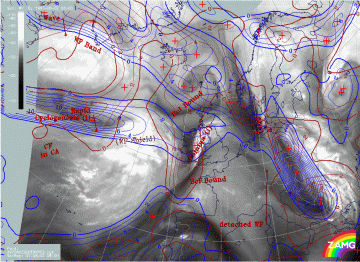
02 August 1997/06.00 UTC - Meteosat WV image; brown: curvature vorticity 300 hPa, blue: shear vorticity 300 hPa; SatRep overlay: names
of conceptual models
|
|
In the image above vorticity is split into its shear and curvature part. Shear vorticity (blue) is very dominant but there is also a curvature vorticity maximum (brown) more to the north-west. This is in accordance with the small scale upper level trough mentioned previously in the frontal diagnosis paragraph.
