19 February 1997 - Use Of Vertical Cross Sections For 00.00 UTC
|
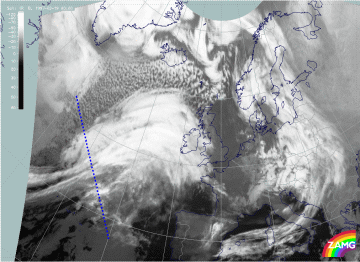
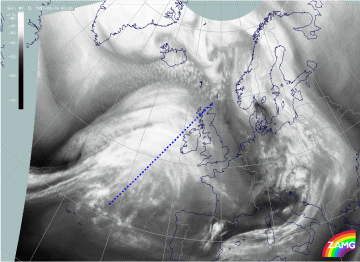
19 February 1997/00.00 UTC - Meteosat IR image; position of vertical cross section indicated
|
|
The cross section line indicative for the cold front is superimposed on the IR image. The block of parameters below reproduces the state of a well developed Cold Front of the Ana type.
|
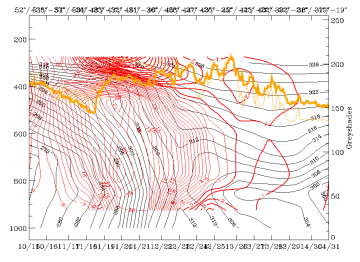
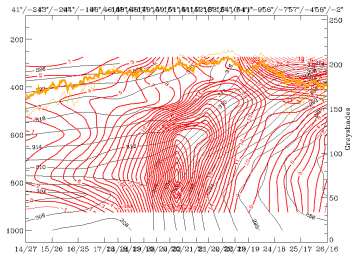
19 February 1997/00.00 UTC - Vertical cross section; black: isentropes (ThetaE), red thin: temperature advection - CA, red thick:
temperature advection - WA, orange thin: IR pixel values, orange thick: WV pixel values
|
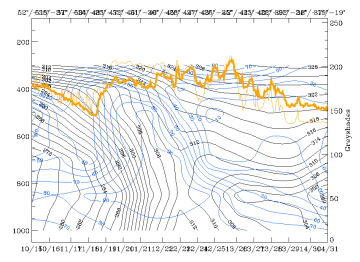
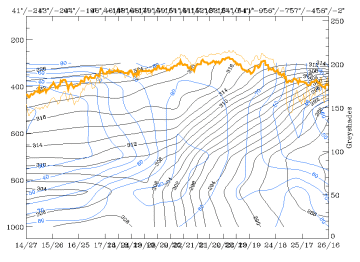
19 February 1997/00.00 UTC - Vertical cross section; black: isentropes (ThetaE), blue: relative humidity, orange thin: IR pixel values,
orange thick: WV pixel values
|
|
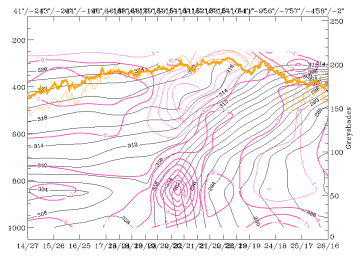
19 February 1997/00.00 UTC - Vertical cross section; black: isentropes (ThetaE), magenta thin: divergence, magenta thick: convergence,
orange thin: IR pixel values, orange thick: WV pixel values
|
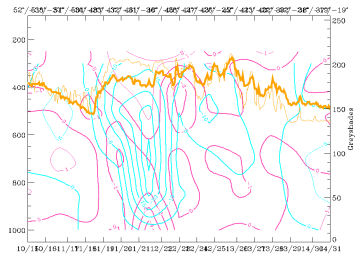
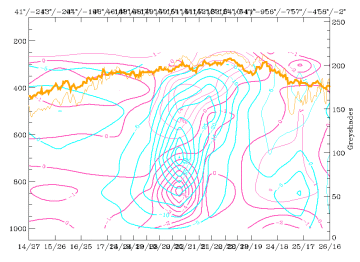
19 February 1997/00.00 UTC - Vertical cross section; cyan thick: vertical motion (omega) - upward motion, cyan thin: vertical motion
(omega) - downward motion, magenta thin: divergence, magenta thick: convergence, orange thin: IR pixel values, orange thick: WV pixel
values pixel values
|
There is a zone of high gradients of isentropes steeply inclined downward from approximately 400 - 500 hPa behind the cloud systems to the surface at approximately 46N/30W showing some double structure in the upper levels; a zone of high humidity accompanied by high pixel values is bent backward (right image top). Temperature advection (left image top) clearly shows that there is CA already in front of the frontal zone, which is quite common for Ana Cold Fronts. The left and right images at the bottom contain a well-developed frontal circulation cell consisting of a convergence zone accompanying the high gradients of the isentropic frontal surface, a divergence zone immediately above this frontal surface and intensive upward motion on top of the convergence and frontal zones.
|
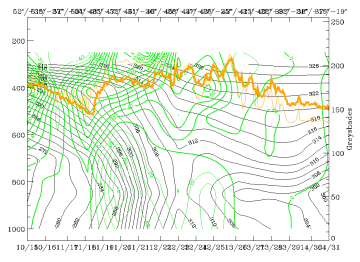
19 February 1997/00.00 UTC - Vertical cross section; black: isentropes (ThetaE), green thick: vorticity advection - PVA, green thin:
vorticity advection - NVA, orange thin: IR pixel values, orange thick: WV pixel values
|
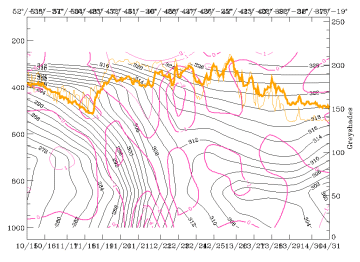
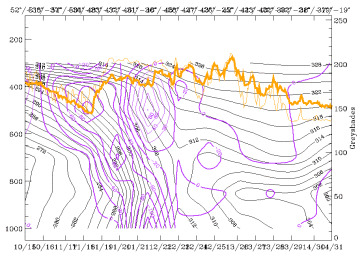
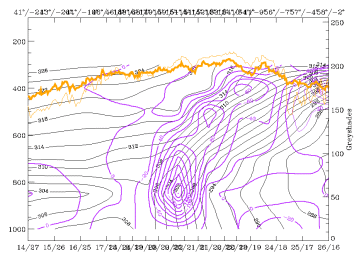
19 February 1997/00.00 UTC - Vertical cross section; black: isentropes (ThetaE), lilac: Q-Vector (normal component), orange thin: IR
pixel values, orange thick: WV pixel values
|
Also positive vorticity advection (PVA) plays an important role in the area of the frontal surface (left image). High values of PVA in upper levels showing increase of PVA with height accompany the whole frontal surface. Finally a frontogenetic parameter (the normal component of the Q-vector) supports this impression of a well-developed strong cold front by a zone of isolines indicating frontogenesis (right image).
|
19 February 1997/00.00 UTC - Meteosat WV image; position of vertical cross section indicated
|
|
The vertical cross section line representing the Warm Front is superimposed on the WV image.
|
19 February 1997/00.00 UTC - Vertical cross section; black: isentropes (ThetaE), red thin: temperature advection - CA, red thick:
temperature advection - WA, orange thin: IR pixel values, orange thick: WV pixel values
|
19 February 1997/00.00 UTC - Vertical cross section; black: isentropes (ThetaE), blue: relative humidity, orange thin: IR pixel values,
orange thick: WV pixel values
|
|
19 February 1997/00.00 UTC - Vertical cross section; black: isentropes (ThetaE), magenta thin: divergence, magenta thick: convergence,
orange thin: IR pixel values, orange thick: WV pixel values
|
19 February 1997/00.00 UTC - Vertical cross section; cyan thick: vertical motion (omega) - upward motion, cyan thin: vertical motion
(omega) - downward motion, magenta thin: divergence, magenta thick: convergence, orange thin: IR pixel values, orange thick: WV pixel
values
|
Also the Warm Front shows a very distinct appearance and structure in the vertical cross section. There is a distinct broad zone of high gradients of isentropes with a Warm Front inclination and a distinct surface front; humidity (right image top) consists of high values within and on top of the frontal zone, and low values below it. There is very pronounced WA (left image top) and (as for the Cold Front) a well-developed frontal circulation cell (left and right image bottom) with convergence within the high gradient of the frontal surface, and intensive upward motion as well as divergence on top of it.
|
19 February 1997/00.00 UTC - Vertical cross section; black: isentropes (ThetaE), lilac: Q-Vector (normal component), orange thin: IR
pixel values, orange thick: WV pixel values
|
|
From the normal component of the Q-vector (right image top) frontogenesis can be supposed especially within the lower layers of the frontal surface.
Summarizing these diagnoses one can say that both Cold Front and Warm Front represent well-developed conceptual models (compare Conceptual Models: Cold Front and Conceptual Models: Warm Front Shield ) with rather classical distributions of the relevant key parameters. The next sub-chapter deals with the frontal situation six hours later (compare Frontal Diagnosis - 19 February 1997/06.00 UTC).
