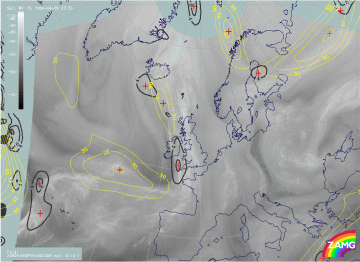
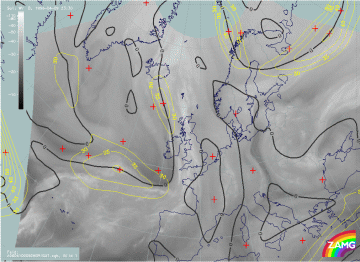
09 - 10 April 1996 - Forecast For Wave
|
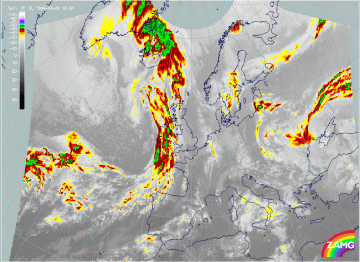
09 April 1996/18.00 UTC - Meteosat IR enhanced image
|
|
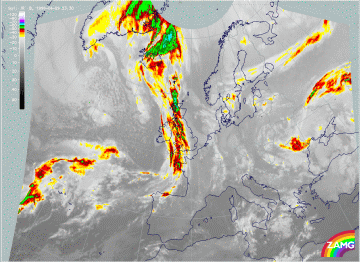
The satellite image shows the wave above the Atlantic south of Ireland; this area is characterized by cold (high) cloud tops. This local intensification of the frontal cloudiness is a combination of two conceptual models:
- Wave (for more information compare also Conceptual Models: Wave )
- Intensification of frontal cloudiness within the left exit region of a jet streak (for more information see also Conceptual Models: Front Intensification by Jet Crossing )
|
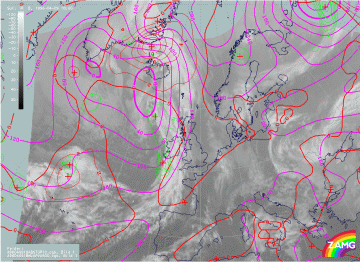
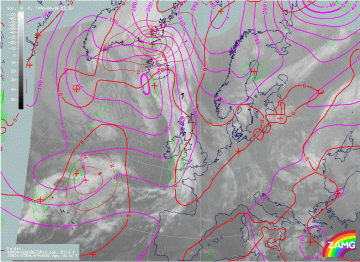
09 April 1996/18.00 UTC - Meteosat IR image; magenta: height contours 1000 hPa, green: positive vorticity advection (PVA) 500 hPa, red:
temperature advection - WA 1000 hPa
|
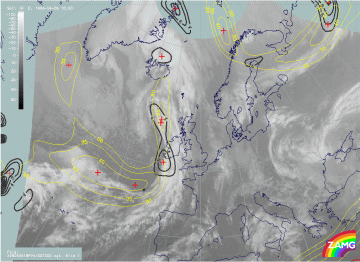
09 April 1996/18.00 UTC - Meteosat IR image; yellow: isotachs 300 hPa, black: positive vorticity advection (PVA) 300 hPa
|
|
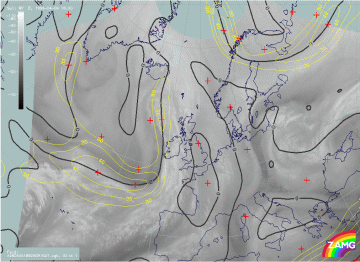
09 April 1996/18.00 UTC - Meteosat WV image; yellow: isotachs 300 hPa, black: shear vorticity 300 hPa
|
09 April 1996/18.00 UTC - Meteosat IR image; green: curvature vorticity 300 hPa, blue: shear vorticity 300 hPa
|
|
09 April 1996/18.00 UTC - Meteosat IR image; red: positive vorticity advection (PVA) 300 hPa
|
|
The satellite image (left image top) contains the relevant key parameters for a Wave. The absolute topography at 1000 hPa is characterized by a trough situated immediately upstream of the Wave. The field of temperature advection within the area of the Wave is not pronounced. The zero line of temperature advection changes within the area of the cloud bulge from the leading to the rear edge of the cloud band. This configuration of the zero line is typical for a weak maximum of warm advection situated downstream of the cloud bulge (at approximately 48N/07W). This distribution of the temperature advection indicates that there is little temperature contrast between the different air masses involved in the circulation of the Wave. The consequence of this meteorological process is that the field of temperature advection makes no contributions to the frontogenesis process. Therefore in this case the only parameter which is relevant for the increased cloudiness will be the field of PVA.
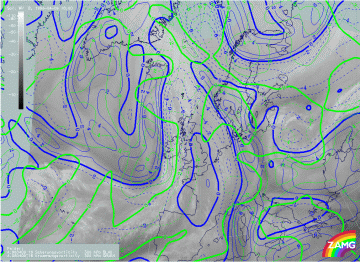
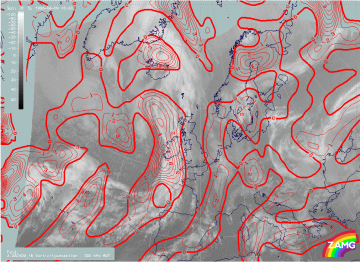
In contrast to the temperature advection, the field of vorticity advection contains a strong maximum of PVA at 500 and 300 hPa. For a classical distribution of vorticity advection in the case of a wave, this PVA maximum is situated too far downstream (for more information compare also Conceptual Models: Wave - Key parameters ). The reason for this displacement is that this area is also a left exit region of an approaching jet streak (compare right image top and left image middle). Therefore this PVA maximum is caused, especially at 300 hPa, by curvature vorticity as well as by shear vorticity (right image middle).
The WV images (right image top and left image middle) contain two combinations of the key parameters which are typical for intensification of frontal cloudiness within the left exit region of a jet streak. Compared with the isotachs in both images, it can be observed that there are also some deviations concerning the distribution of vorticity advection in the case of the Wave. The left image bottom contains the IR image with the superimposed field of PVA at 300 hPa. It can be observed that the model shows a broad zone of pronounced PVA values within this region. Due to the grid resolution of the model (150 km) there is no separation of PVA maxima between both conceptual models. Only a slight trough (at approximately 49N/11W) within the area of the left exit region can be interpreted as an indication for a second PVA maximum. However, both PVA maxima are situated very close to the jet axis. The left WV image (left image middle) contains the zero line of shear vorticity at 300 hPa, which is an indication of the jet axis. The reason for this distribution of the maxima can be found in the field of curvature vorticity at 300 hPa (right image middle). In the classical case, which describes a straight or only slightly curved jet streak, the PVA maximum is clearly separated from the jet axis. But in reality, as also in this case, the curvature of the jet streak is mostly stronger. The consequence of this orientation of the jet is that the PVA can be found on the cyclonic as well as on the anticyclonic side of the jet axis. The maximum of PVA can be found, due to the additional existing shear, on the cyclonic side very close to the jet axis (like for instance the trough at approximately 49N/11W) (for more information see also Conceptual Models: Front Intensification by Jet Crossing ). But, however, the main maximum of the PVA within this area can be found at the anticyclonic side of the jet. The reason for this is that the wave has a much stronger influence on the distribution of the PVA field than the intensification within the left exit region.
|
09 April 1996/00.00 UTC - Meteosat IR enhanced image
|
|
The satellite image at 00.00 UTC shows the wave above Ireland. During the last six hours there has been no further frontogenetic development (due to the missing temperature contrast at 18.00 UTC between the two air masses involved in the Wave development process). But besides this the wave has been modified from a so-called classical Wave to a combination of classical Wave and, especially within the upper levels of the troposphere, a so-called Jet Wave. Within the satellite image the area of the Wave is characterized by a well-developed cloud fibre extending from south Ireland to the Atlantic at approximately 58N/10W. This cloud fibre is a typical indication for a superimposed jet streak (for more information see also Conceptual Models: Upper Wave ).
|
10 April 1996/00.00 UTC - Meteosat IR image; magenta: height contours 1000 hPa, green: positive vorticity advection (PVA) 500 hPa, red:
temperature advection - WA 1000 hPa
|
10 April 1996/00.00 UTC - Meteosat WV image; isotachs 300 hPa, black: positive vorticity advection (PVA) 300 hPa
|
|
10 April 1996/00.00 UTC - Meteosat WV image; yellow: isotachs 300 hPa, black: shear vorticity 300 hPa
|
|
Looking at the relevant key parameters for the cloud intensification within the Wave area (left image), it can be observed that, as at 18 UTC, there is hardly any temperature contrast between the two air masses involved in the Wave development process. In contrast to this, the field of PVA contains a strong maximum at 500 hPa downstream of the wave bulge, indicating the deepening of the trough.
The upper levels of the troposphere (right image) are characterized by a jet stream situated parallel to the rear cloud edge of the frontal cloud band. Within the jet stream a jet streak can be found downstream of the Wave. The area is within the entrance region of this jet streak.
