Overview and new aspects
In addition to the parameters on isentropic surfaces the conceptual model "Front Decay" shows up very well in some parameters on isobaric surfaces. These partly rather basic parameters are available in forecast fields, and therefore be used operationally. The case study is in very good agreement with the basic findings.
Jet streak and Vorticity Advection
|
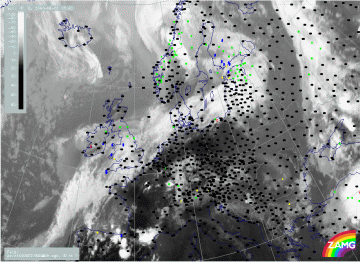
02 June 2000/18.00 UTC - Meteosat IR image; weather events (green: rain and showers, blue: drizzle, cyan: snow, purple: freezing rain,
red: thunderstorm with precipitation, orange: hail, black: no actual precipitation or thunderstorm with precipitation)
|
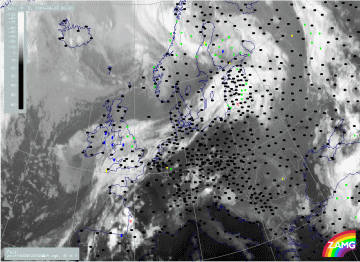
03 June 2000/00.00 UTC - Meteosat IR image; weather events (green: rain and showers, blue: drizzle, cyan: snow, purple: freezing rain,
red: thunderstorm with precipitation, orange: hail, black: no actual precipitation or thunderstorm with precipitation)
|
|
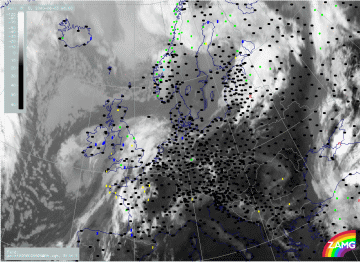
03 June 2000/06.00 UTC - Meteosat IR image; weather events (green: rain and showers, blue: drizzle, cyan: snow, purple: freezing rain,
red: thunderstorm with precipitation, orange: hail, black: no actual precipitation or thunderstorm with precipitation)
|
|
In this case study, the demonstration of a probable weakening of reported weather phenomena associated with cloud dissipation of Front Decay is
hindered by the fact that much of the cloud band lies over the North Sea and the Baltic Sea. At 02/18.00 UTC, weather reports from the British
Isles, Denmark and the Baltic States imply that the frontal cloud band is quite active, mostly accompanied by precipitation.
As a result of the dissipation of frontal clouds over Denmark at 00.00 UTC there are no more reports of precipitation over this region. By
06.00 UTC, the Front Decay is clearly seen, however there are only a few surface reports in this mainly maritime region.


