Temperature Advection
In addition to the parameters on isentropic surfaces the conceptual model "Front Decay" shows up very well in some parameters on isobaric surfaces. These partly rather basic parameters are available in forecast fields, and therefore be used operationally. The case study is in very good agreement with the basic findings.
Temperature Advection
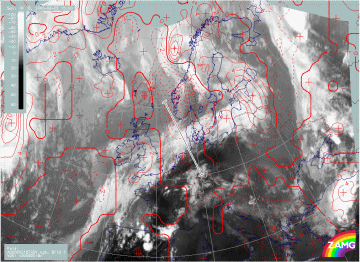
At 02/18.00 UTC there is marked CA over the frontal cloud band. The zero line of temperature advection (TA) appears almost at right angles to
the front line.
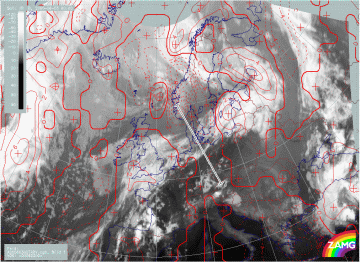
In the right image below, six hours later, the effect of this CA can already be seen as the dissipation zone of the frontal cloud band and
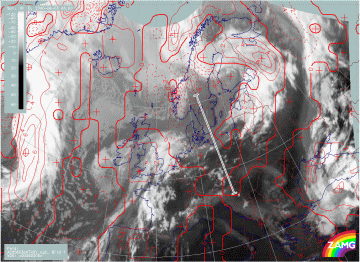
there is very good agreement between the CA zone and the cloud gap. By 06.00 UTC the CA is weakening. Upstream, the maximum of WA is associated
with the newly developed Warm Front over Great Britain and the North Sea. Downstream of the dissipation zone, a Cold Front in Warm Advection
has developed.
|
02 June 2000/18.00 UTC - Meteosat IR image; red dashed: temperature advection - CA 700 hPa, red solid: temperature advection - WA 700
hPa, position of vertical cross section indicated
|
03 June 2000/00.00 UTC - Meteosat IR image; red dashed: temperature advection - CA 700 hPa, red solid: temperature advection - WA 700
hPa, position of vertical cross section indicated
|
|
03 June 2000/06.00 UTC - Meteosat IR image; red dashed: temperature advection - CA 700 hPa, red solid: temperature advection - WA 700
hPa, position of vertical cross section indicated
|
|
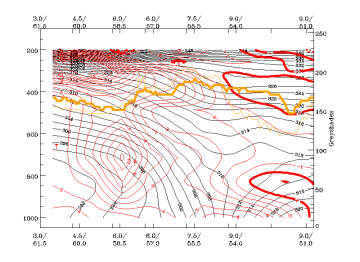
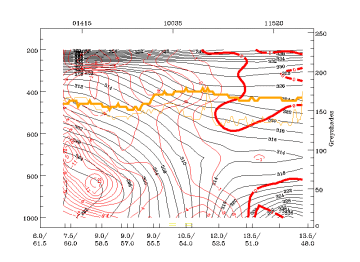
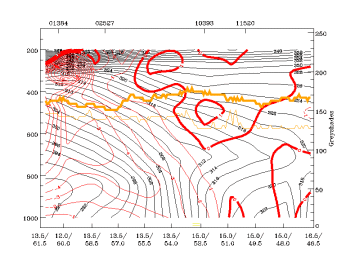
In addition to TA at 700 hPa, vertical cross sections of TA also support the conceptual model for Front Decay: The positions of the vertical cross sections are indicated in the satellite images above.
|
02 June 2000/18.00 UTC - Vertical cross section; black: isentropes (ThetaE), red thin: temperature advection - CA, red thick:
temperature advection - WA, orange thin: IR pixel values, orange thick: WV pixel values
|
03 June 2000/00.00 UTC - Vertical cross section; black: isentropes (ThetaE), red thin: temperature advection - CA, red thick:
temperature advection - WA, orange thin: IR pixel values, orange thick: WV pixel values
|
|
03 June 2000/06.00 UTC - Vertical cross section; black: isentropes (ThetaE), red thin: temperature advection - CA, red thick:
temperature advection - WA, orange thin: IR pixel values, orange thick: WV pixel values
|
|
At 18.00 UTC the decaying part of frontal cloud band is located in CA at all levels with a strong maximum at middle levels around 700 hPa. At 00.00 UTC the maximum of CA is at middle and lower levels, indicating strong descent over the previous six hours, also shown by the relative streams. At 06.00 UTC CA is weaker. WA at higher levels leads to stabilisation within the air column.
