Weather Events
| Parameter | Description |
| Precipitation |
|
| Temperature |
|
| Wind (incl. gusts) |
|
| Other relevant information |
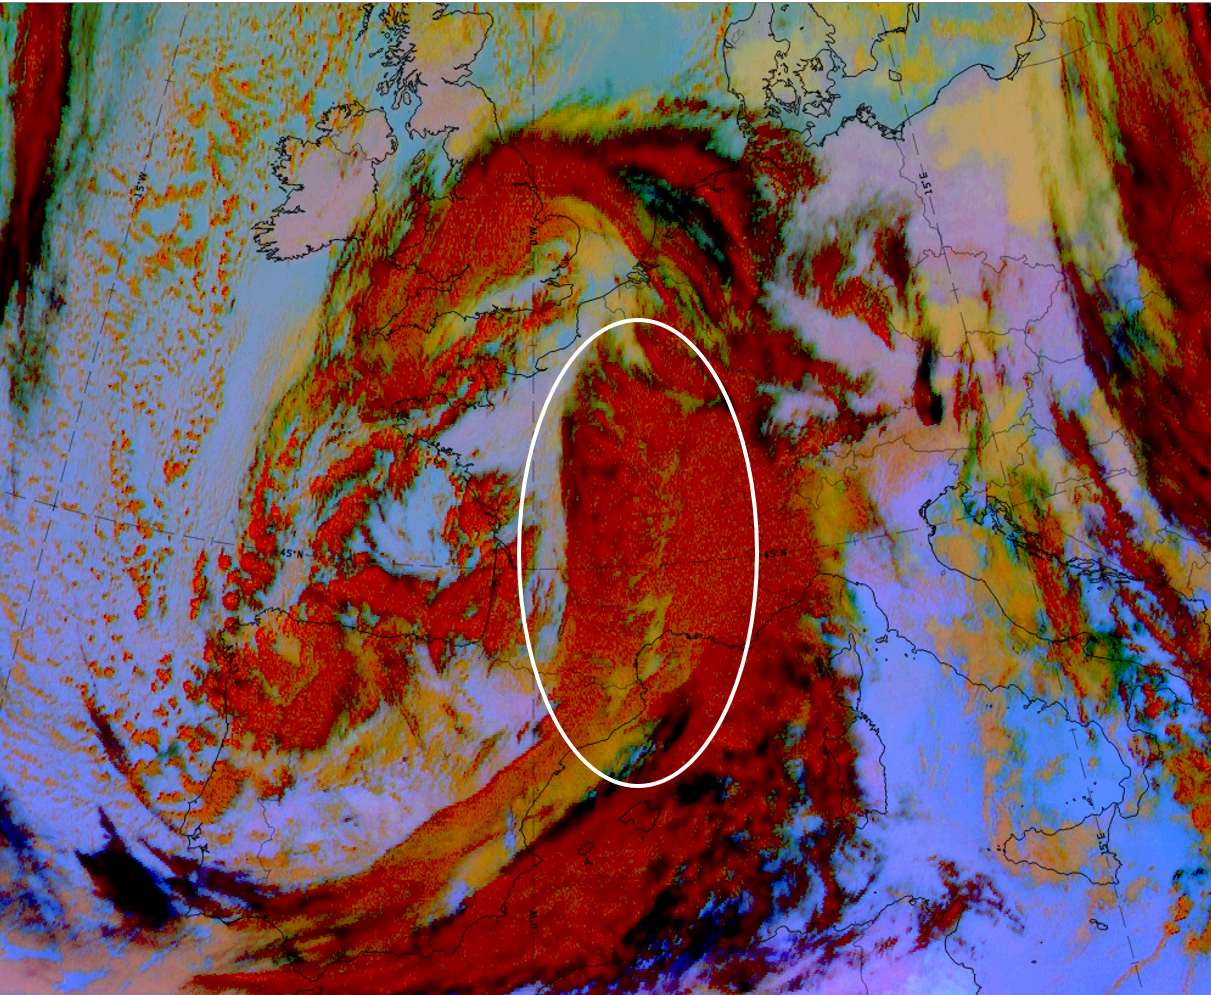
As example for studying the weather events in the area of a wave the case of 14 November 2019 at 12 UTC has been chosen. The S-shape is very pronounced but there is double structure. Together with other parameters, this double structure means that the centre of the wave development is located within the centre of the white ellipse in the figure below.
|
|
Legend:
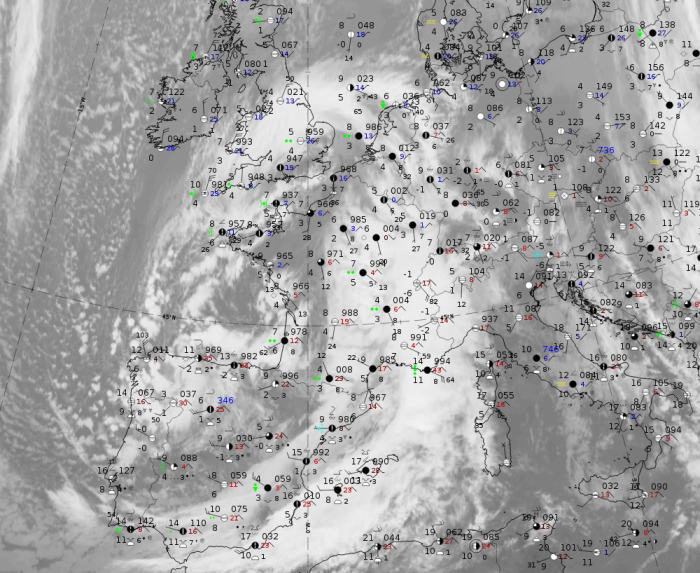
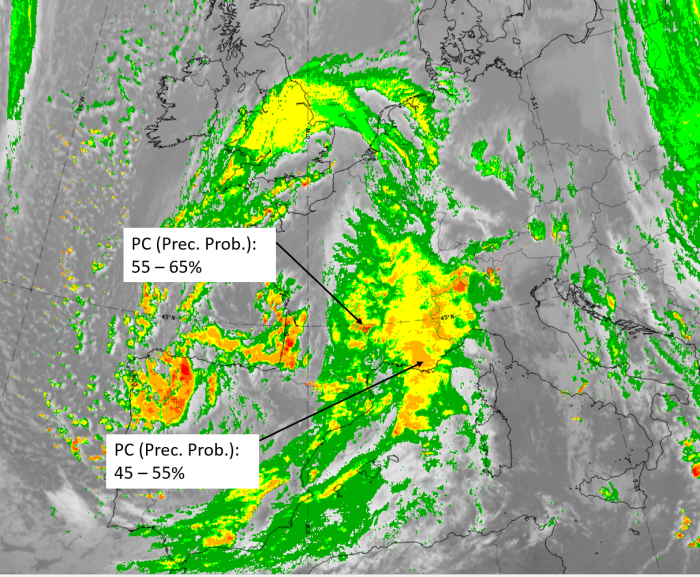
14 November 2019 at 12UTC: IR + synoptic measurements (above) + probability of moderate rain (Precipitting clouds PC - NWCSAF).
Note: for a larger SYNOP image click this link.
There are widespread and heavy precipitation rate measurements in the area and in the centre of the cloud bulge. To the western and northern boundary, only overcast observations exist; this appears quite often and represents the outflowing high cloudiness in the direction of the upper level stream.
|
|
|
|
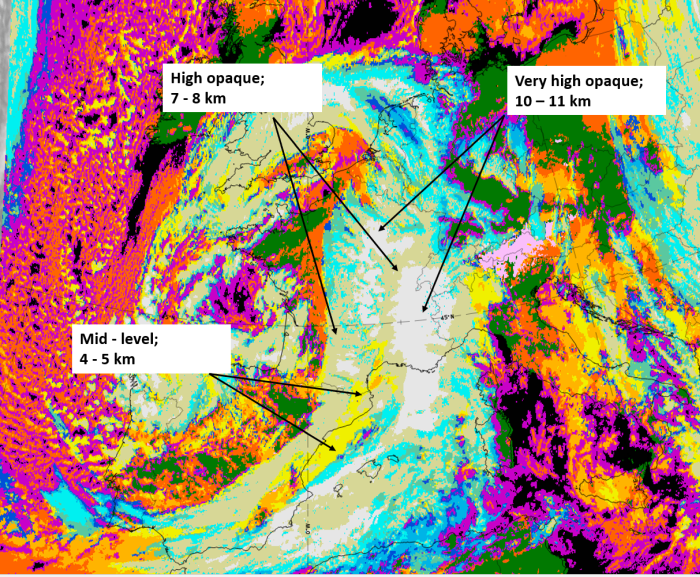
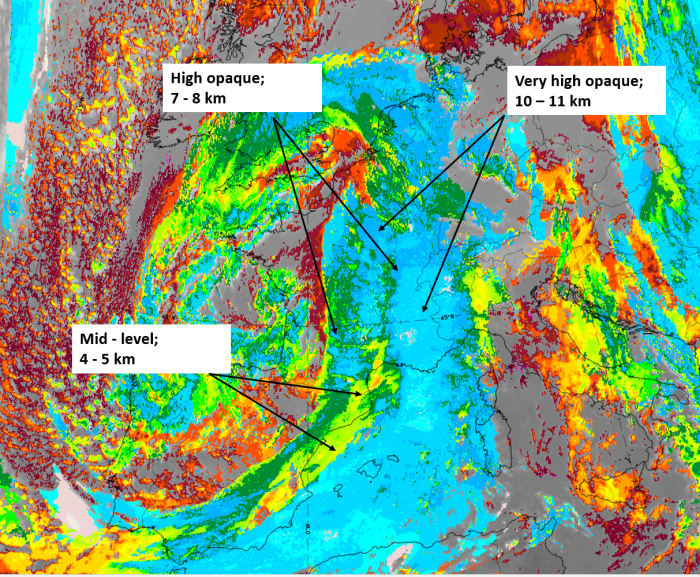
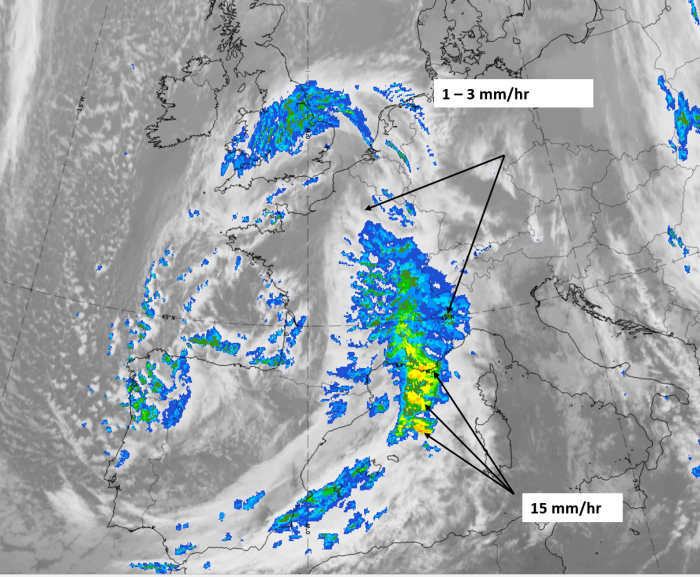
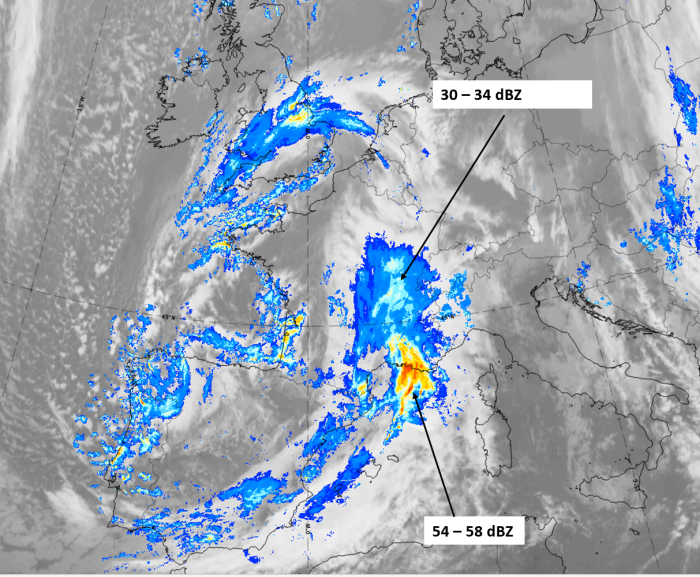
14 November 2019 at 12 UTC;
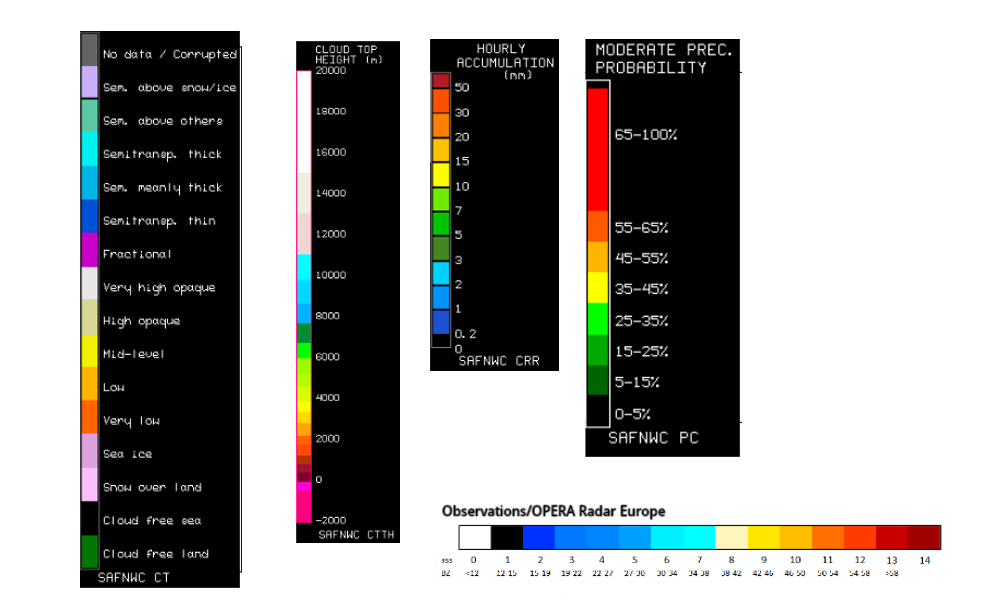
1st row: Cloud Type (CT NWCSAF) (above) + Cloud Top Height (CTTH - NWCSAF) (below); 2nd row: Convective Rainfall Rate (CRR NWCSAF) (above) + Radar intensities from Opera radar system (below).
For identifying values for Cloud type (CT), Cloud type height (CTTH), precipitating clouds (PC), and Opera radar for any pixel in the images look into the legends. (link).