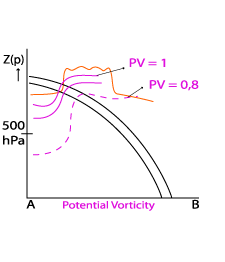
Typical Appearance In Vertical Cross Sections
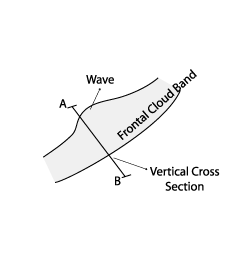
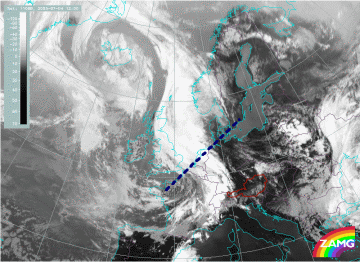
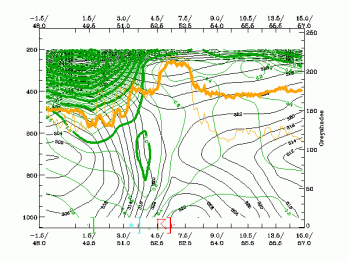
The convection associated with a Wave is well reflected in the vertical cross sections shown below. From the Wave point a vertical cross section was drawn though the frontal band. Weather symbols which are plotted on the images reflect its convective character and give indications of rain, snow and thunderstorms, respectively. For the various parameters the following can be concluded:
- Isentropes :
Isentropes show mainly frontal character. No impact from Wave. - Temperature Advection:
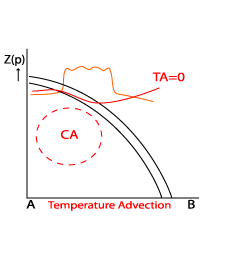
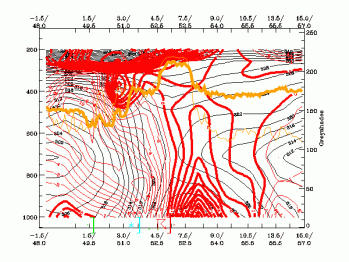
Maximum at 300 hPa or at higher levels, associated with tropopause folding (related to potential vorticity), cold advection below the Wave bulge at lower levels. - Vorticity Advection:
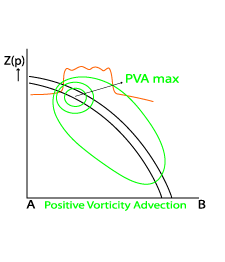
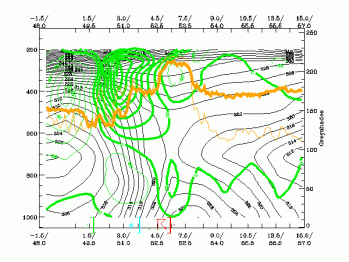
Significant maximum of positive vorticity advection at upper levels connected to the sharpening of the upper level trough at 300 hPa. - Vertical motion:
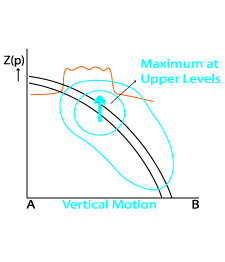
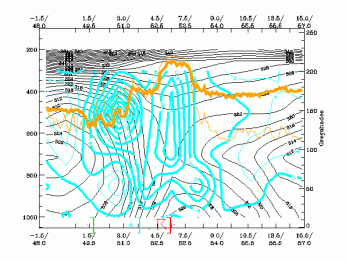
Vertical motion indicates rising air, with the maximum at upper levels, due to a rising upper relative stream.
|
04 July 2005/12.00 UTC - Meteosat 8 IR 10.8 image; position of vertical cross section indicated
|
|
Temperature advection: vertical cross sections from numerical model
|
04 July 2005/12.00 UTC - Vertical cross section; black: isentropes (ThetaE), red thin: temperature advection - CA, red thick: temperature advection - WA, orange thin: IR pixel values, orange thick: WV pixel values
|
|
Positive vorticity advection: vertical cross sections from numerical model
|
04 July 2005/12.00 UTC - Vertical cross section; black: isentropes (ThetaE), green thin: vorticity advection - NVA, green thick: vorticity advection - PVA, orange thin: IR pixel values, orange thick: WV pixel values
|
|
Vertical motion (Omega): vertical cross sections from numerical model
|
04 July 2005/12.00 UTC - Vertical cross section; black: isentropes (ThetaE), cyan: vertical motion (omega) - upward motion, orange thin: IR pixel values, orange thick: WV pixel values
|
|
Potential vorticity: vertical cross sections from numerical model
|
4 July 2005/12.00 UTC - Vertical cross section; black: isentropes (ThetaE), dark green thin: potential vorticity <1 unit, dark green thick: potential vorticity >=1 unit, orange thin: IR pixel values, orange thick: WV pixel values
|
|
