Cloud Structure In Satellite Images
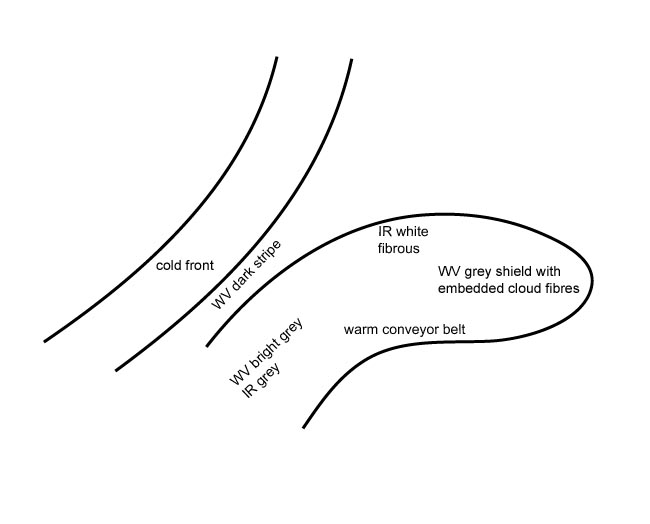
In the satellite image the Warm Conveyor Belt looks like an anticyclonically curved cloud band. The warm conveyor belt is usually in front of, but separated from, the cloud band of the Cold Front.
Appearance in the basic channels:
- In the IR and WV images the grey shades of the Warm Conveyor Belt cloud band vary from grey to white.
- The fibrous texture dominates here but there may be bigger areas of smooth high-level cirrus clouds.
- In the VIS image the cloud of the Warm Conveyor Belt is much weaker; if there is any appreciable cloud, it consists of only small single cells.
- As a consequence of the ascending Warm Conveyor Belt, the grey shades in the IR image become continuously brighter from south to north or north-east. From there on the brightness decreases again while it turns to south-east where it comes under the influence of sinking.
- During the life cycle some interactions between the Warm Conveyor Belt and the frontal cloud band can be observed:
- taller cells may develop at the rear edge which is oriented to the approaching Cold Front;
- the anticyclonic part of the Warm Conveyor Belt may merge with the frontal cloud of the Cold Front;
- sometimes the southern boundary of the Cold Front bands show embedded high cloud patches.
Appearance in the basic RGBs:
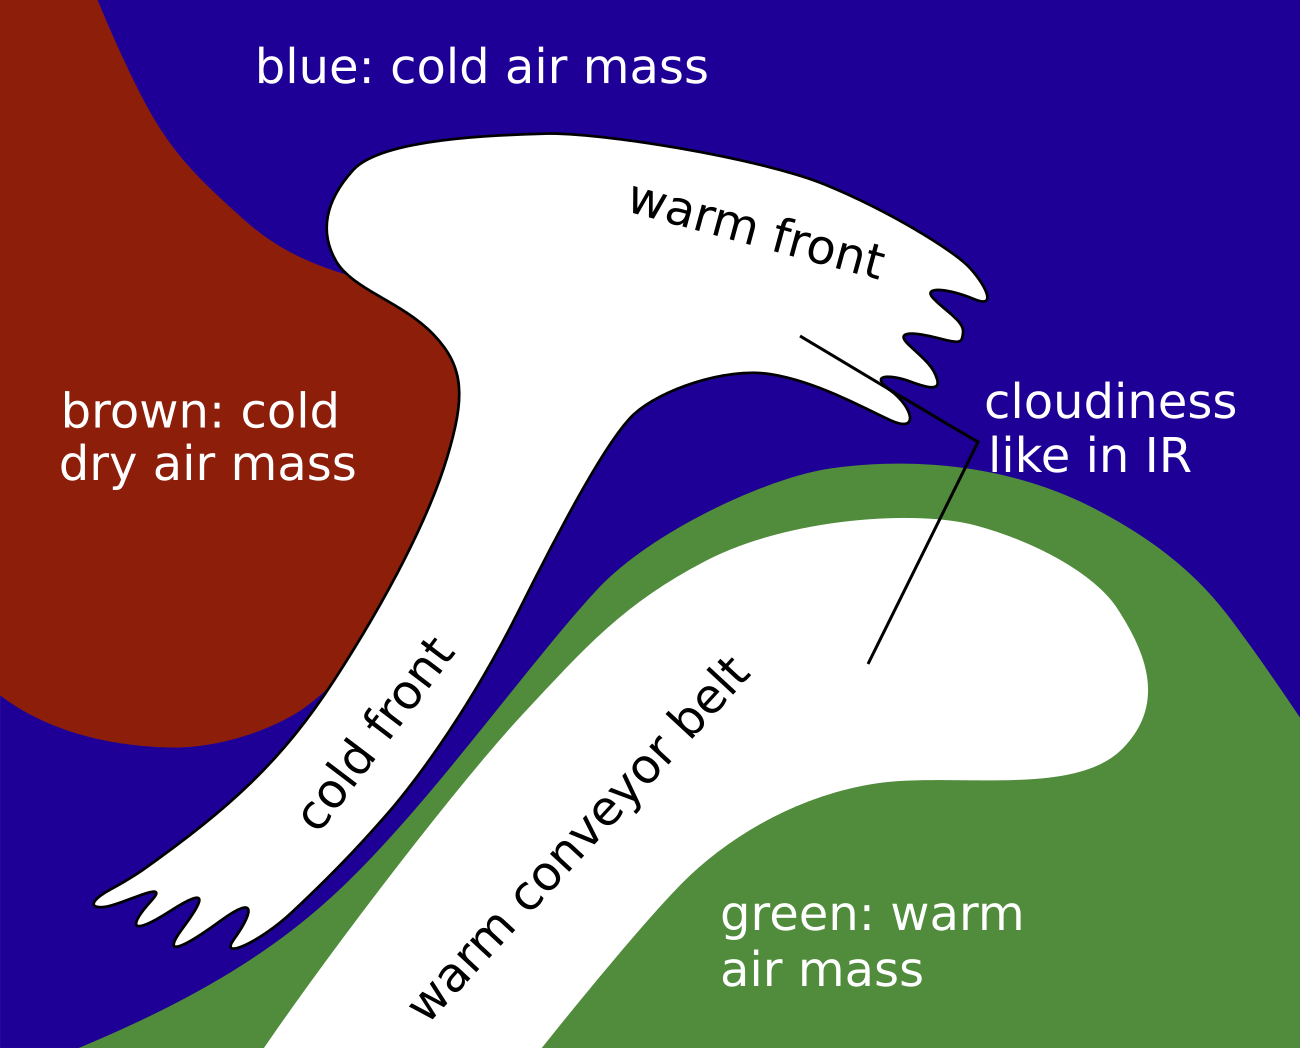
Airmass RGB
As the Warm Conveyor Belt cloudiness develops mostly in front of a CF cloud band, different air masses are discernible. Firstly, there is the cold and dry air mass behind the cold front. Also, greenish to blue colours prevail between the cold front and warm conveyor belt cloud, representing the protruding colder air from the west. Greenish colours exist in the south and southeast part of the warm conveyor belt cloud, representing the warm air masses in front of the system.
The cloud of a Warm Conveyor Belt is very similar to those seen in the IR image. Upper level processes - for instance the development of high lee cloudiness - are often superimposed, increasing the cloud fraction there. This process can very often be seen in the Mediterranean Sea, at Italy, and in the west of the Balkan Peninsula.
Dust RGB
In the dust RGB there is a mixture of dark-red and black fibres or patches, depending on the thickness of the ice cloud.
 |
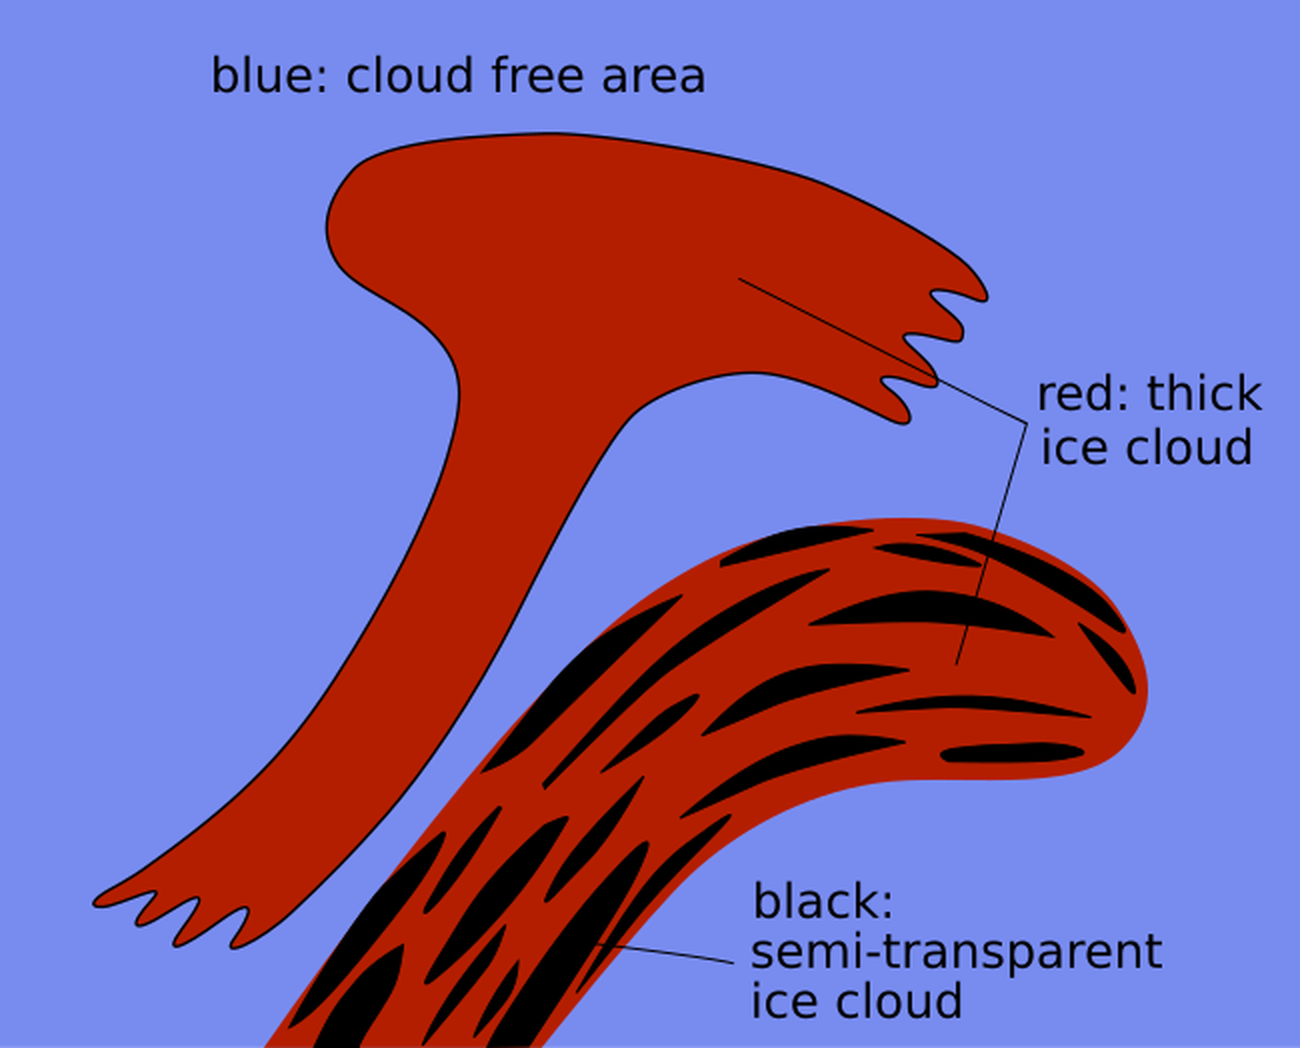 |
Legend: Schematics for basic RGBs, Left: Airmass RGB; right: Dust RGB.
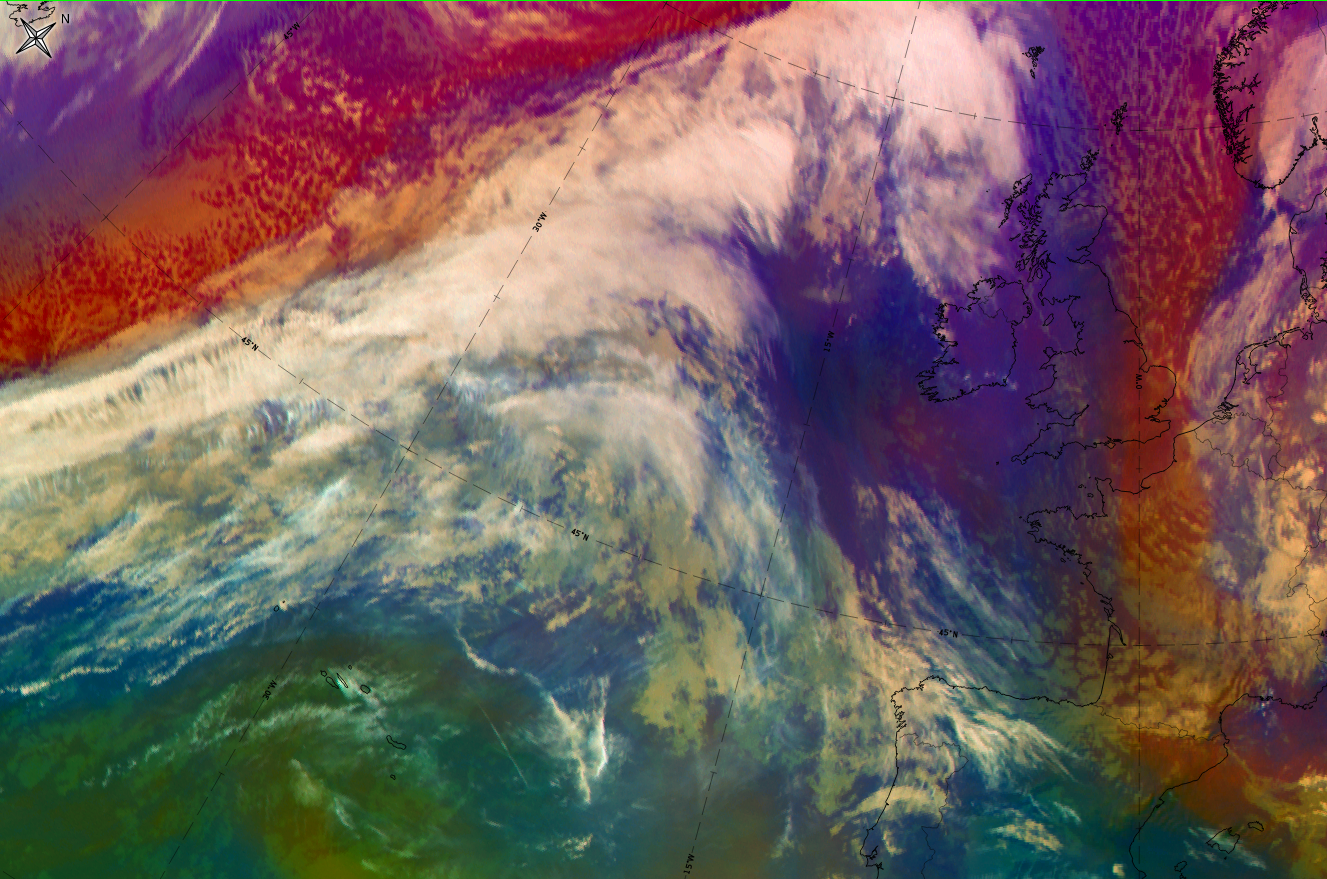
The example from 9 December 2019 at 12 UTC shows an example over the Atlantic where CF and WCB clouds are close together, almost merging.
|
|

|
|

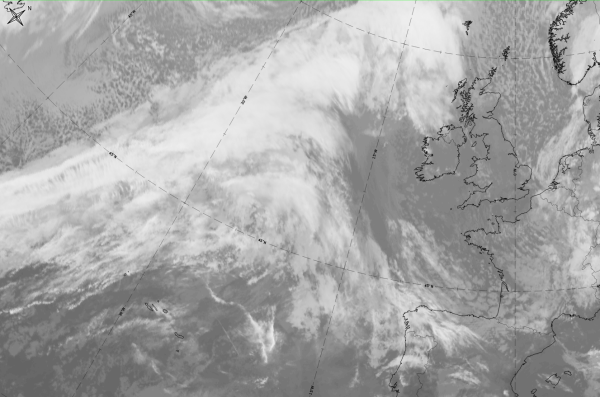
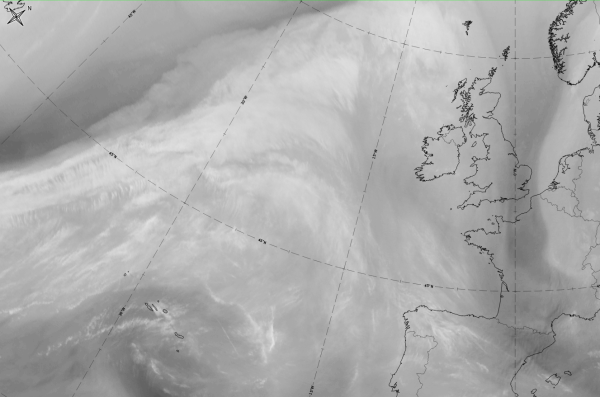
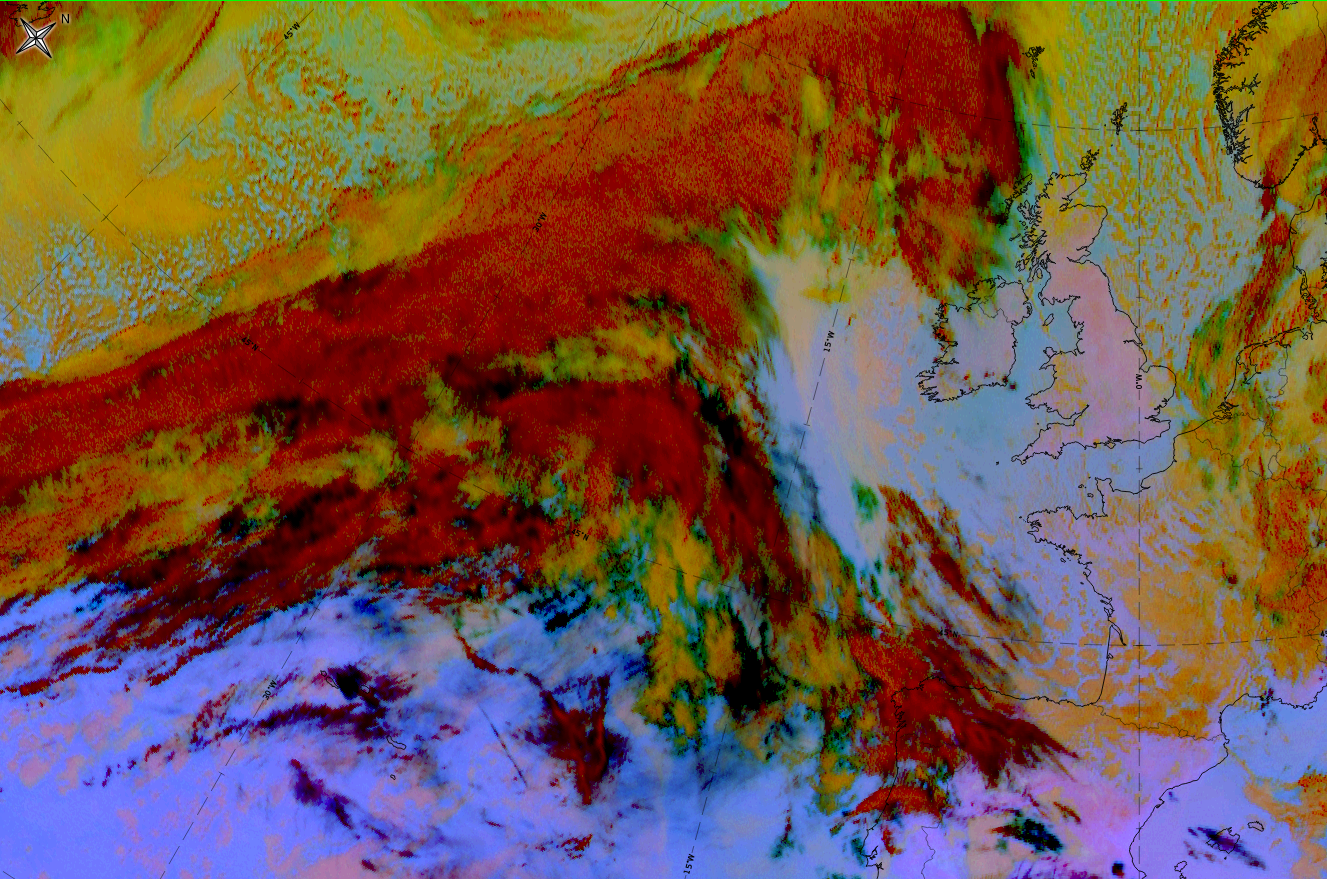
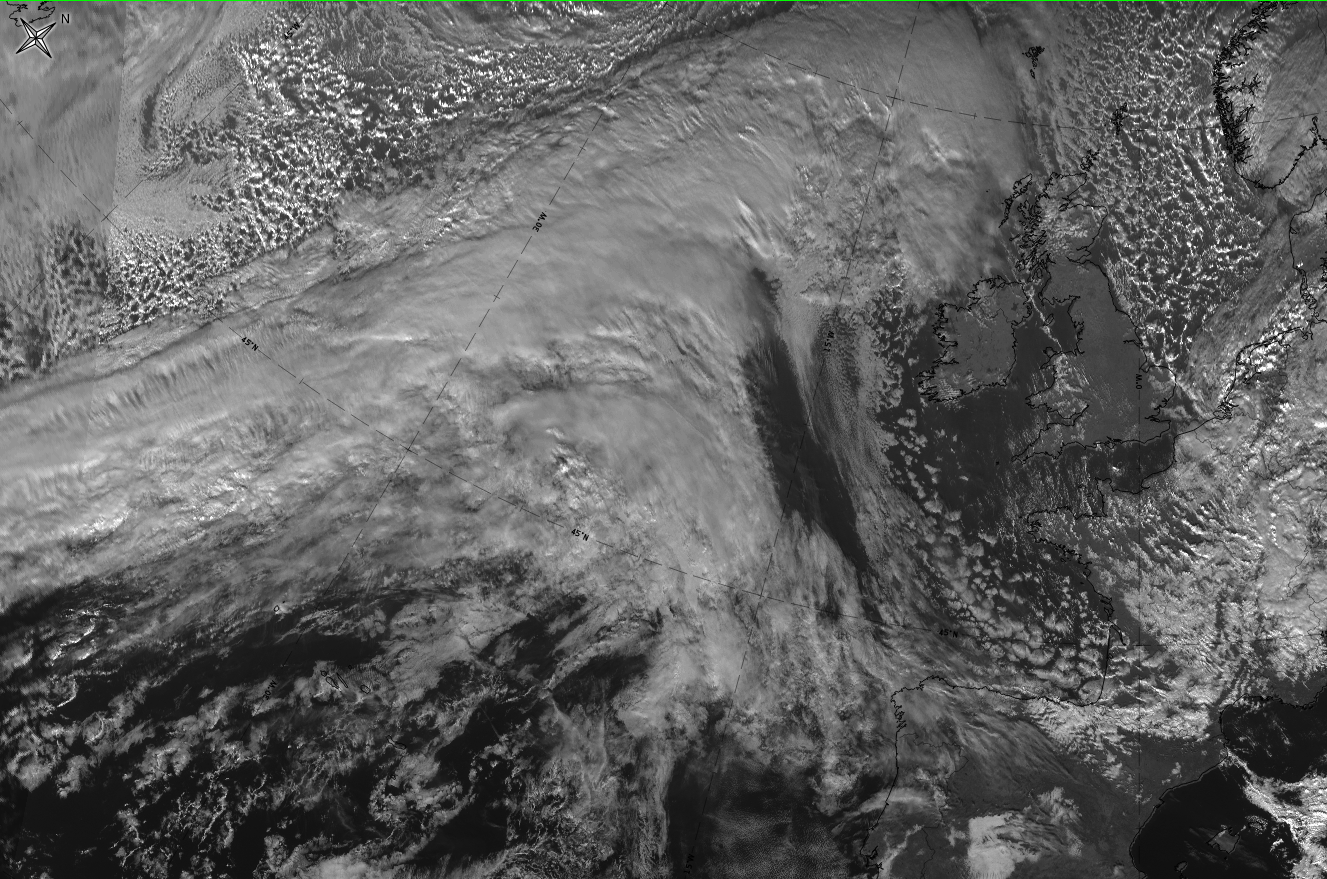
9 December 2019 at 12UTC: 1st row: IR (above) + HRV (below); 2nd row: WV (above) + Airmass RGB (below); 3rd row: Dust RGB + image gallery.
*Note: click on the Dust RGB image to access image gallery (navigate using arrows on keyboard).
| IR | The anticyclonically curved cloud band appears fibrous with white to light grey colours. Brighter and larger patches exist in the north-eastern ascending part of the WCB. |
| HRV | Dark-grey (partly through illumination) and fibrous cloud; brighter and thicker in the north-eastern ascending part of the WCB. |
| WV | Light grey in an anticyclonically curved broad area, with white structures from fibres and thicker cloud patches. |
| Airmass RGB | Clouds similar to those in the IR, within blue below for cold airmass and green below in the southern and south-western part, representing the warm airmass from which the WCB starts rising. |
| Dust RGB | Black cloud fibres in the south west, becoming dark red in the north-eastern ascending part of the WCB. Ochre colours represent the mid-level cloud in the areas of broken cloud in the WCB, as well as between the cold front cloud band and the WCB. |
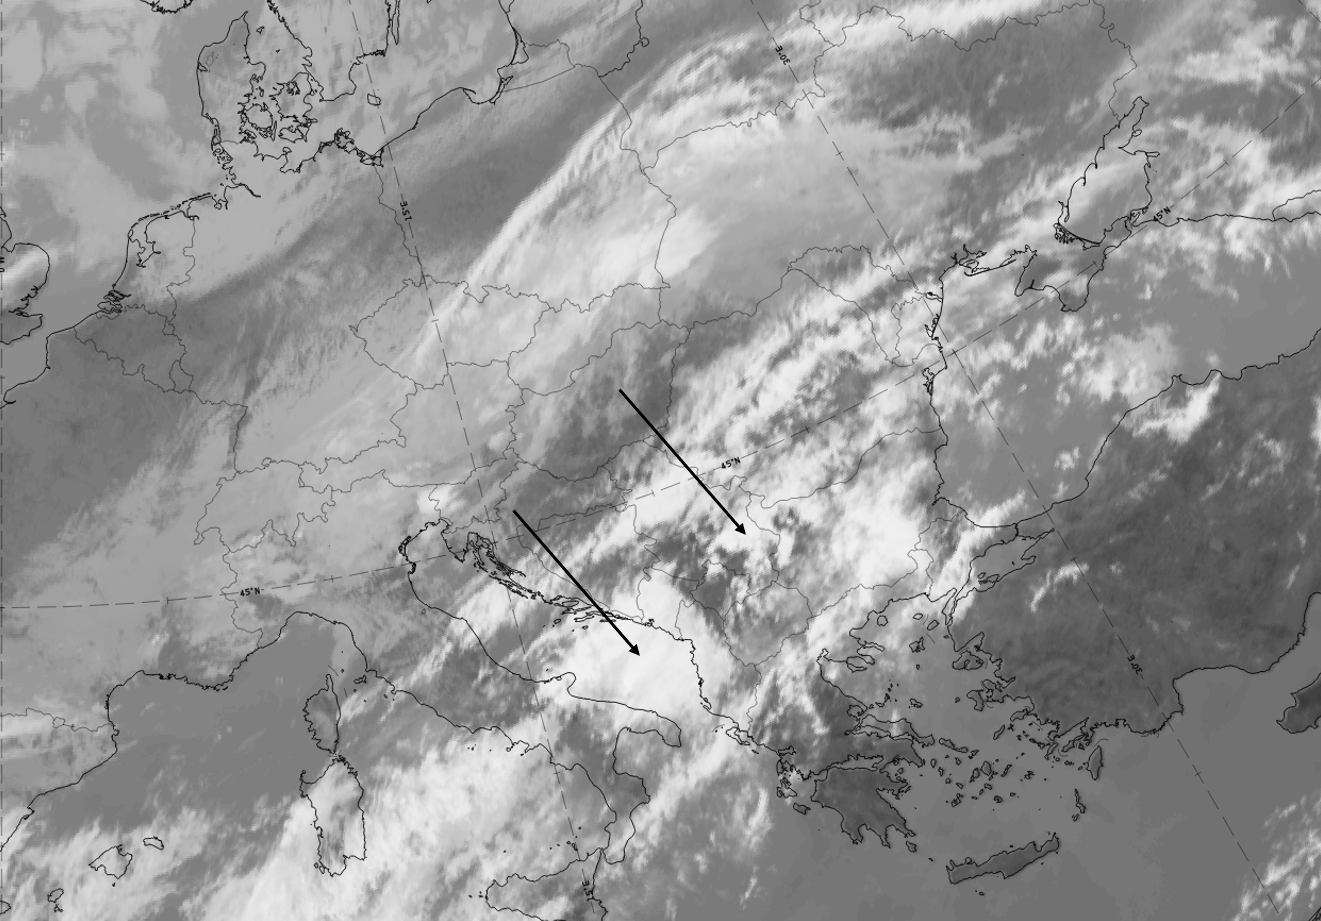
The example from 15 May 2020 at 12 UTC shows a typical example over the Mediterranean where cold front and WCB cloud bands are separated. Orography enhances the amount of cloud on the leeward side of the Apennine and the Dinaric Alps.
 |
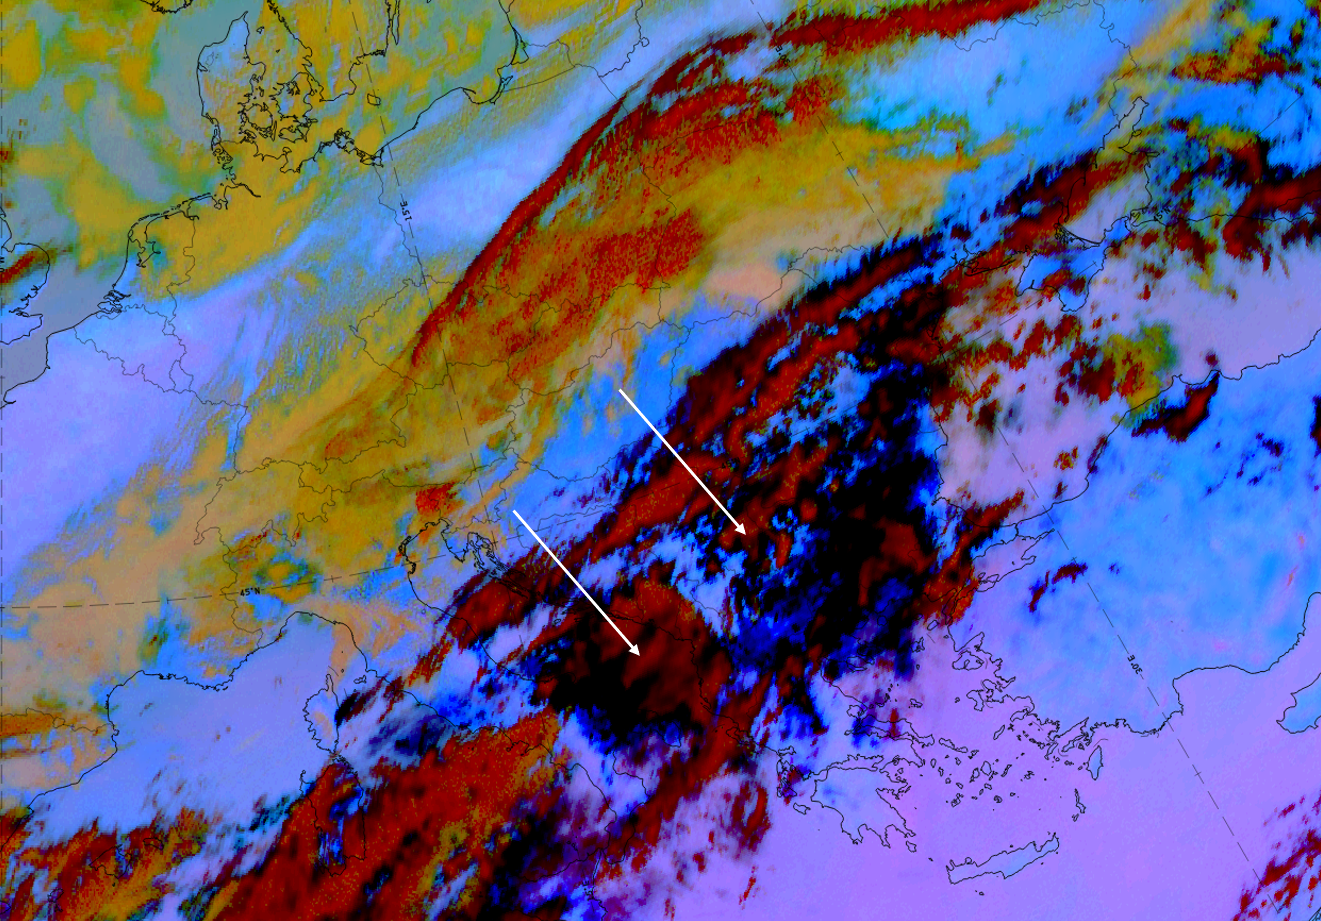 |
Legend: 15 May 2020 at 12 UTC: l: IR; r: dust RGB.