Table of Contents
Cloud Structure In Satellite Images
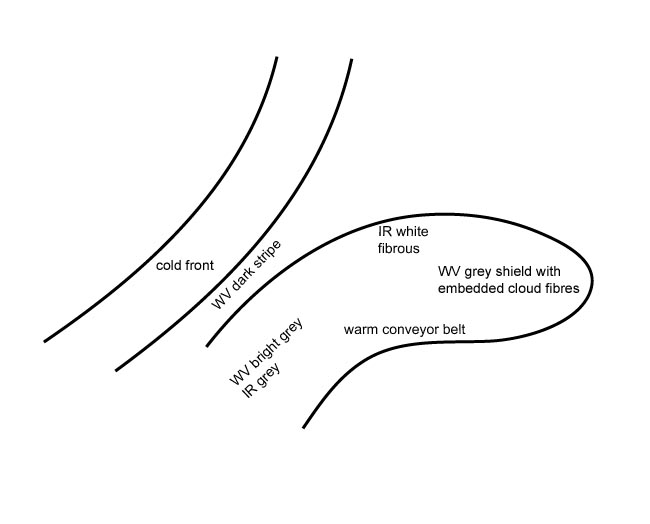
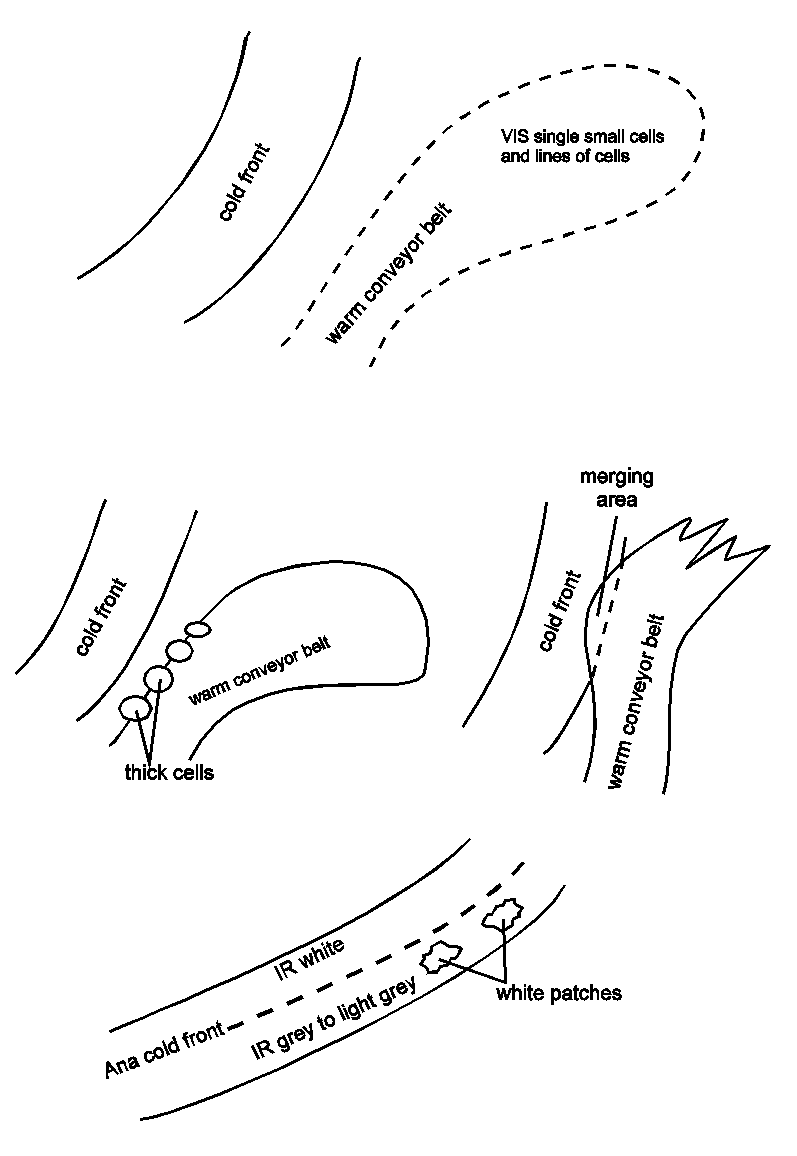
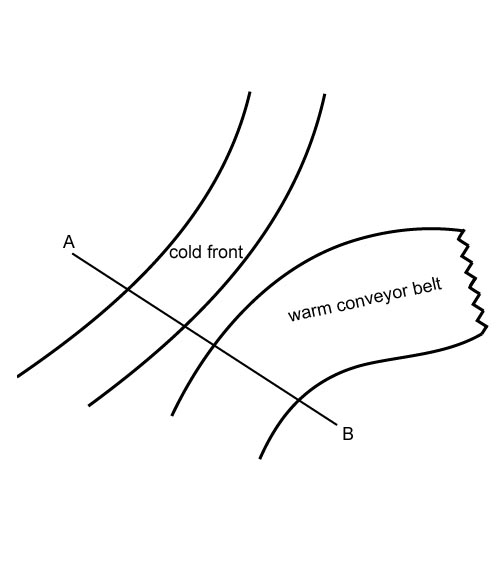
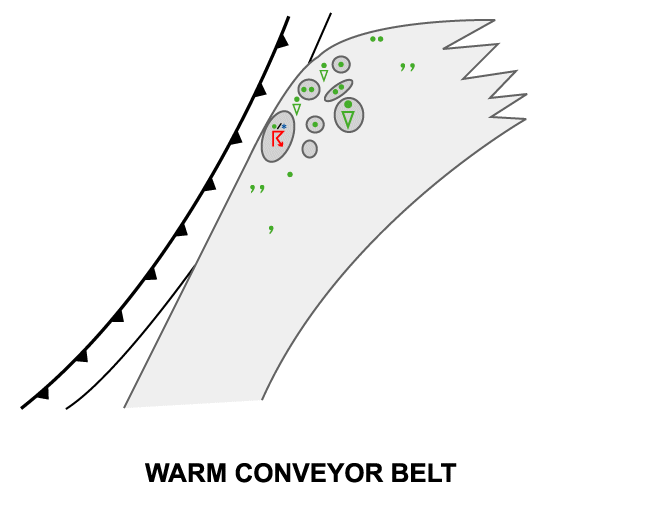
In the satellite image the Warm Conveyor Belt looks like an anticyclonically curved cloud band. The warm conveyor belt is usually in front of, but separated from, the cloud band of the Cold Front.
Appearance in the basic channels:
- In the IR and WV images the grey shades of the Warm Conveyor Belt cloud band vary from grey to white.
- The fibrous texture dominates here but there may be bigger areas of smooth high-level cirrus clouds.
- In the VIS image the cloud of the Warm Conveyor Belt is much weaker; if there is any appreciable cloud, it consists of only small single cells.
- As a consequence of the ascending Warm Conveyor Belt, the grey shades in the IR image become continuously brighter from south to north or north-east. From there on the brightness decreases again while it turns to south-east where it comes under the influence of sinking.
- During the life cycle some interactions between the Warm Conveyor Belt and the frontal cloud band can be observed:
- taller cells may develop at the rear edge which is oriented to the approaching Cold Front;
- the anticyclonic part of the Warm Conveyor Belt may merge with the frontal cloud of the Cold Front;
- sometimes the southern boundary of the Cold Front bands show embedded high cloud patches.
Appearance in the basic RGBs:
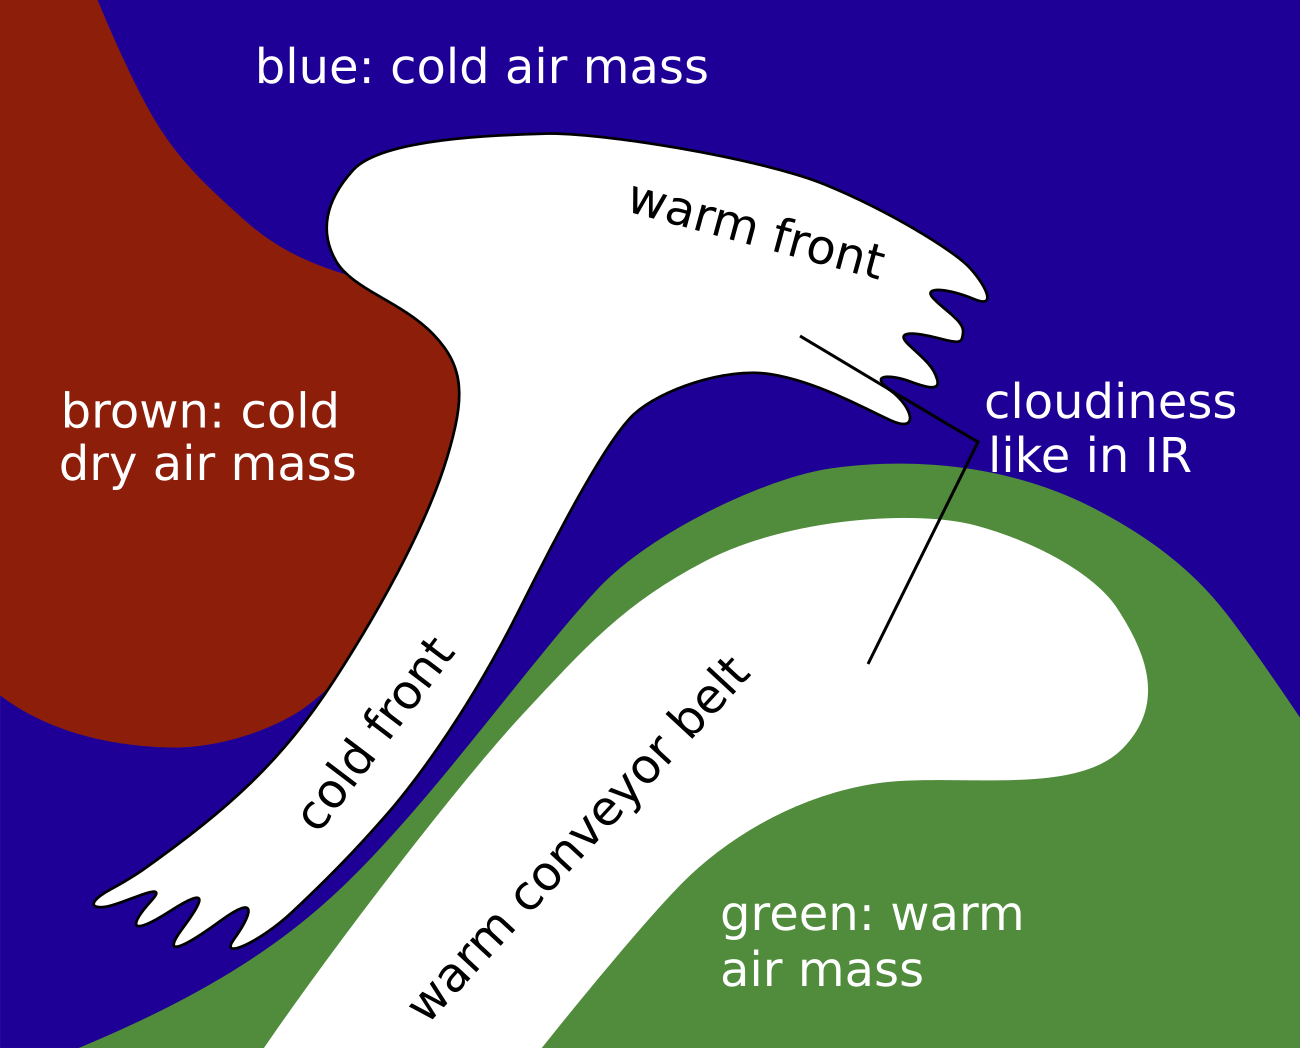
Airmass RGB
As the Warm Conveyor Belt cloudiness develops mostly in front of a CF cloud band, different air masses are discernible. Firstly, there is the cold and dry air mass behind the cold front. Also, greenish to blue colours prevail between the cold front and warm conveyor belt cloud, representing the protruding colder air from the west. Greenish colours exist in the south and southeast part of the warm conveyor belt cloud, representing the warm air masses in front of the system.
The cloud of a Warm Conveyor Belt is very similar to those seen in the IR image. Upper level processes - for instance the development of high lee cloudiness - are often superimposed, increasing the cloud fraction there. This process can very often be seen in the Mediterranean Sea, at Italy, and in the west of the Balkan Peninsula.
Dust RGB
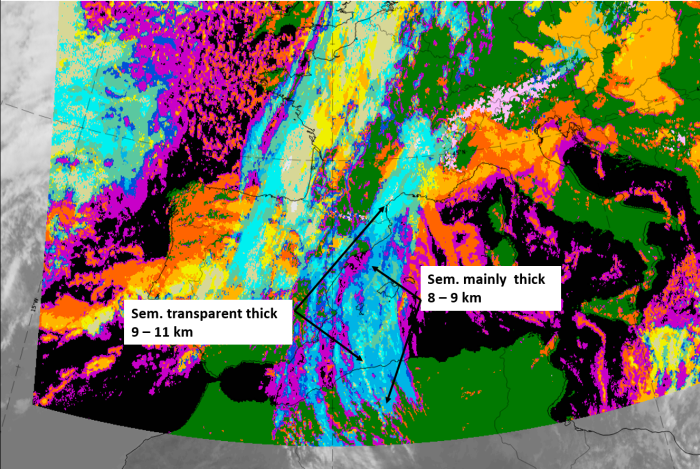
In the dust RGB there is a mixture of dark-red and black fibres or patches, depending on the thickness of the ice cloud.
 |
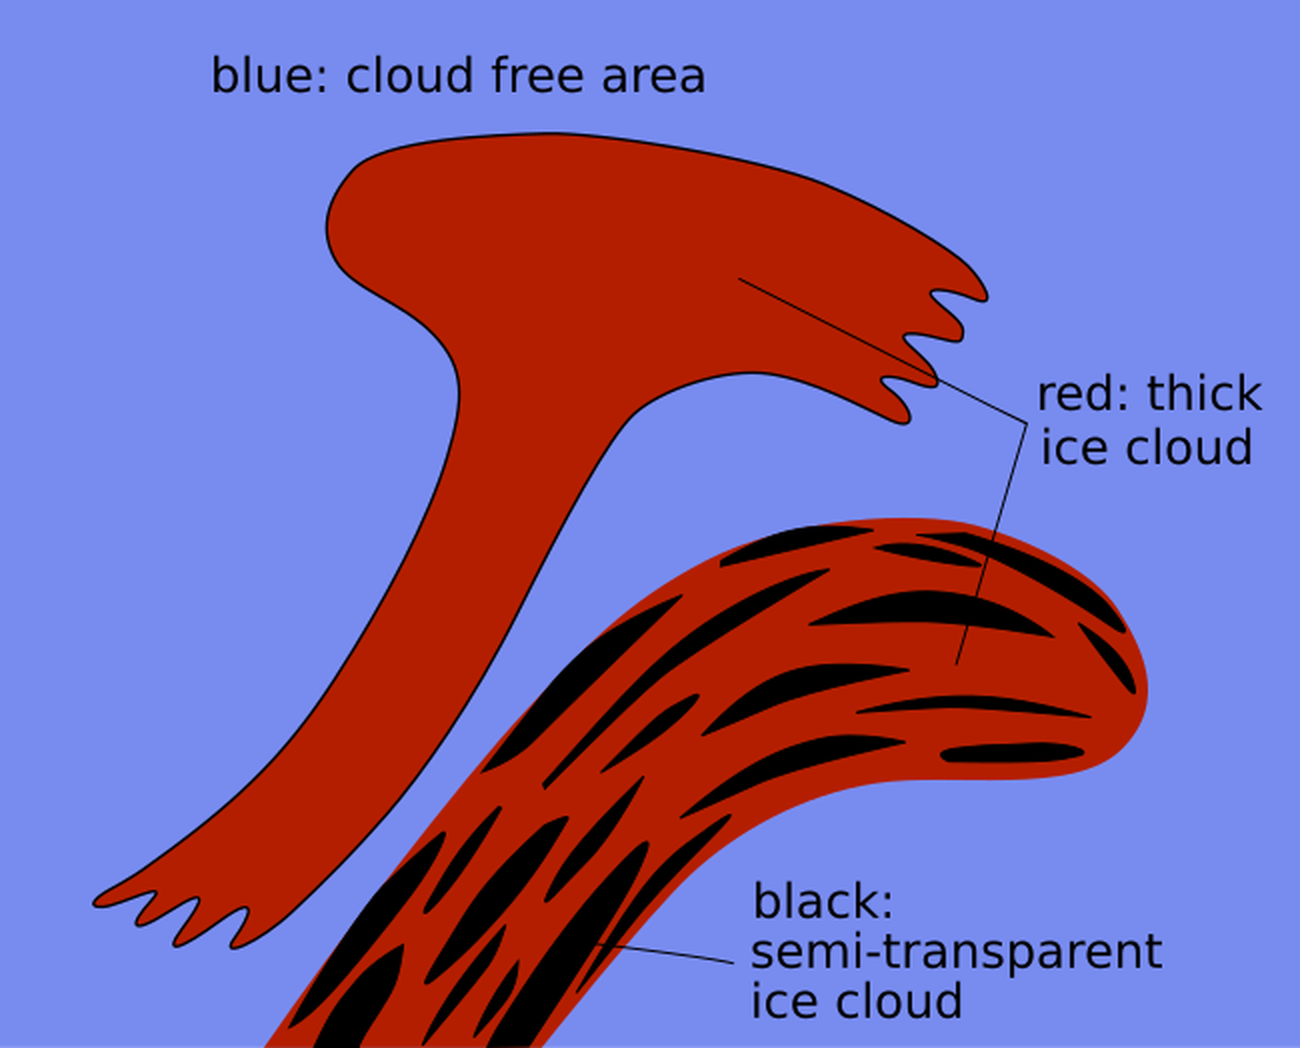 |
Legend: Schematics for basic RGBs, Left: Airmass RGB; right: Dust RGB.
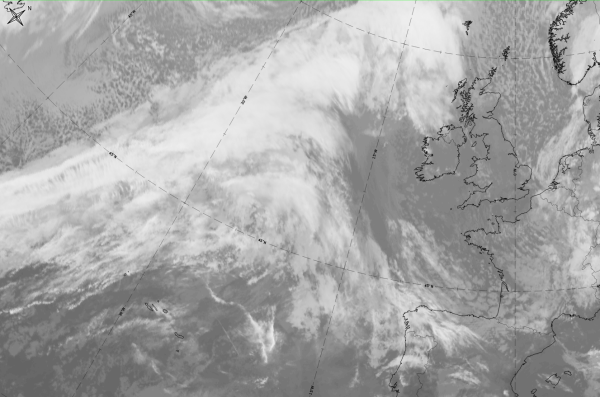
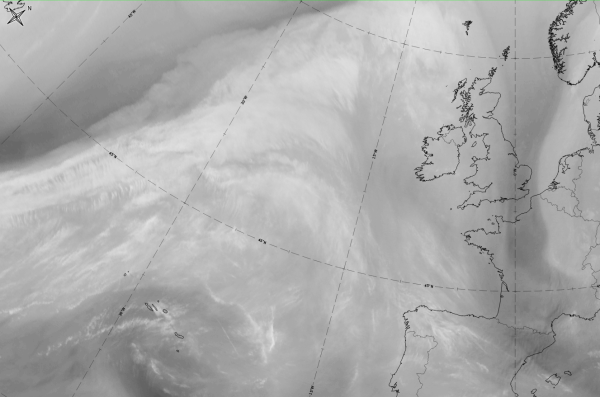
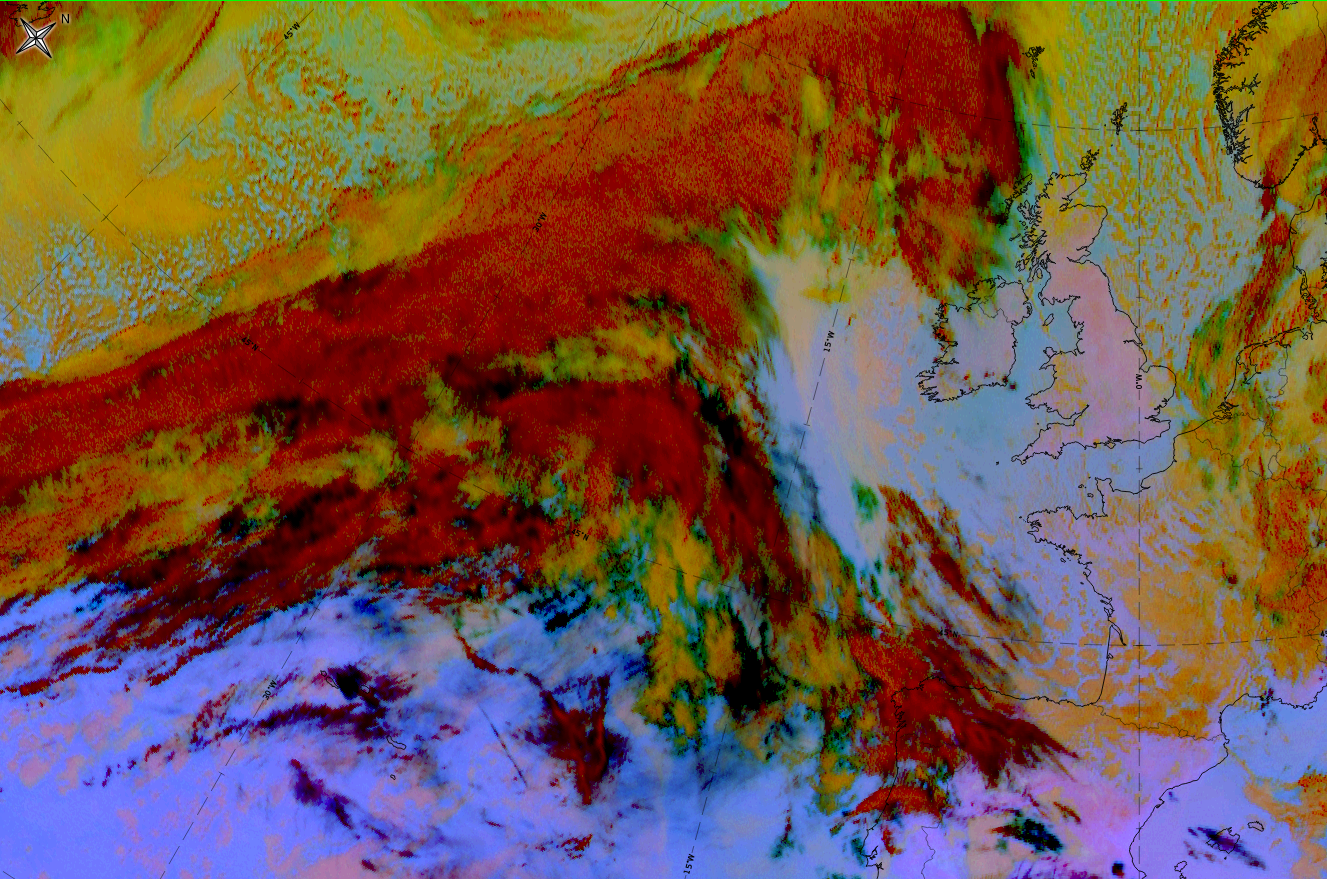
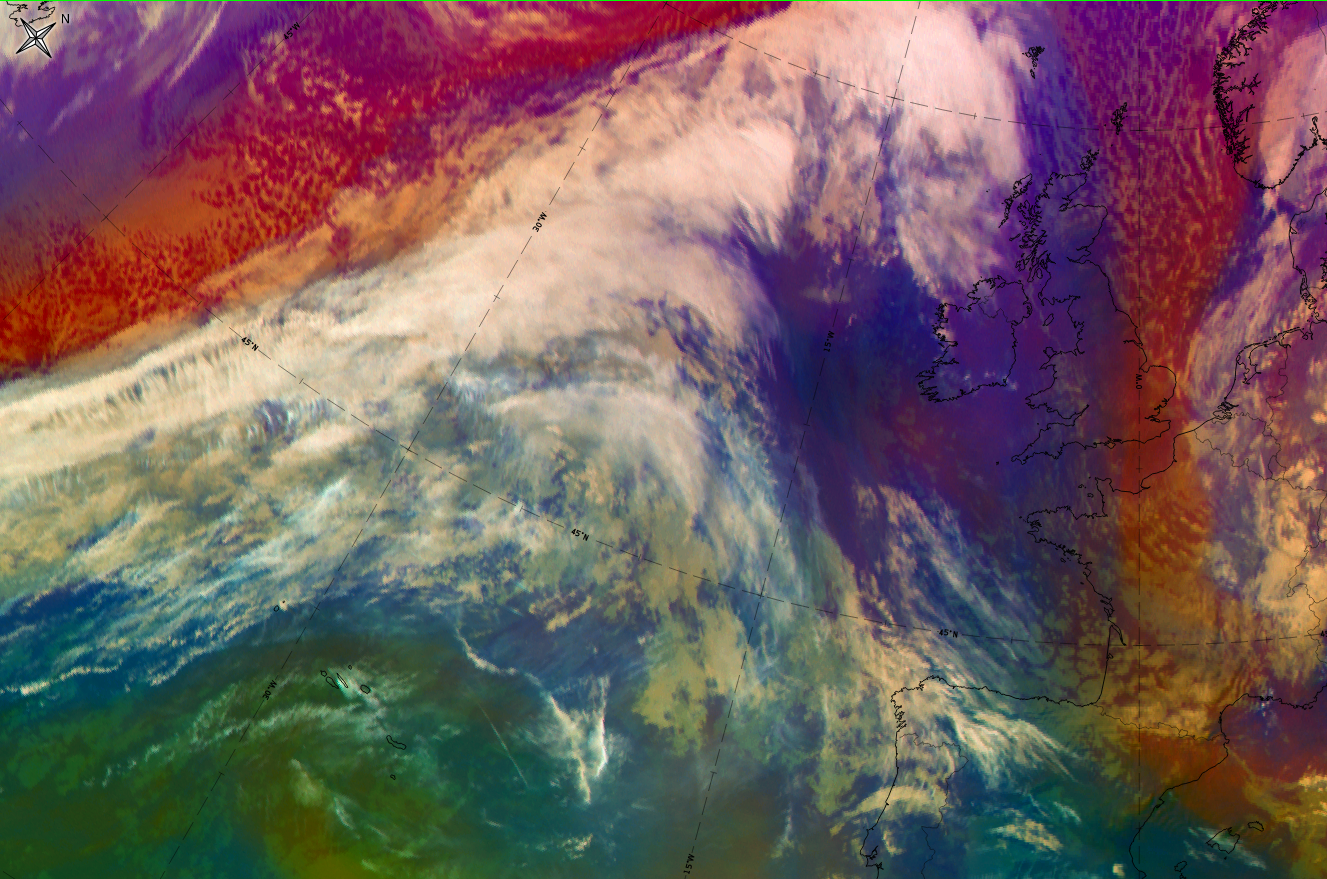
The example from 9 December 2019 at 12 UTC shows an example over the Atlantic where CF and WCB clouds are close together, almost merging.
|
|

|
|

9 December 2019 at 12UTC: 1st row: IR (above) + HRV (below); 2nd row: WV (above) + Airmass RGB (below); 3rd row: Dust RGB + image gallery.
*Note: click on the Dust RGB image to access image gallery (navigate using arrows on keyboard).
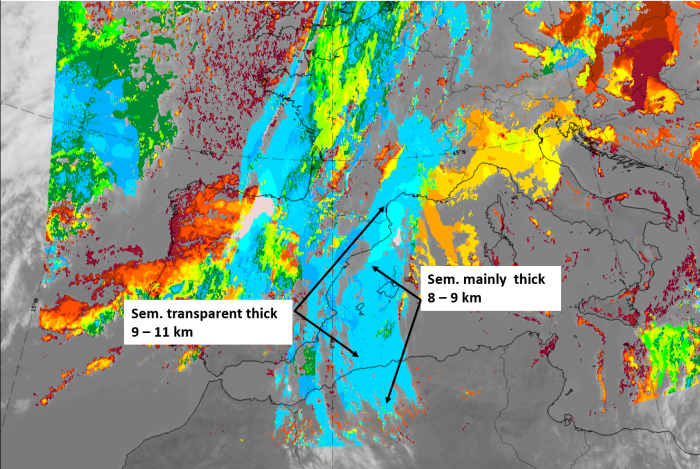
| IR | The anticyclonically curved cloud band appears fibrous with white to light grey colours. Brighter and larger patches exist in the north-eastern ascending part of the WCB. |
| HRV | Dark-grey (partly through illumination) and fibrous cloud; brighter and thicker in the north-eastern ascending part of the WCB. |
| WV | Light grey in an anticyclonically curved broad area, with white structures from fibres and thicker cloud patches. |
| Airmass RGB | Clouds similar to those in the IR, within blue below for cold airmass and green below in the southern and south-western part, representing the warm airmass from which the WCB starts rising. |
| Dust RGB | Black cloud fibres in the south west, becoming dark red in the north-eastern ascending part of the WCB. Ochre colours represent the mid-level cloud in the areas of broken cloud in the WCB, as well as between the cold front cloud band and the WCB. |
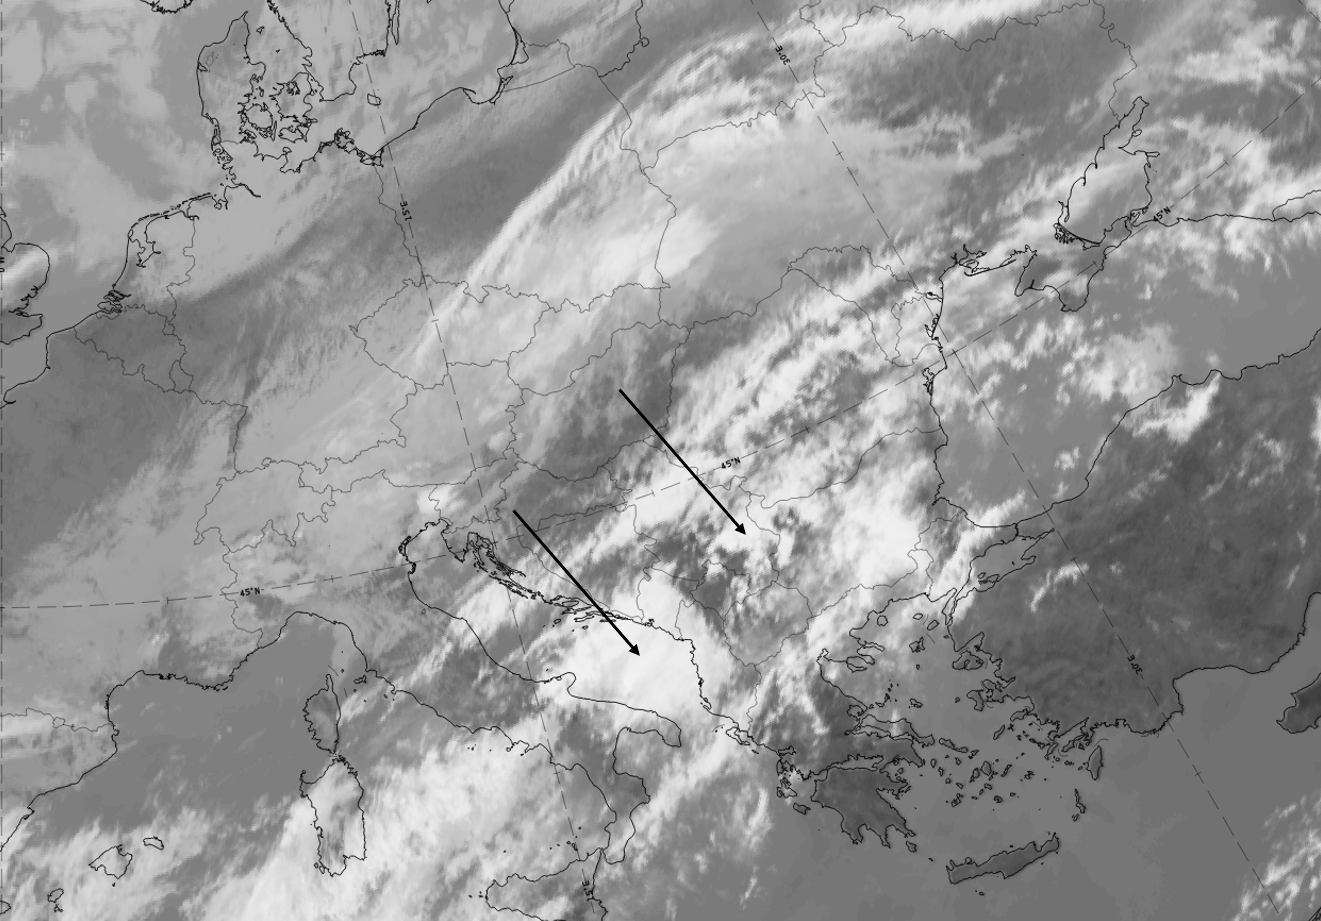
The example from 15 May 2020 at 12 UTC shows a typical example over the Mediterranean where cold front and WCB cloud bands are separated. Orography enhances the amount of cloud on the leeward side of the Apennine and the Dinaric Alps.
 |
 |
Legend: 15 May 2020 at 12 UTC: l: IR; r: dust RGB.
Meteorological Physical Background
A Warm Conveyor Belt is defined as a layer of air which:
- originates in a relative easterly to south-easterly flow within the lower levels of the troposphere in the ridge area ahead of the front;
- generally ascends pole ward (north to north-eastern direction) forming cloudiness due to the condensation of moist air;
- after turning to south-eastward directions ascending motion changes to descending motion, where cloud dissolution takes place.
As already mentioned Warm Conveyor Belts are directly involved in the frontal processes, but typical cloud configurations can also be observed
separately from the frontal cloudiness. Different states of the atmosphere are responsible for these two types:
- The cloudiness of a front is developed between two relative streams: the Warm Conveyor Belt and the dry intrusion from the trough area behind; the Warm Conveyor Belt is connected at least with the leading part of the cloudiness, therefore the relative stream lines approach or even overrun the surface front (or the TFP).
- In the case of separated Warm Conveyor Belt cloudiness the relative stream lines are in front of the frontal cloud band and relative streamlines from behind (probably the rising part of the dry intrusion) cross the frontal line in a forward direction, consequently approaching the stream lines of the Warm Conveyor Belt.
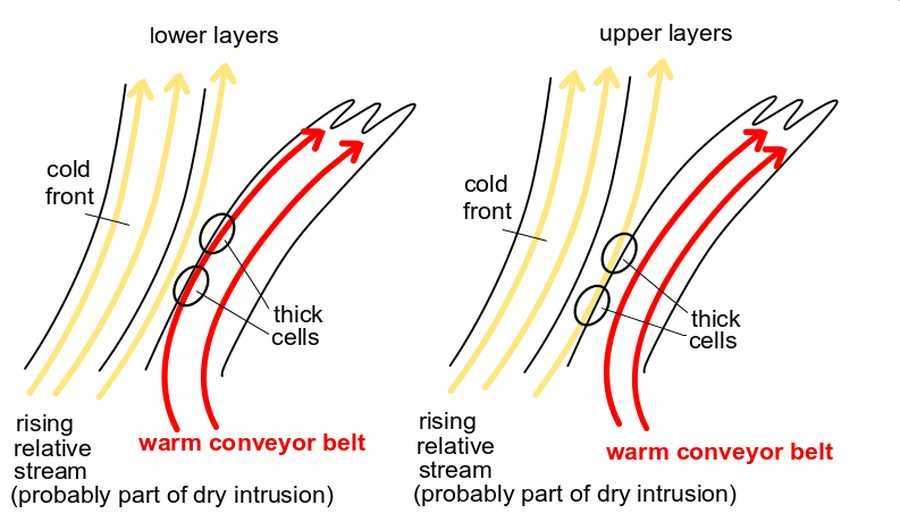
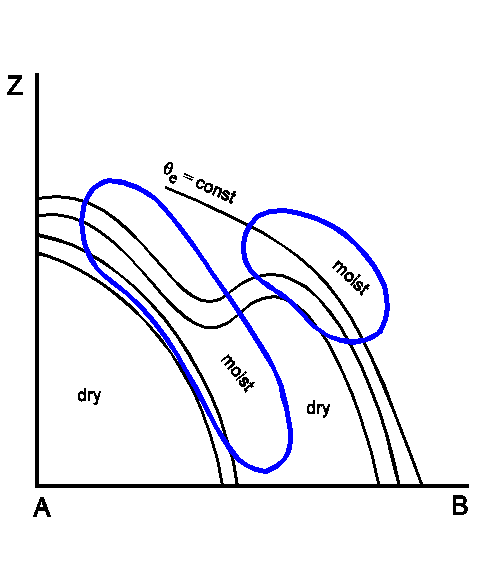
- These different situations show up in the vertical cross section of equivalent potential temperature in the case of a Warm Conveyor Belt being involved in the front. The upper troposphere in front of the Cold Front surface shows either an indistinct or a trough configuration of isentropes. In the case of a Warm Conveyor Belt being separated from the front, a second downward inclined crowding zone of isentropes can be observed in high and middle levels. The air in the Warm Conveyor Belt moves on these isentropic surfaces.
A survey by ZAMG has shown that over the past two years over 57% of the Warm Conveyor Belts that occurred happened over North-Africa and the Mediterranean and could be subscribed to the more isolated and separated type of Warm Conveyor Belt. Of the 467 cases examined less than 70 (15%) occurred over western, northern or eastern Europe and were mostly connected to a frontal system.
|
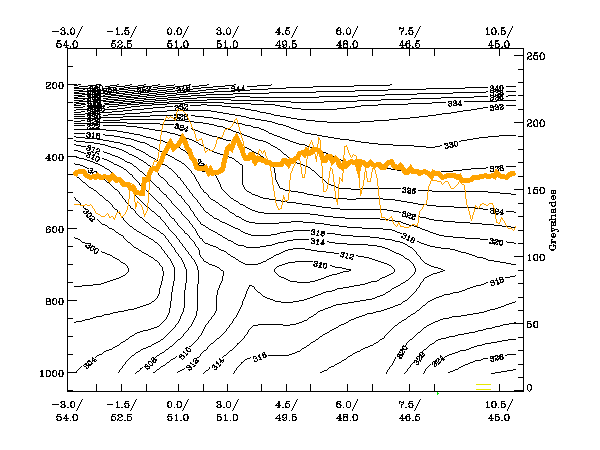
13 September 2004/12.00 UTC - Vertical cross section; black: isentropes (ThetaE), orange thin: IR pixel values, orange thick: WV
pixel values
|
|
|
The 320K isentrope belongs to the Cold Front, the 326K isentrope to the Warm Conveyor Belt cloudiness.
|
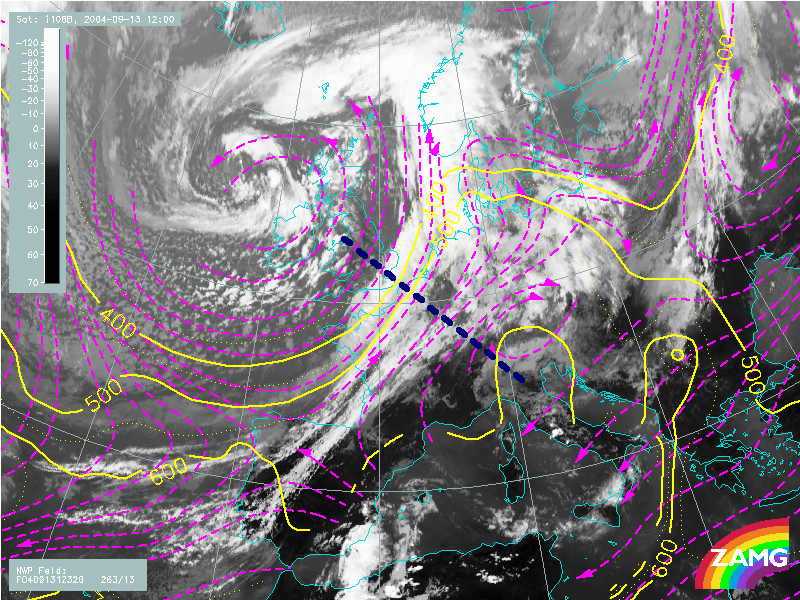
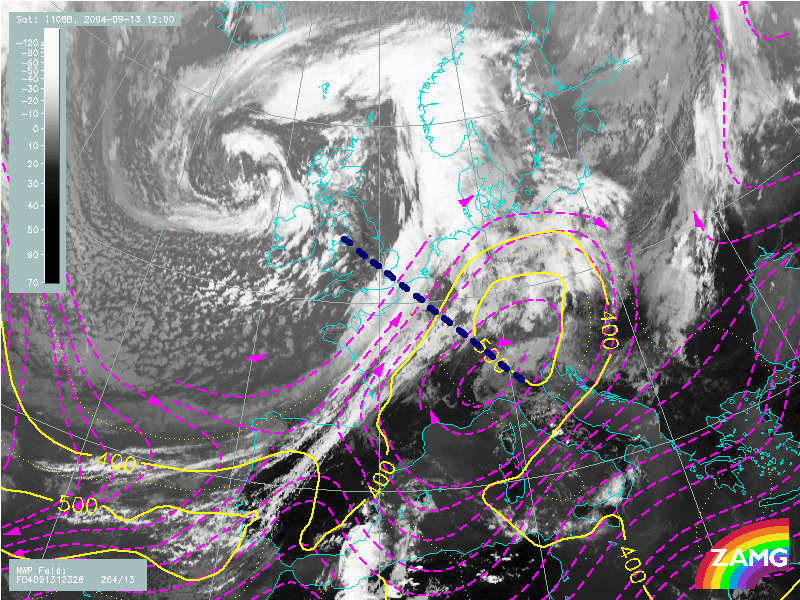
13 September 2004/12.00 UTC - Meteosat 8 IR 10.8 image; magenta: relative streams 320K - system velocity: 263° 13 m/s, yellow:
isobars 308K, position of vertical cross section indicated
|
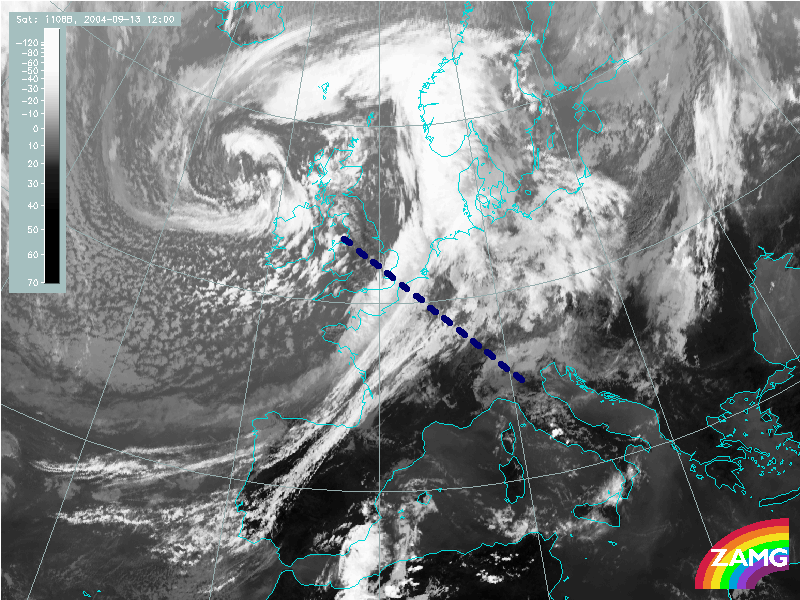
13 September 2004/12.00 UTC - Meteosat 8 IR 10.8 image; magenta: relative streams 326K - system velocity: 264° 13 m/s, yellow:
isobars 326K, position of vertical cross section indicated
|
|
|
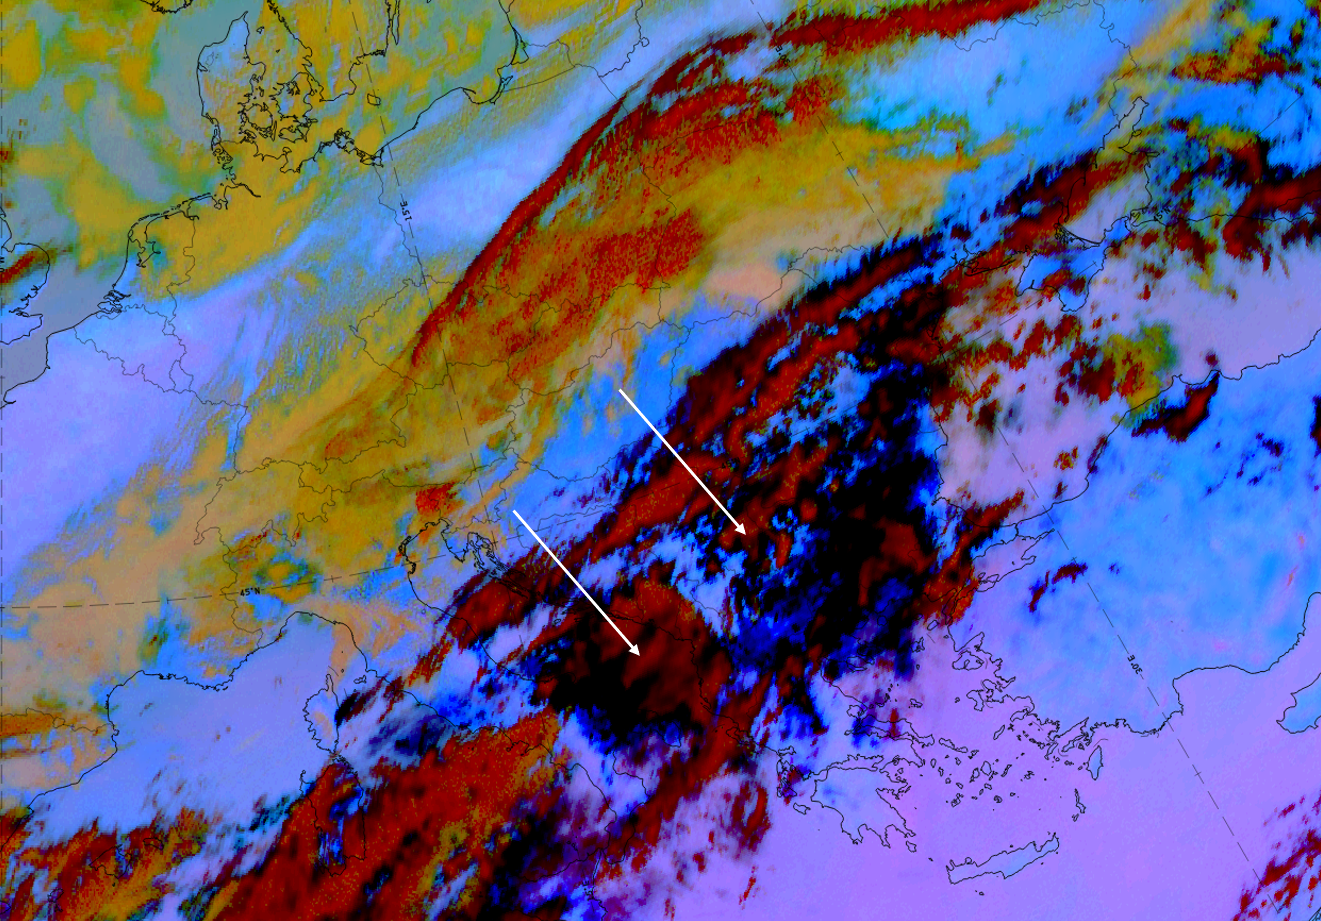
At the 320K isentropic surface, which is relevant for the cloud band of the Cold Front, the whole frontal cloudiness is under the influence of the upper relative stream from behind. The limiting stream line between this stream and the Warm Conveyor Belt can be found at the eastern edge of the cloudless area between Cold Front and Warm Conveyor Belt. The cloudiness with the embedded cells in front of this zone is already under the influence of the Warm Conveyor Belt.
At the 326K surface the Warm Conveyor Belt, which has an ascending poleward direction, forms the cloudiness Warm Conveyor Belt. Above the Atlantic (at approximately 43N/10W) the conveyor belt splits into two branches. The southern branch turns from a north-eastward direction to a south-eastward one and forms the cloudiness which extends to the west coast of Portugal. The northern branch turns from a eastward to a north-eastward direction forming the cloudiness above the Gulf of Biscay and France towards Germany. The limiting stream line between the relative stream from behind the front and the Warm Conveyor Belt can be found above the convective cells. Therefore the cells are under the influence of the warm moist air mass of the Warm Conveyor Belt in lower layers, but in the colder drier air of the upper relative stream in higher layers. This is a typical situation for instability and convective development.
- At the rear boundary of the Warm Conveyor Belt close to the Cold Front cloud band, sometimes convective cells develop. This is the area where in lower levels the moist air of the Warm Conveyor Belt streams northward, while in higher levels the air in the drier relative stream from behind the front crosses over. This is a typical unstable layer of the troposphere leading, in combination with upward motion, to convective developments (compare the example before).
Key Parameters
The parameters most relevant for a Warm Conveyor Belt are parameters on isentropic surfaces - like relative streams - (see Meteorological physical background ) and not so much parameters on isobaric surfaces.
Typical Appearance In Vertical Cross Sections
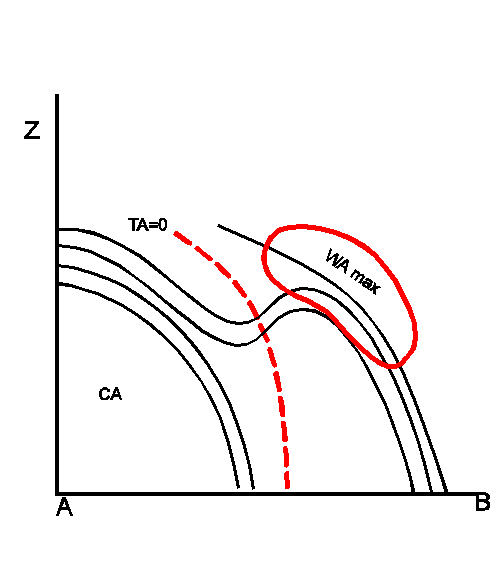
In front of the inclined crowding zone of a Cold Front system a second upper level Cold Front - like inclined crowding zone exists. In some cases this crowding zone can also extend into the lower levels. Further it often can be observed that the crowding zones of the upper level Cold Front and the crowding zone of the Warm Conveyor Belt are separated by a small trough of the isolines of equivalent potential temperature.
The relative humidity shows in the area of the Warm Conveyor Belt high values of about 70% and higher.
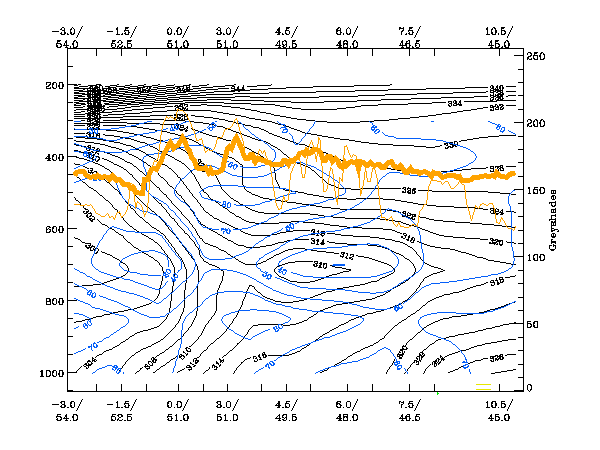
The distribution of the temperature advection shows a maximum of warm advection within the Warm Conveyor Belt in the mid- and upper levels of the troposphere.
In the satellite image the Warm Conveyor Belt is characterized by high pixel values in the IR as well as in the WV image which indicates mid- and upper level cloudiness. Sometimes it is only possible with help of the vertical cross sections to distinguish between the high pixel values of the frontal system and those of the Warm Conveyor Belt in front of it.
|
|
13 September 2004/12.00 UTC Meteosat 8 IR 10.8 image, Vertical cross section indicated
|
|
|
|
|
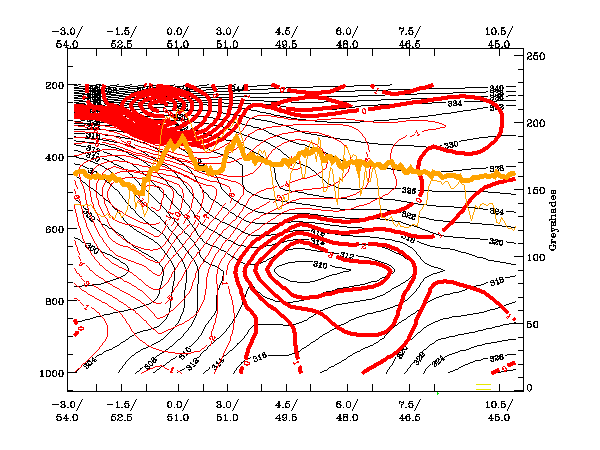
13 September 2004/12.00 UTC - Vertical cross section; black: isentropes (ThetaE), blue: relative humidity, orange thin: IR pixel values, orange thick: WV pixel values
|
|
|
|
|
13 September 2004/12.00 UTC - Vertical cross section; black: isentropes (ThetaE), red thick: temperature advection - WA, red thin:
temperature advection - CA, orange thin: IR pixel values, orange thick: WV pixel values
|
|
|
Weather Events
Usually the Warm Conveyor Belt clouds consists of only mid- and high-level clouds with very weak or no precipitation.
| Parameter | Description |
| Precipitation |
|
| Temperature |
|
| Wind (incl. gusts) |
|
| Other relevant information |
|
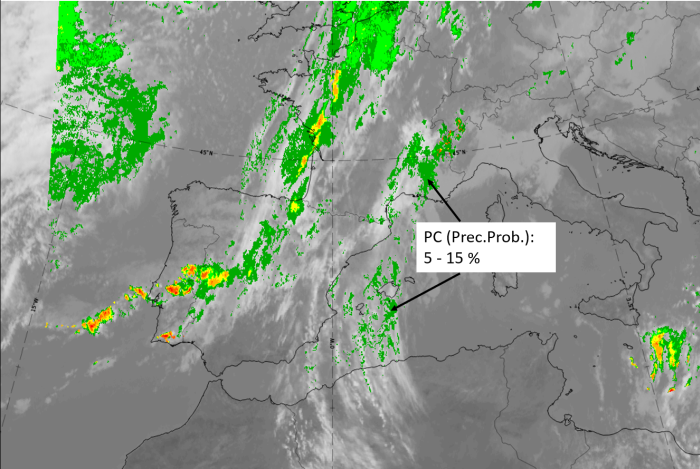
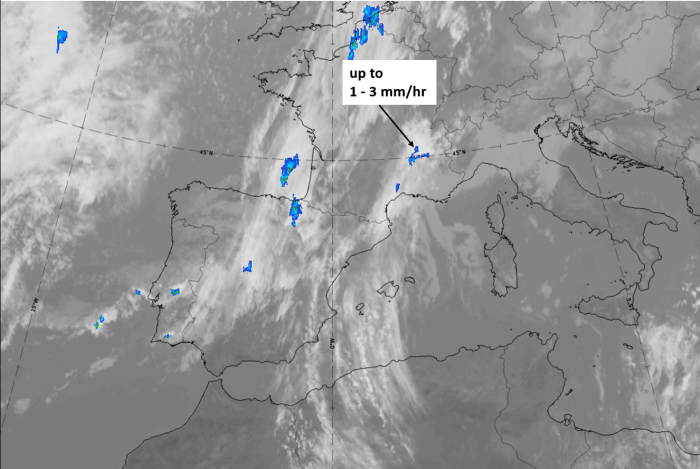
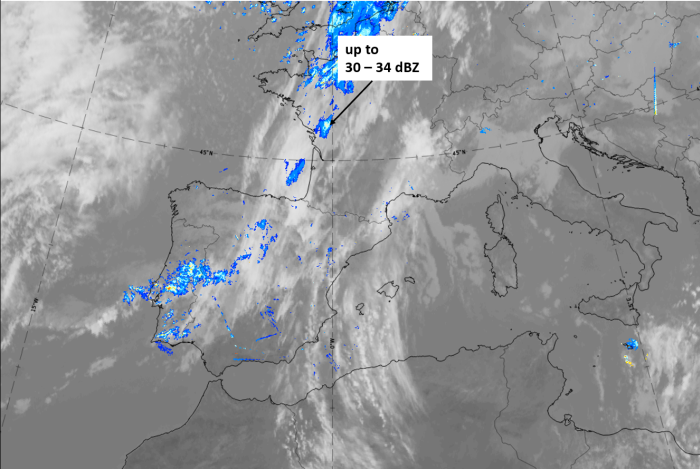
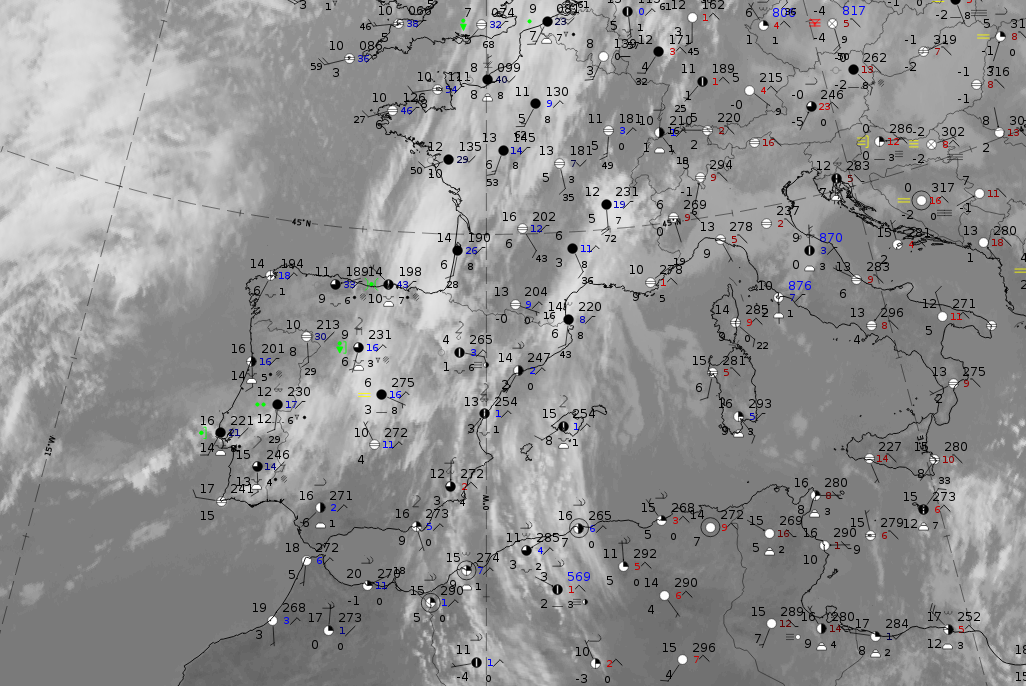
As an example, for the typical weather in a warm conveyor belt, the case of 15 January 2020 at 12 UTC is chosen. It shows a cold front cloud band from the Iberian Peninsula stretching northward into the North Sea. In front of it the clouds of a warm conveyor belt from Northern Africa across the Western Mediterranean into Southern France exist. As it is an example of a winter case, no thunderstorm reports are expected.
|
|
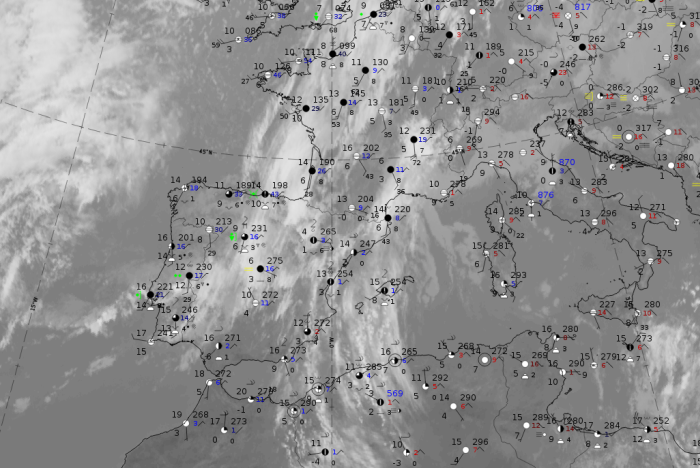
Legend: 15 January 2020 at 12UTC: IR + synoptic measurements (above) + probability of moderate rain (Precipitting clouds PC - NWCSAF).
Note: for a larger SYNOP image click this link.
There are no precipitation reports within the warm conveyor belt cloudiness; it is mostly high cloud. Only in the northern part, which is over France, there are also mid-level clouds. Also, the precipitation probability computed from the NWCSAF is lower than 15 %.
|
|
|
|
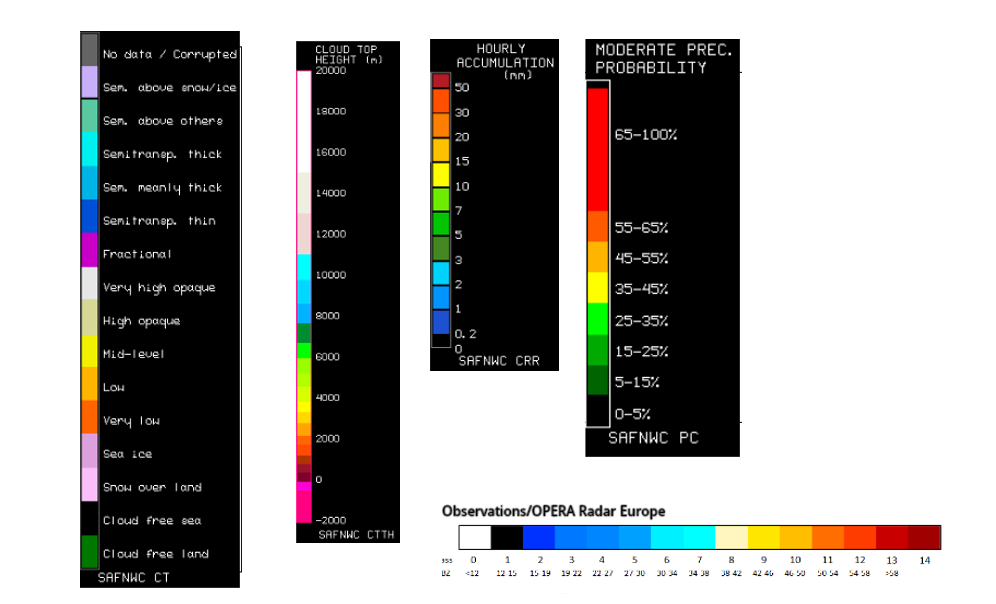
Legend:
15 January 2020 at 12 UTC, IR; superimposed:
1st row: Cloud Type (CT NWCSAF) (above) + Cloud Top Height (CTTH - NWCSAF) (below); 2nd row: Convective Rainfall Rate (CRR NWCSAF) (above) + Radar intensities from Opera radar system (below).
For identifying values for Cloud type (CT), Cloud type height (CTTH), precipitating clouds (PC), and Opera radar for any pixel in the images look into the legends. (link).
References
General Meteorology and Basics
- BROWNING K. A. (1985): Conceptual models of precipitation systems; Quart. J. R. Meteor. Soc., Vol. 114, p. 293 - 319
- BROWNING K. A. (1986): Conceptual models of precipitation systems; Weather&Forecasting, Vol. 1, p. 23 - 41
- CARLSON T. N. (1987): Cloud configuration in relation to relative isentropic motion; in: Satellite and radar imagery interpretation, preprints for a workshop on satellite and radar imagery interpretation - Meteorological Office College, Shinfield Park, Reading, Berkshire, England, 20 - 24 July 1987, p. 43 - 61
- CONWAY B. J., GERARD L., LABROUSSE J., LILJAS E., SENESI S., SUNDE J. and ZWATZ-MEISE V. (1996): COST78 Meteorology - Nowcasting, a survey of current knowledge, techniques and practice - Phase 1 report; Office for official publications of the European Communities
- GREEN J. S. A., LUDLAM F. H. and MCILVEEN J. F. R. (1966): Isentropic relative-flow analysis and the parcel theory; Quart. J. R. Meteor. Soc., Vol. 92, p. 210 - 219
General Satellite Meteorology
- BADER M. J., FORBES G. S., GRANT J. R., LILLEY R. B. E. and WATERS A. J. (1995): Images in weather forecasting - A practical guide for interpreting satellite and radar imagery; Cambridge University Press
Specific Satellite Meteorology
- BROWNING K. A. and HARROLD T. N. (1970): Air motion and precipitation growth at a cold front; Quart. J. R. Meteor. Soc., Vol. 96, p. 369 - 389
- BROWNING K. A. and PARDOE C. W. (1973): Structure of low level jet streams ahead of mid-latitude cold fronts; Quart. J. R. Meteor. Soc., Vol. 99, p. 619 - 638
- BROWNING K. A. and MONK G. A. (1982): A simple model for the synoptic analysis of cold fronts; Quart. J. R. Meteor. Soc., Vol. 108, p. 435 - 452
- CARLSON T. N. (1980): Airflow through mid-latitude cyclones and the comma cloud pattern; Mon. Wea. Rev., Vol. 108, p. 1498 - 1509
- ZWATZ-MEISE V. (1990): Satellite synoptic of warm fronts; Proceedings of 8th Meteosat Scientific Users' meeting, Norrk?ping, Sweden, 28 - 31 August 1990, p. 151 - 160