Typical Appearance In Vertical Cross Sections
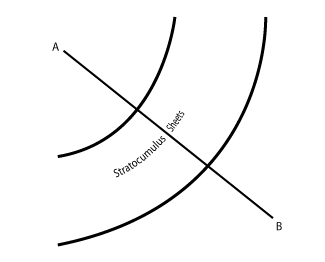
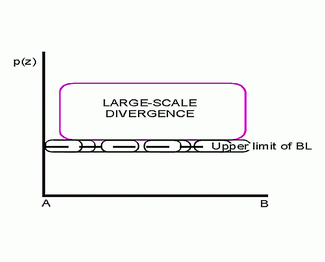
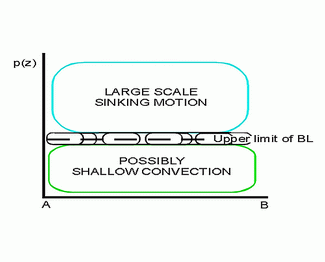
The dynamics of Sc Sheets differ almost totally from the other conceptual models described in this manual. The absence of traditional aspects, such as PVA, has an appreciable effect on the use of cross sections. Large-scale subsidence and low-level divergence have a destructive effect on baroclinity, at least above the boundary layer. Most of the dynamical processes take place in the lowest 1 - 2 kilometres, the processes themselves being largely radiative or turbulent on the small scale rather than baroclinic on the synoptic scale.
|
|
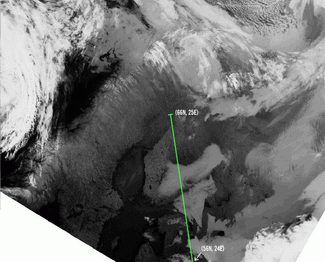
13 May 1998/02.40 UTC - Meteosat IR image; position of vertical cross section indicated
|
|
|
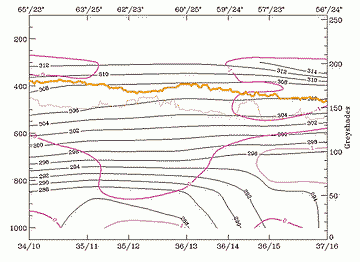
13 May 1998/00.00 UTC - Vertical cross section; black: isentropes (ThetaE), magenta thin: divergence, magenta thick: divergence,
orange thin: IR pixel values, orange thick: WV pixel values
|
|
|
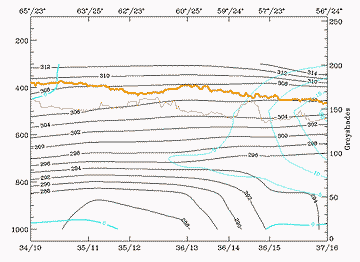
13 May 1998/00.00 UTC - vertical cross section; black: isentropes (ThetaE), cyan thick: vertical motion (omega) - upward motion,
cyan thin: vertical motion (omega) - downward motion, orange thin: IR pixel values, orange thick: WV pixel values
|
|
|
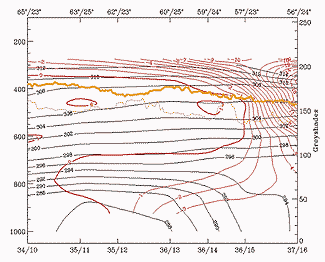
13 May 1998/00.00 UTC - Vertical cross section; black: isentropes (ThetaE), red thick: temperature advection - WA, red thin:
temperature advection - CA, orange thin: IR pixel values, orange thick: WV pixel values
|
The cross sections illustrate the same Nordic Sc Sheet example that was discussed in the chapter on cloud structure in satellite image (see Cloud structure in satellite image ). The cross section covers northern Finland to Latvia, roughly across the area where Sc Sheets were visible in the satellite image.
The divergence field gives very little information, divergence values over the area being negligible.
Almost the same applies to the omega field, even though there are weak positive values over the stratocumulus area, maybe indicating subsidence.
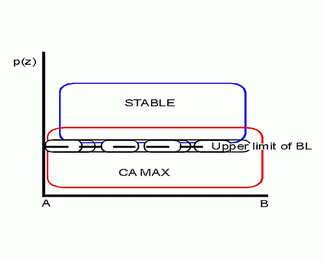
Temperature advection shows more clearly signs for cold advection in low layers (below 700 hPa) with maximum cold advection within the boundary layer. Shallow cold advection results in temperature sounding presented earlier (see Cloud structure in satellite image ).
