Weather Events
| Parameter | Description |
| Precipitation |
|
| Temperature |
|
| Wind (incl. gusts) |
|
| Other relevant information |
|
As just described, rapid cyclogenesis events are often connected with severe or even catastrophic weather events. As the development usually starts over the Atlantic, the severe weather is observed when it has already reached the “advanced” and “mature” development stages.
To show a few of the weather events, the case from 1-2 October 2020 is chosen.
 |
 |
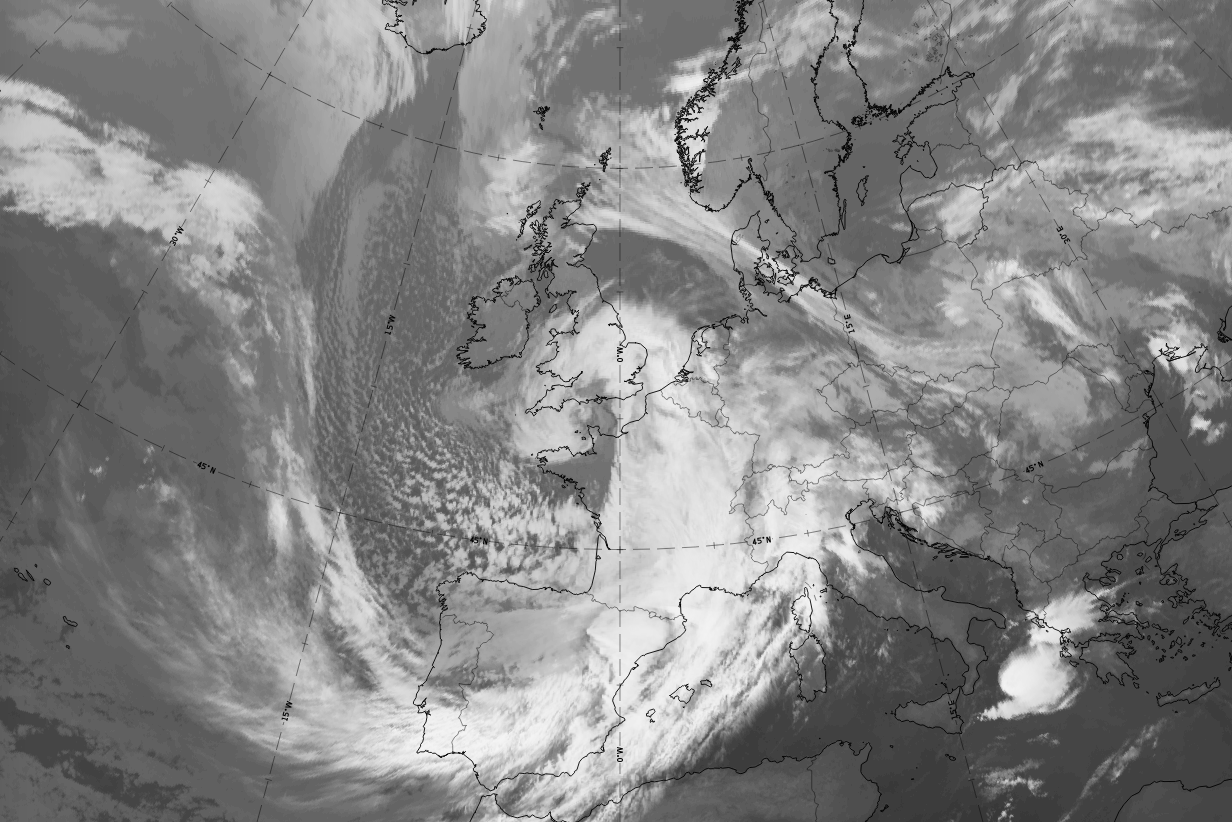 |
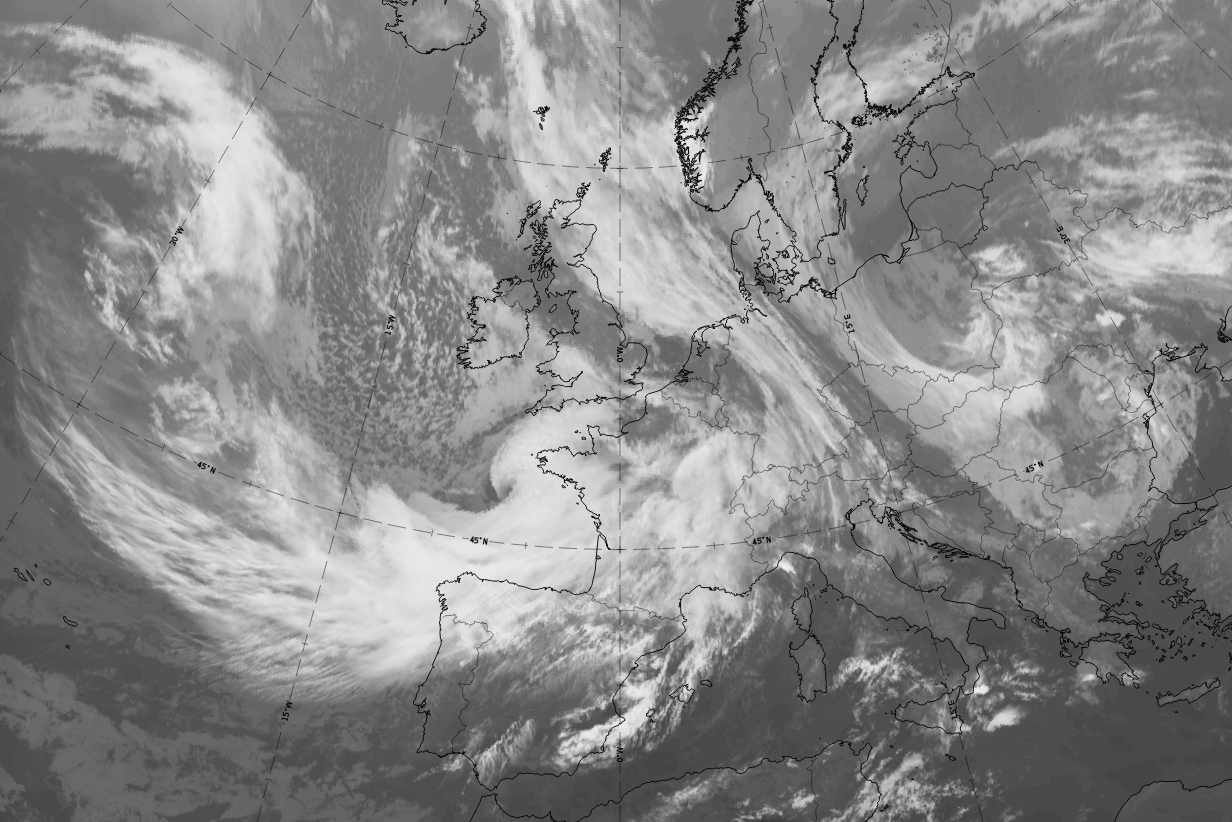
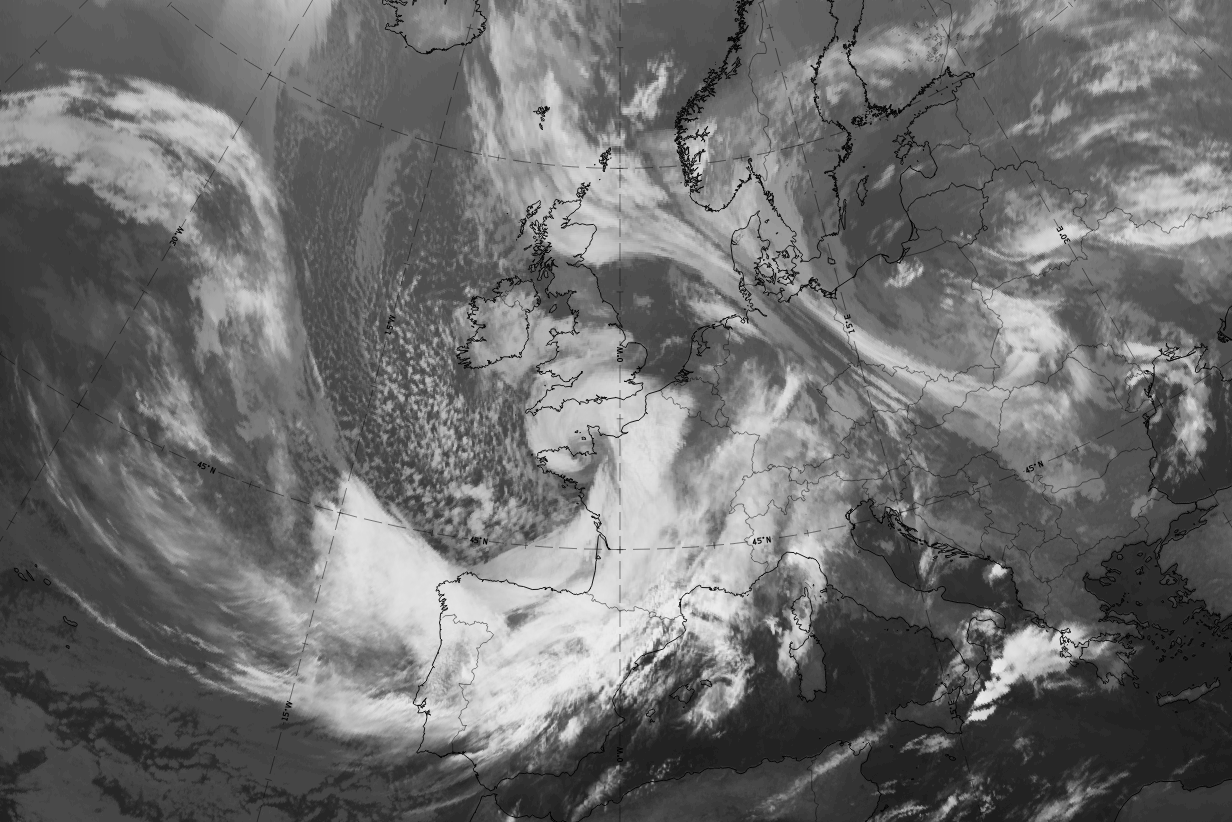
Legend: 1-2 October 2020; IR images
Left: 1 October 18 UTC, development phase; central: 2 October 00 UTC, advanced phase; right: 2 October 06 UTC, mature phase.
*Note: click on the image to access the image gallery (navigate using arrows on keyboard)
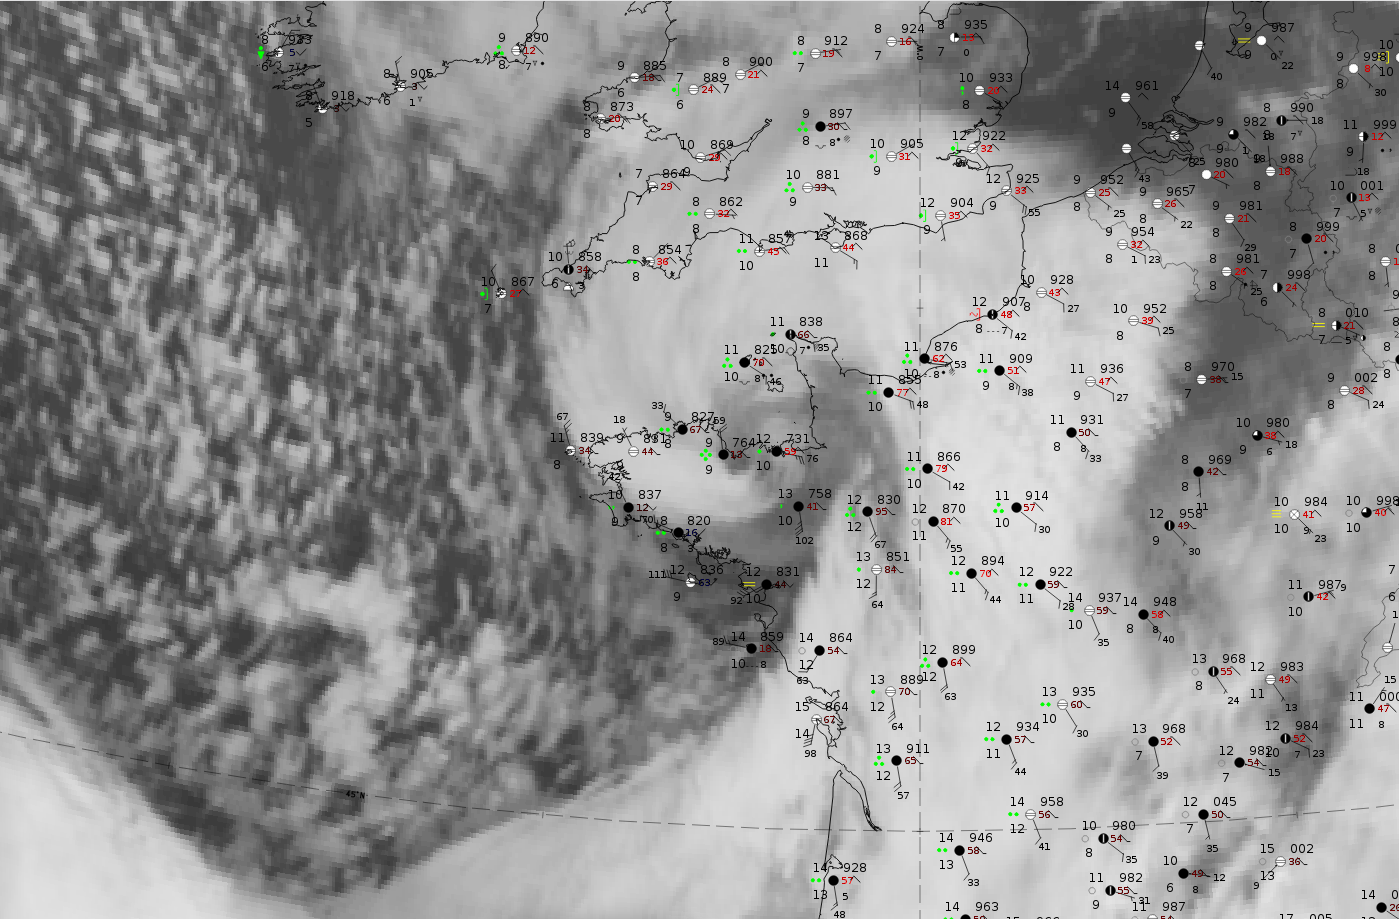
Development phase: 1 October 2020, 18 UTC
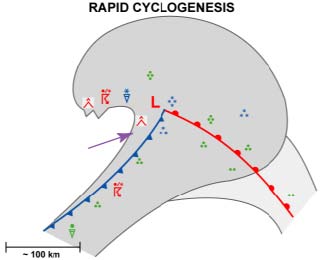
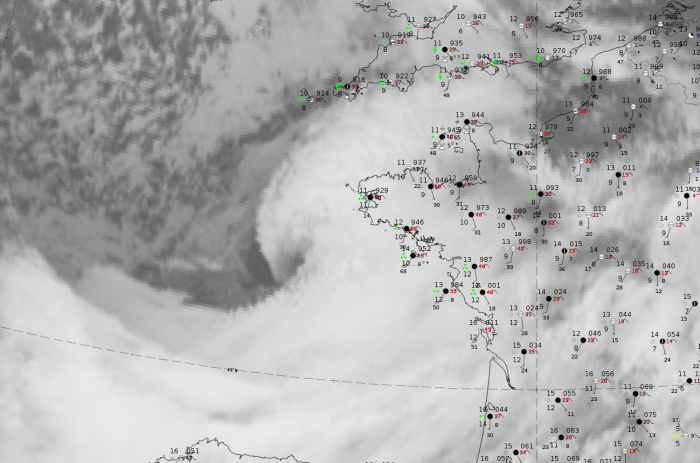
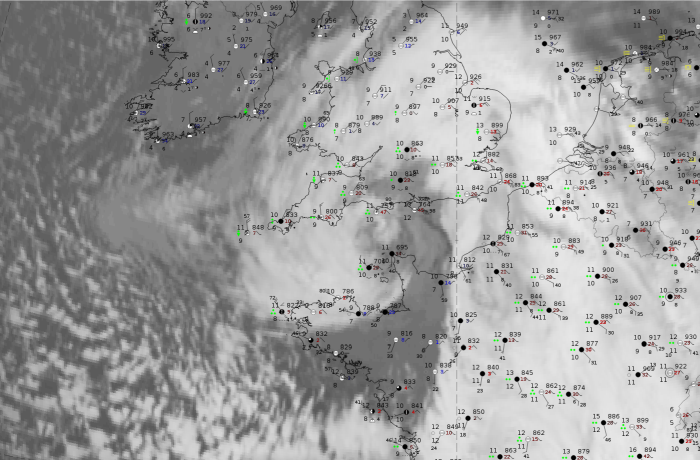
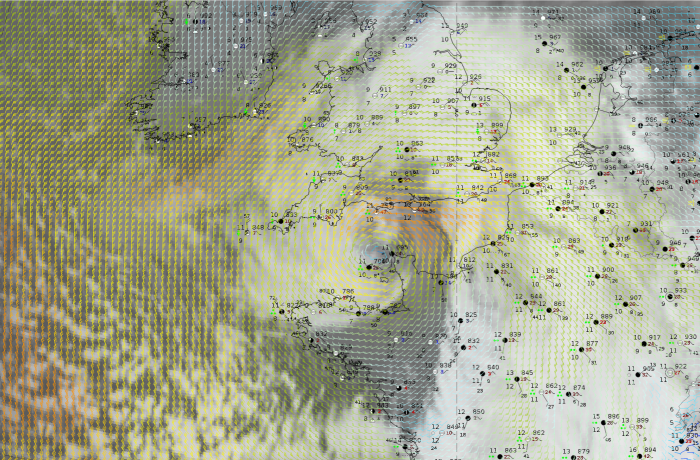
Fig. 32: Weather events at the ground level
|
|
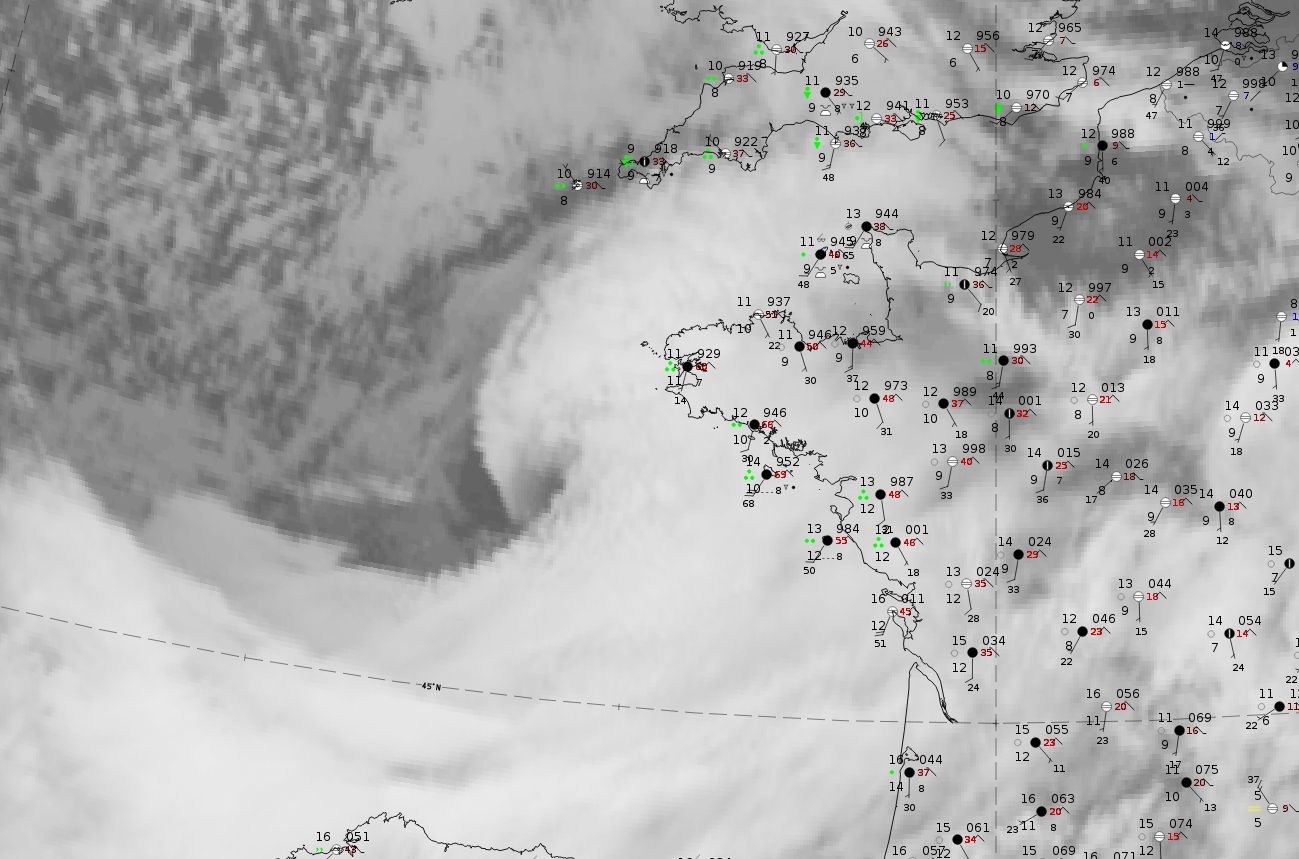
Legend:
1 October 2020, 18UTC: IR + synoptic measurements (above) + probability of moderate rain (Precipitting clouds PC - NWCSAF).
Note: for a larger SYNOP image click this link.
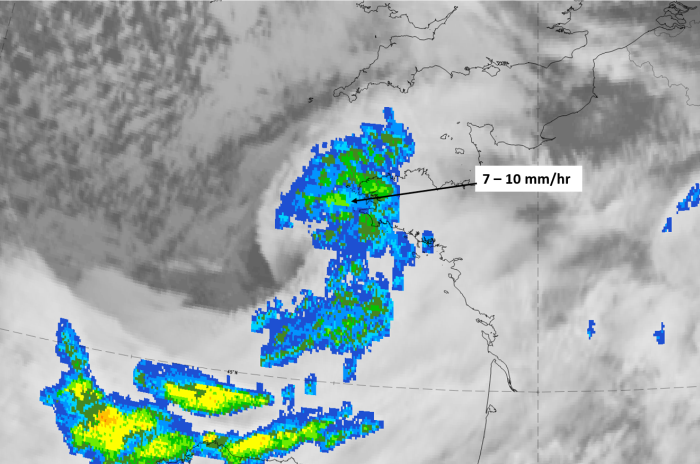
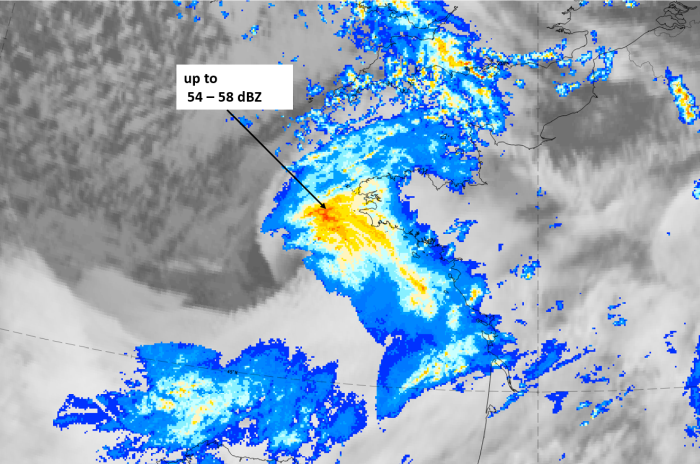
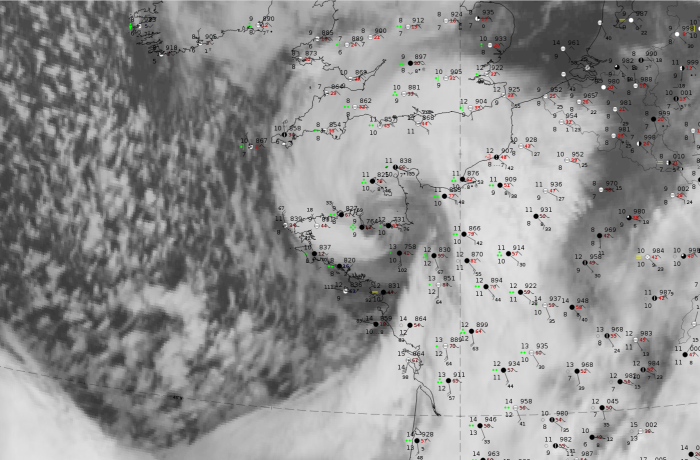
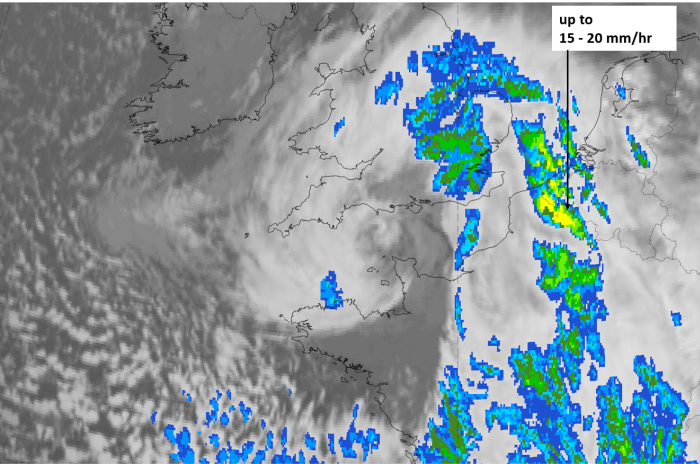
The development phase can be seen due to the visible dry slot southwest of Brittany and intensive precipitation events over the land to the east of the development area. The strongest surface winds appear to the south of the development area with speed values up to 55 knots.
|
|
|
|
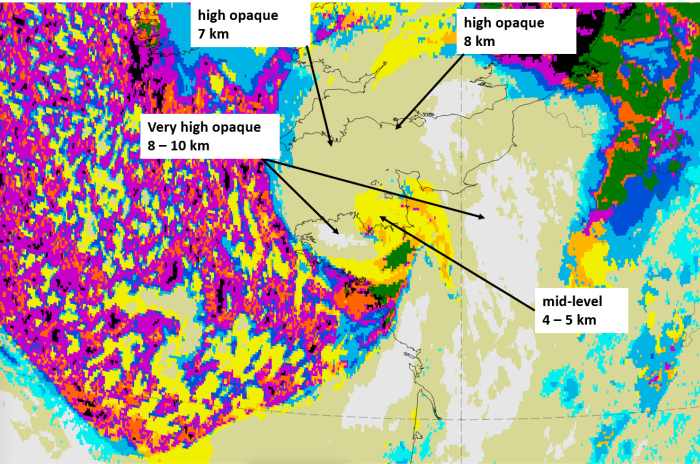
Legend:
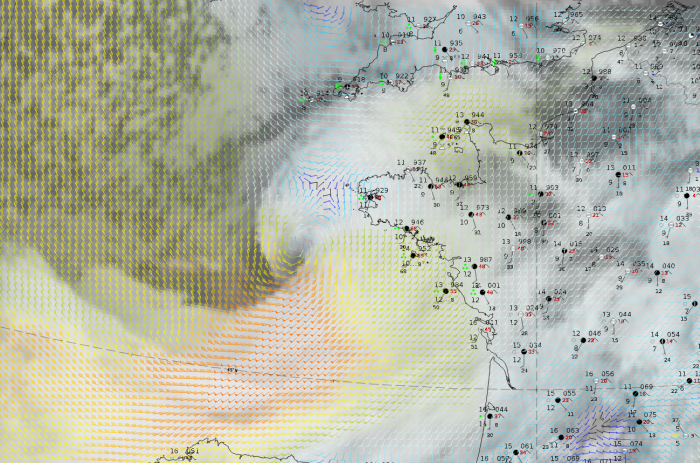
1 October 2020, 18 UTC, IR ; superimposed:
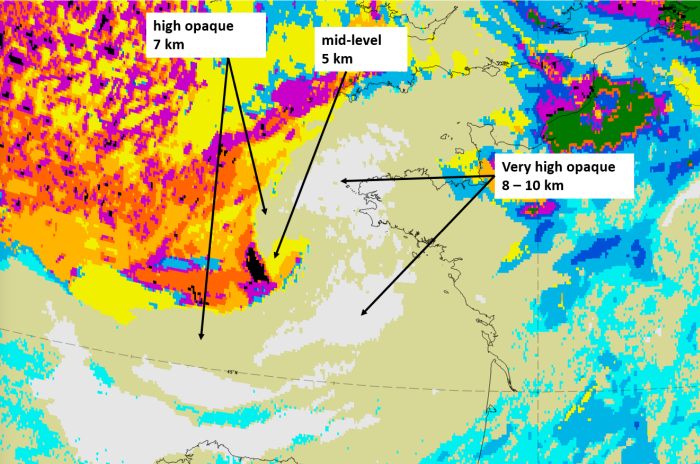
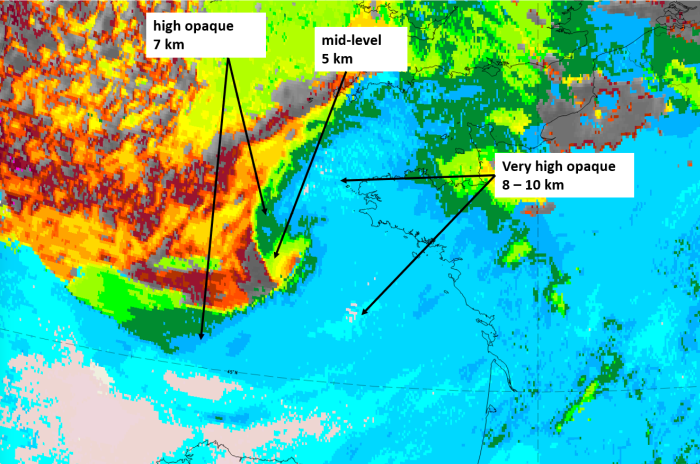
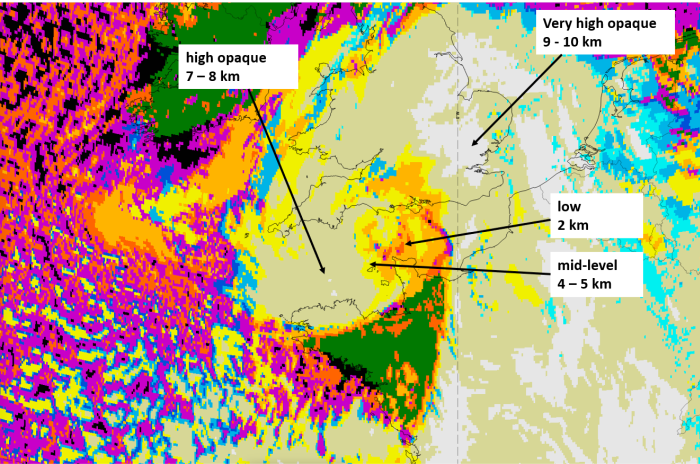
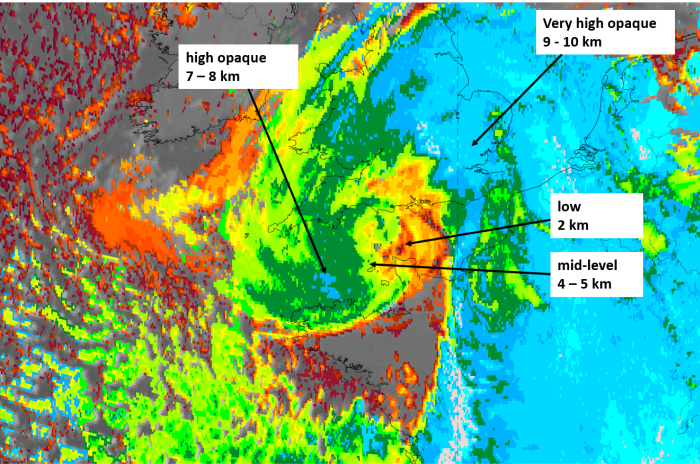
1st row: Cloud Type (CT NWCSAF) (above) + Cloud Top Height (CTTH - NWCSAF) (below); 2nd row: Convective Rainfall Rate (CRR NWCSAF) (above) + Radar intensities from Opera radar system (below).
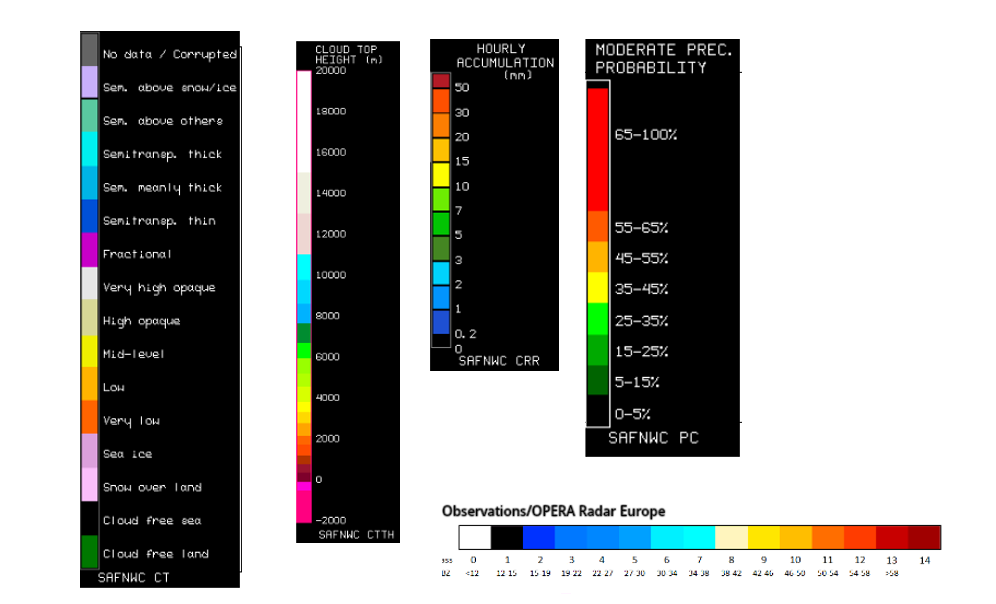
For identifying values for Cloud type (CT), Cloud type height (CTTH), precipitating clouds (PC), and Opera radar for any pixel in the images look into the legends. (link).
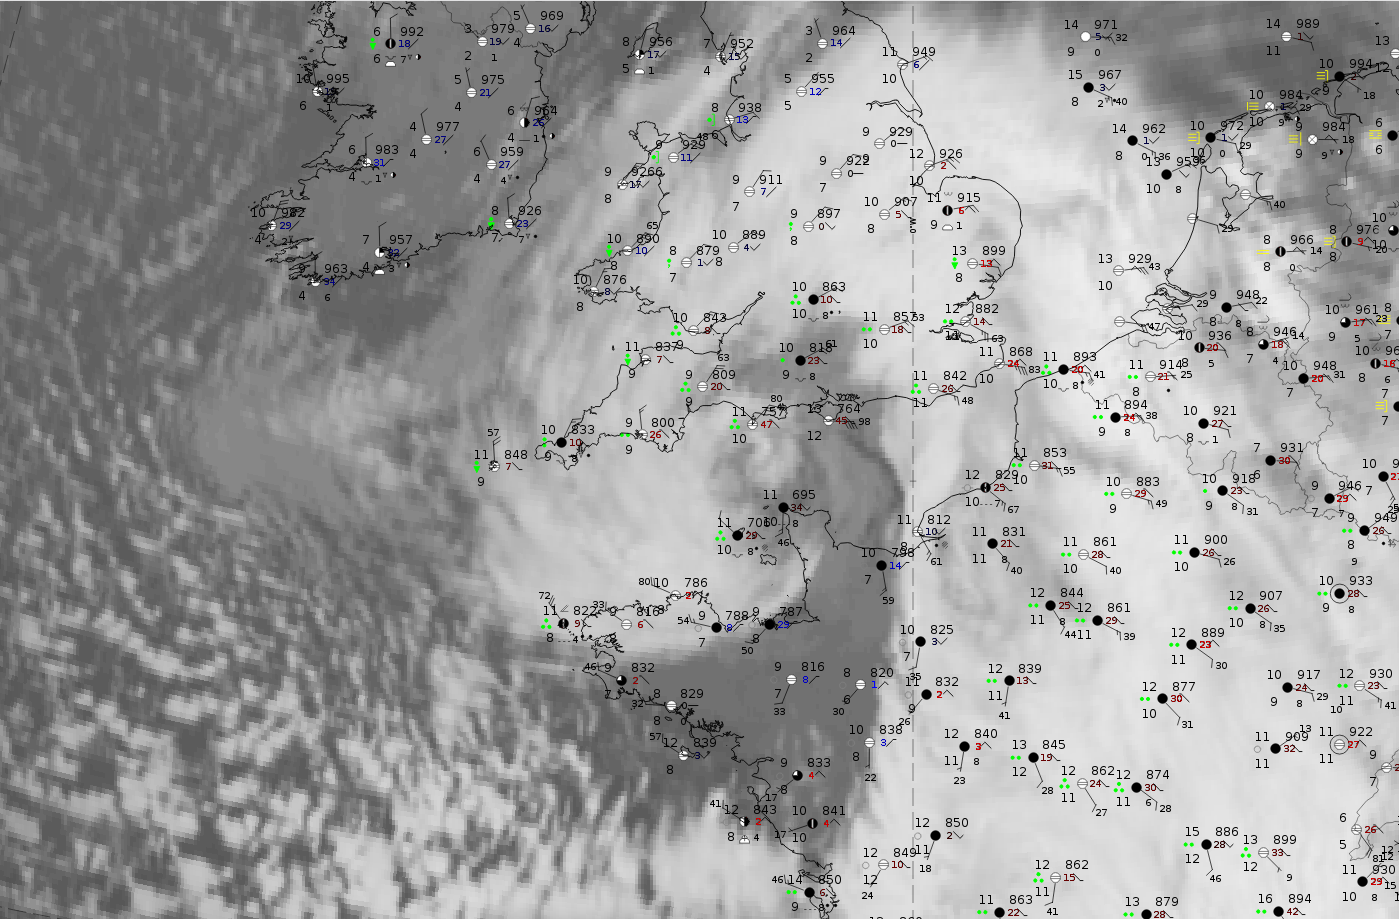
Advanced phase: 2 October 2020, 00 UTC
Fig. 33: Weather events at the ground level
|
|
Note: for a larger SYNOP image click this link.
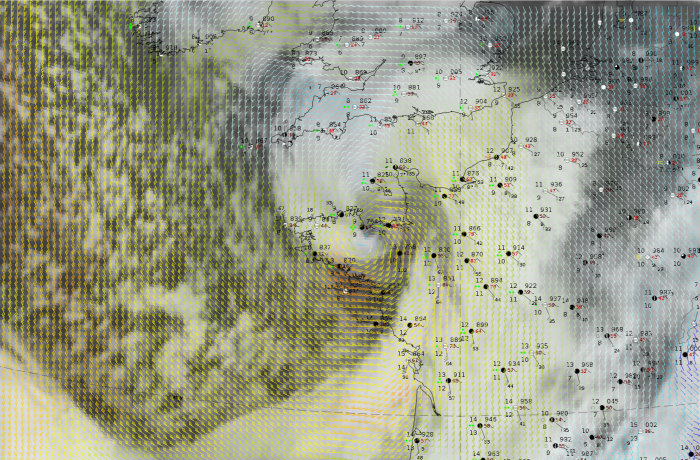
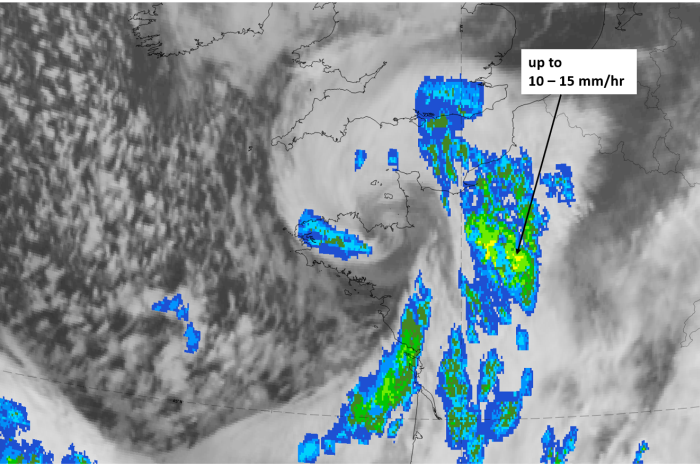
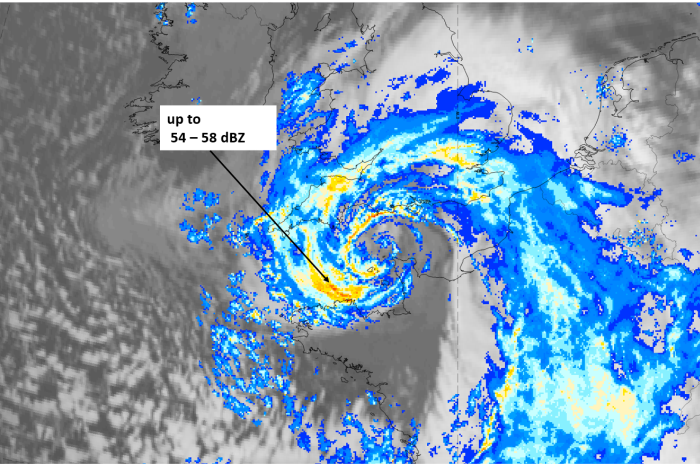
In the advanced stage which can be seen over Brittany and the Normandie there are wide-spread intensive precipitation events visible. The strongest surface winds appear immediately to the south of the spiral centre with speed values up to 50 knots.
|
|
|
|
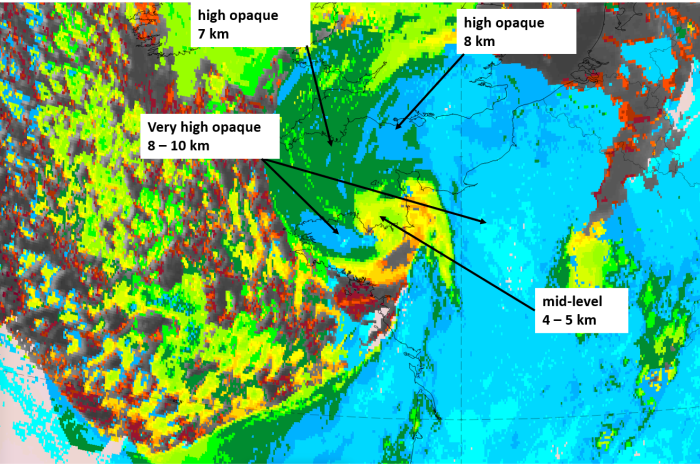
2 October 2020, 00 UTC, IR; superimposed:
1st row: Cloud Type (CT NWCSAF) (above) + Cloud Top Height (CTTH - NWCSAF) (below); 2nd row: Convective Rainfall Rate (CRR NWCSAF) (above) + Radar intensities from Opera radar system (below).
For identifying values for Cloud type (CT), Cloud type height (CTTH), precipitating clouds (PC), and Opera radar for any pixel in the images look into the legends. (link).
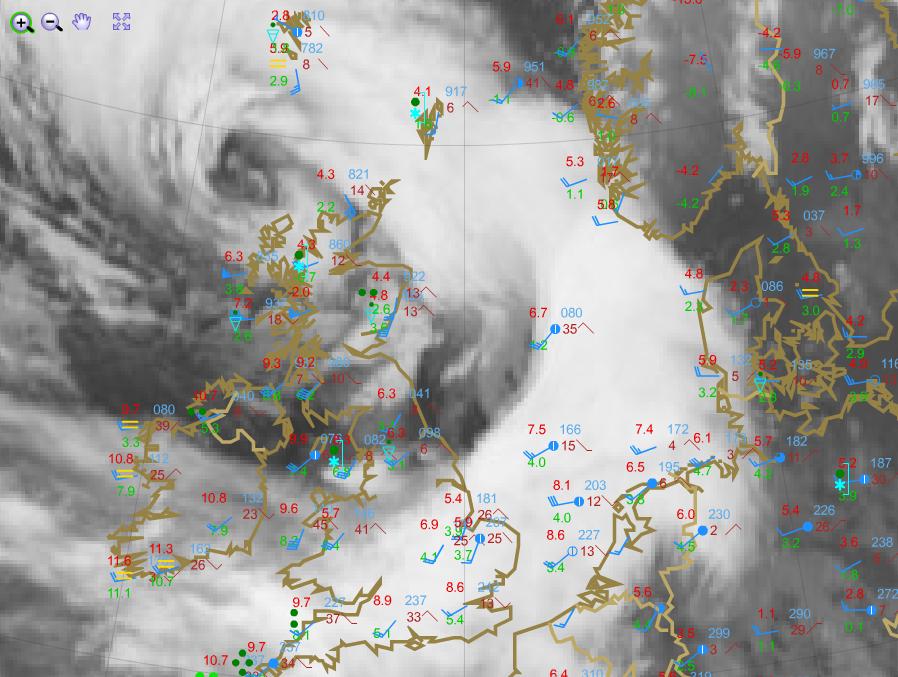
Mature phase: 2 October 2020, 06 UTC
Fig. 34: Weather events at the ground level
|
|
Note: for a larger SYNOP image click this link.
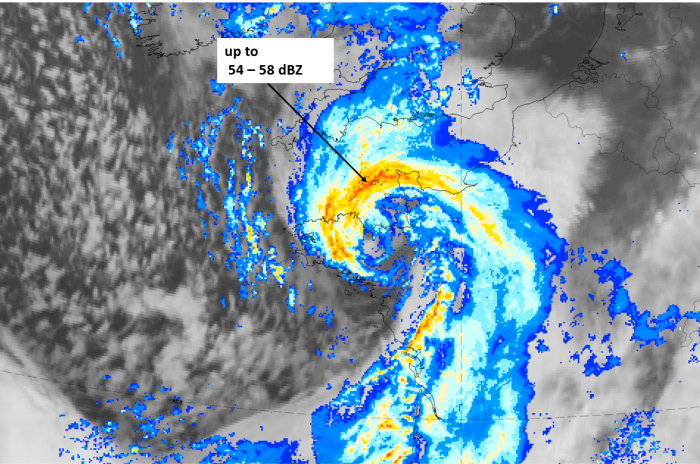
In the mature stage, which is centred over the English Channel, there are still wide-spread intensive precipitation events. The strongest surface winds appear immediately to the north-east of the spiral centre with speed values up to 50 knots.
|
|
|
|
2 October 2020, 06 UTC, IR; superimposed:
1st row: Cloud Type (CT NWCSAF) (above) + Cloud Top Height (CTTH - NWCSAF) (below); 2nd row: Convective Rainfall Rate (CRR NWCSAF) (above) + Radar intensities from Opera radar system (below).
For identifying values for Cloud type (CT), Cloud type height (CTTH), precipitating clouds (PC), and Opera radar for any pixel in the images look into the legends. (link).
One important severe, even catastrophic, weather event taking place in the later development stages of a rapid cyclogenesis is the appearance of sting jets. For demonstrating such an event the case of 9 January 2015 is used, which also has banded cloud structures (discussed in the first chapter). The sting jet can be observed at 00 UTC.
Although the cloud spiral is not directly over land, heavy showers and high wind speed can be seen in synoptic measurements over the Hebrides (NW Scotland).
Legend: 9 January 2015, 00 UTC, Meteosat; IR 10.8 and synoptic observations.
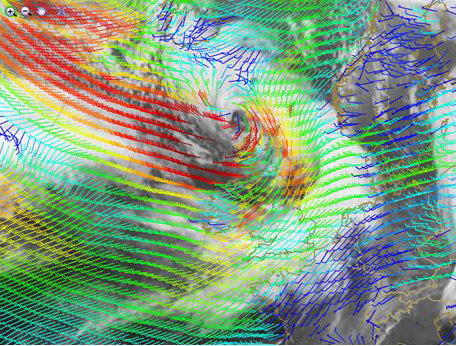
Legend: 9 January 2015, 00 UTC, Meteosat; IR 10.8 and ECMWF 10m wind
The 10-meter wind speed maximum and its location, typical for a sting jet - discussed in the "Meteorological Physical Background" chapter - can be seen in the data from 9 January 2015, 00:00 UTC.
As already mentioned in the table above, sting jets may appear at the innermost part of the cloud spiral during the advanced and mature stages of a Rapid Cyclogenesis event.
A sting jet is a mesoscale (no wider than about 100 km) zone of fast moving air descending from a height of 3-4 km to the surface just south of the low centre. The high winds last only for a few hours, but they can cause widespread damage on the surface.
Sting jets may occur in connection with any intensive cyclogenesis. Their structure and development are not yet fully understood; both dynamical and thermodynamical approaches have been applied.
The next two images show the moist isentropes and isotachs in vertical cross sections (VCSs) from 8 January 2015 at 12:00 and 18:00 UTC. Both cross sections show the maximum of the upper level jet with the core between about 250 and 300 hPa. But during these 6 hours a second wind maximum has developed in the low layers with a core between 950 and 800 hPa.
Although it is not so easy to decide if this is a sting jet or some other wind speed maximum, these two figures do demonstrate the applicability of VCSs for a more detailed investigation of strong winds and the possibility of their damaging impact.
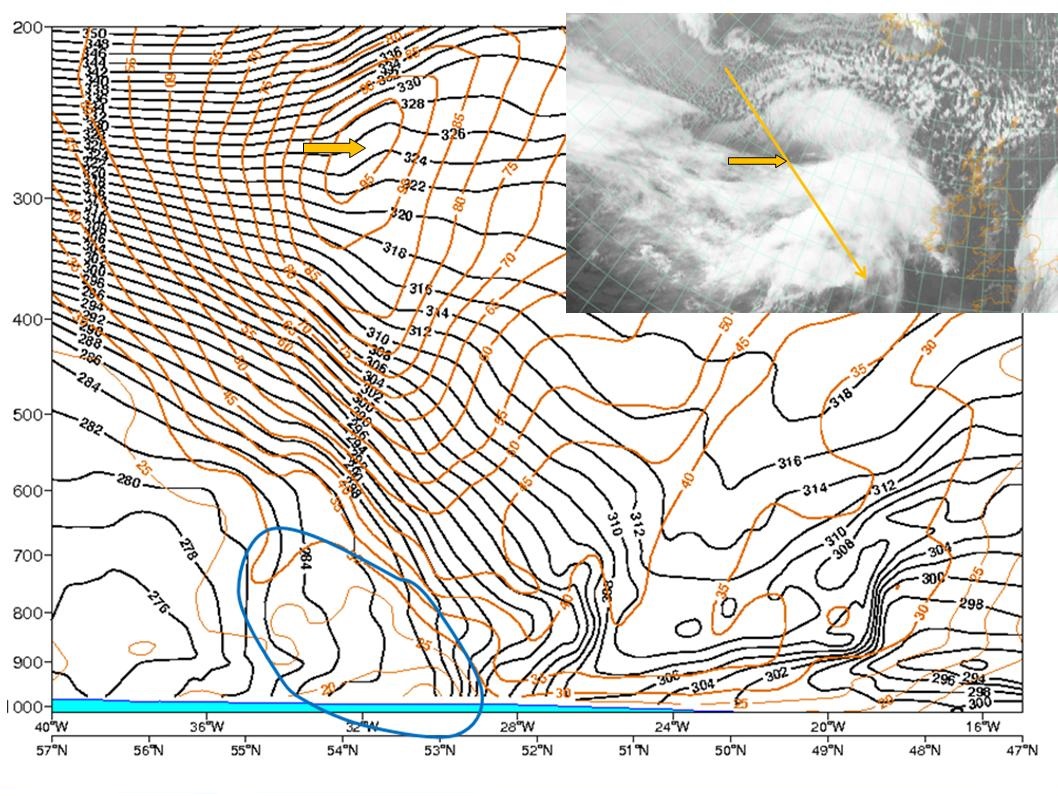
Fig. 35: 8 January 2015, 12:00 UTC - Meteosat 10, IR 10.8 image. Black: moist isentropes; brown: isotachs; yellow: orientation of VCS line; yellow arrow: position of upper level jet core; blue line: area under the front from the surface up to 700 hPa.
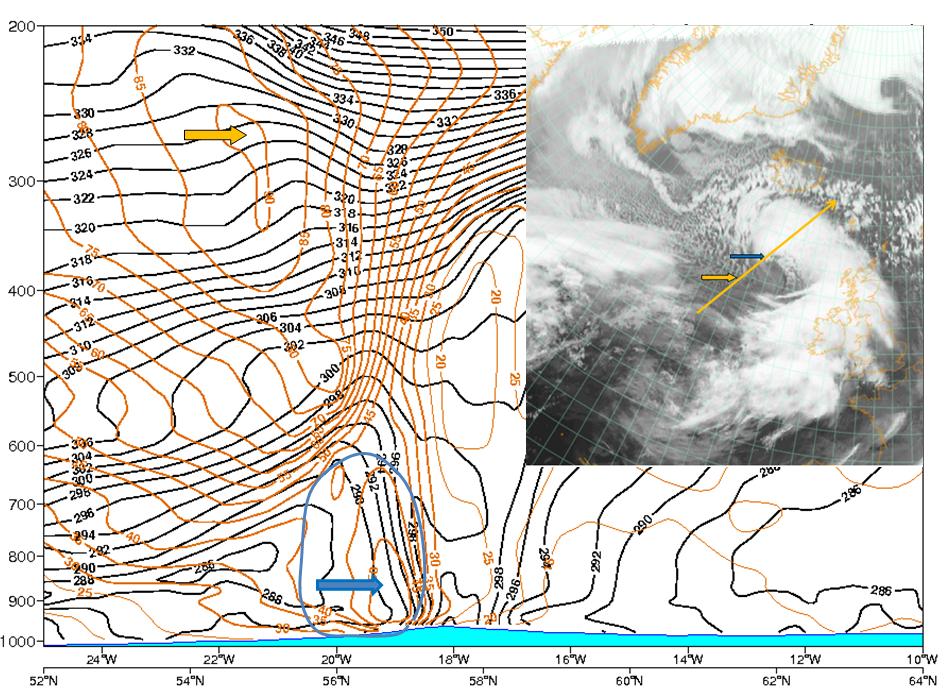
Fig. 36: 8 January 2015, 18:00 UTC - Meteosat 10, IR 10.8 image. Black: moist isentropes; brown: isotachs; yellow: orientation of VCS line; yellow arrow: position of upper level jet core; blue arrow: position of a low level jet (possibly a sting jet); blue line: area under the front from the surface up to 700 hPa.