Typical Appearance in Vertical Cross Sections
- Moist isentropes
- Relative humidity:
- Potential vorticity (PV):
- Temperature advection (TA):
- Vorticity advection (PVA/NVA):
- Isotachs:
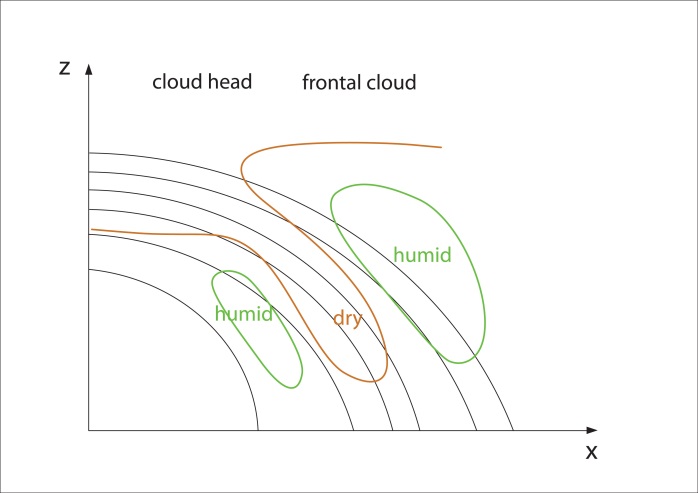
The isolines of moist isentropes form a downward-inclined zone with a high gradient typical for cold fronts. In the case of a Rapid Cyclogenesis the zone is broad and contains isolines of both the cold front and the cloud head, which are close to each other, or even merge together.
In the initial stages, where the cold front and cloud head are clearly separated, there is often a double structure within this zone as well. This double structure vanishes as the distinct cloud spiral develops.
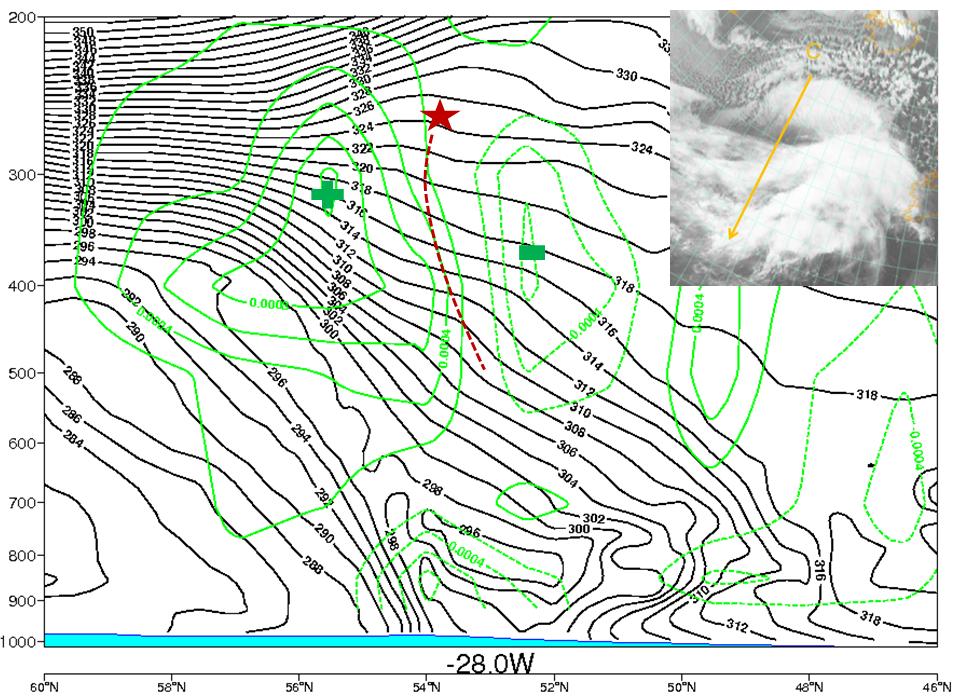
The relative humidity is high within the frontal cloud band and cloud head. In between them, within the dry tongue, can be found low values of relative humidity which reach from the tropopause down to relatively low levels in the atmosphere.
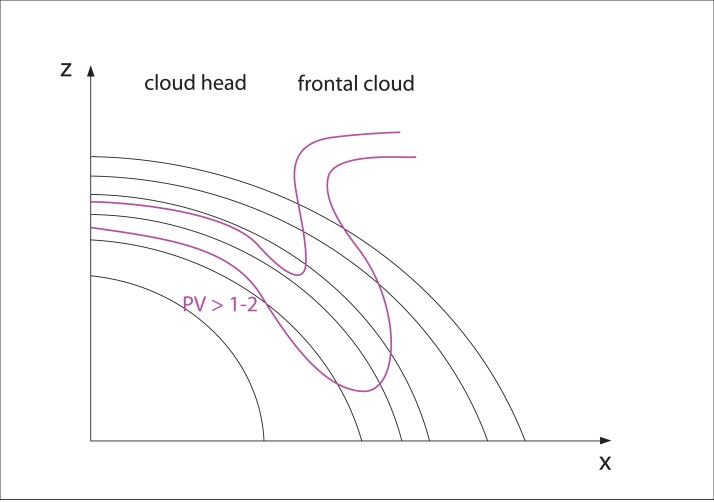
Potential vorticity shows an anomaly protruding downward deep into the troposphere below the zone with the highest moist isentrope gradient in the cold front. This lowering of the so-called dynamical tropopause (1 - 2 PV Units) is already clearly seen in the initial stage, where the tropopause height sinks below about 400 hPa. In the mature stage the tropopause is usually below 500 hPa and in extreme cases below 700 hPa. At the same time there is an intensification of PV in the lowest tropospheric layer from the typical values of PV < 1 unit to PV > 1 unit and more. In the final phase a column of PV values > 1 unit develops and stretches from the stratosphere down almost to the surface.
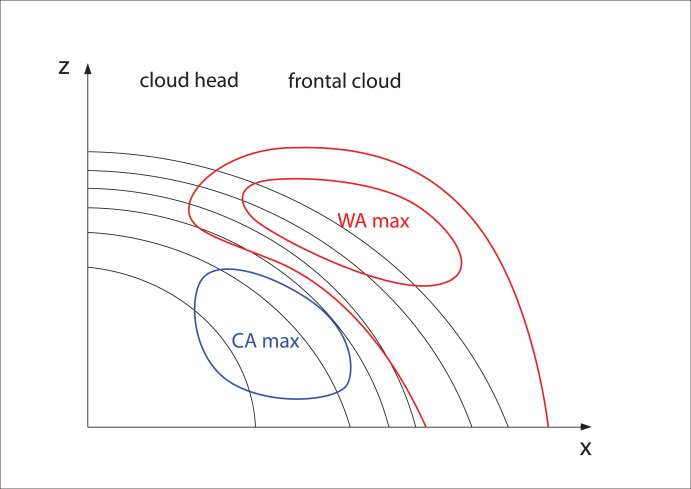
The temperature advection shows a very distinct situation similar to but more pronounced than a classical wave; there is a maximum of warm advection within and ahead of the cloud head, and cold advection directly behind it.
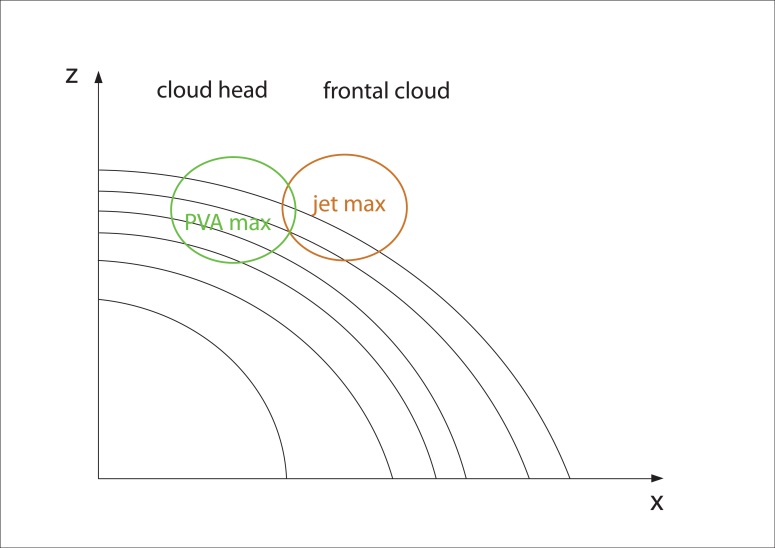
The vorticity advection shows a pronounced PVA maximum in the upper levels, mostly situated within the cloud head, and an NVA maximum on the other side of the dry tongue in the gradient zone of the cold front. Both correlate well with the left and right exit regions of the jet streak.
The isotachs show a pronounced jet stream along the rear edge of the frontal gradient of the cold front. The cloud head can often be found within the left exit region of a jet streak situated upstream of the low. In later stages of development, another maximum of the isotachs is often present at the poleward side of the cloud head.
A sting jet can develop in the advanced development stage and mature stage. It can be seen as an isotach maximum below the frontal zone, reaching from the surface up to 700 hPa.
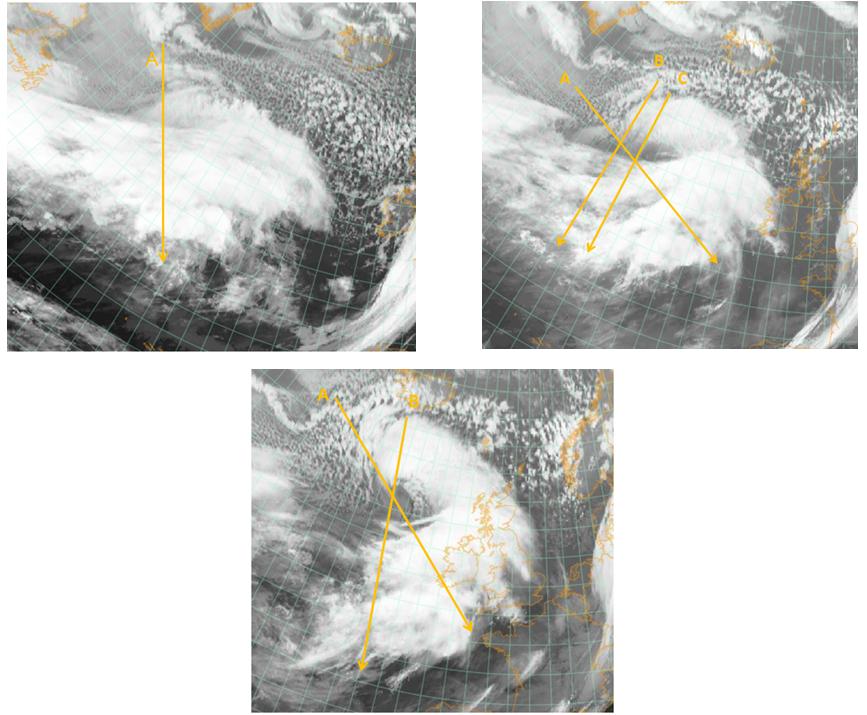
The images from 8 January 2015 show three time steps in the life cycle of a Rapid Cyclogenesis at 06, 12 and 18 UTC.
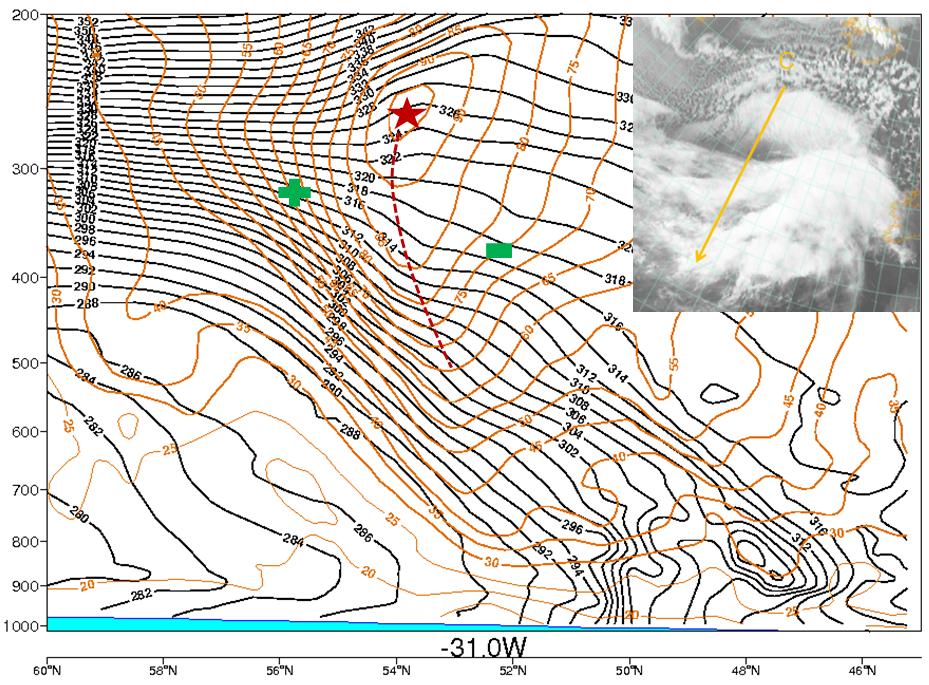
The cross sections are taken across the cloud head and the cold front from north-northwest to south-southwest through the deepening surface low and the developing dry intrusion. For the different stages of development slightly different cross sections were made to show the most indicative features of each stage.
| Fig. 27a: 8 January 2015, 06:00 UTC - Meteosat 10, IR 10.8 image. Orange: location of vertical cross section A. | Fig. 27b: 8 January 2015, 12:00 UTC - Meteosat 10, IR 10.8 image. Orange: locations of vertical cross sections A, B and C. |
 |
|
| Fig. 27c: 8 January 2015, 18:00 UTC - Meteosat 10, IR 10.8 image. Orange: locations of vertical cross sections A and B. | |
Relative Humidity
 |
 |
| Fig. 28a: Schematics for moist isentropes and relative humidity: Initial and development stage. | Fig. 28b: 8 January 2015, 06:00 UTC - vertical cross section A. Black: moist isentropes (ThetaE), green/brown: relative humidity. |
Potential Vorticity
 |
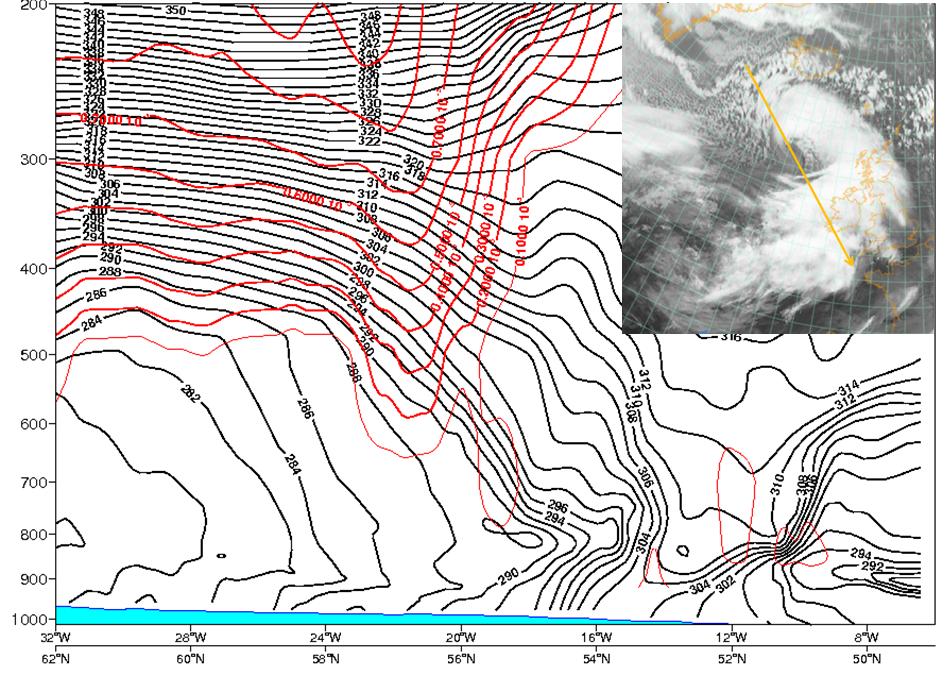 |
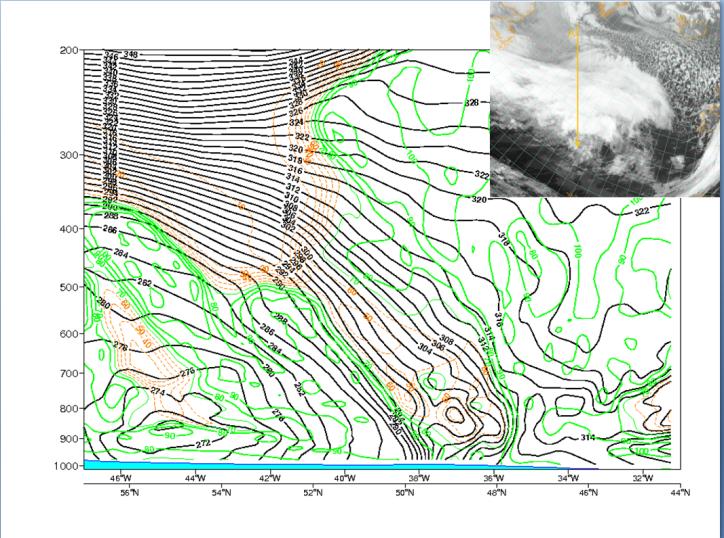
| Fig. 29a: Schematics for moist isentropes and potential vorticity (PV): all development stages. | Fig. 29b: 8 January 2015, 18:00 UTC - vertical cross section A. Black: moist isentropes (ThetaE), red: potential vorticity: heavy: > 2 PVU, light: < 2 PVU. |
Temperature Advection
 |
 |
| Fig. 30a: Schematics for moist isentropes and temperature advection: initial to advanced stages. | Fig. 30b: 8 January 2015, 12:00 UTC - vertical cross section A. Black: moist isentropes (ThetaE), temperature advection: red: warm advection; blue: cold advection. |
Vorticity Advection and Isotachs
 |
|
| Fig. 31a: Schematics for moist isentropes, isotachs and vorticity advection: initial to advanced stages. | |
 |
 |
| Fig. 31b: 8 January 2015, 12:00 UTC - vertical cross section A. Black: moist isentropes (ThetaE), brown: isotachs | Fig. 31c: 8 January 2015, 12:00 UTC - vertical cross section A. Black: moist isentropes (ThetaE), green: vorticity advection |