Meteorological Physical Background
The classical Norwegian model
The classical development of an Occlusion (Warm conveyor Belt Type) is described in the well-known Polar Front theory after Bergeron, Bjerknes and Solberg with a development sequence from a Wave Stage to an Occlusion Stage.
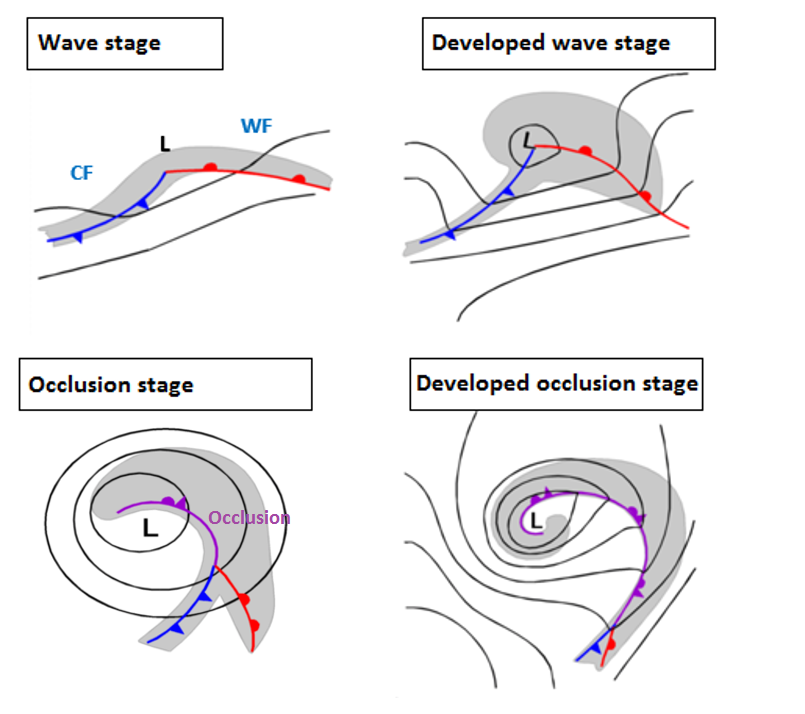
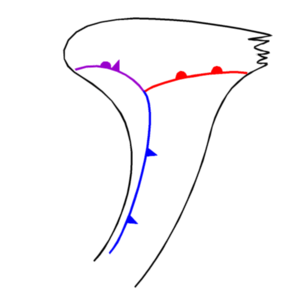
According to this classical theory of the Occlusion cloud band, this front separates the cold air mass, which is situated in front of the former Warm Front, from that behind the former Cold Front with a tongue of warm air within the higher levels of the troposphere (see Typical appearance in vertical cross section). Following the distribution of the temperature in front of and behind the Occlusion, three sub-types can be separated:
- If the air situated in front of the Warm Front has about the same temperature as the air situated behind, the temperature gradient dissolves during the process of the Occlusion. In this case the Occlusion is characterized only by a line of cyclonic shear and convergence which can be found vertically below the merging point of both fronts
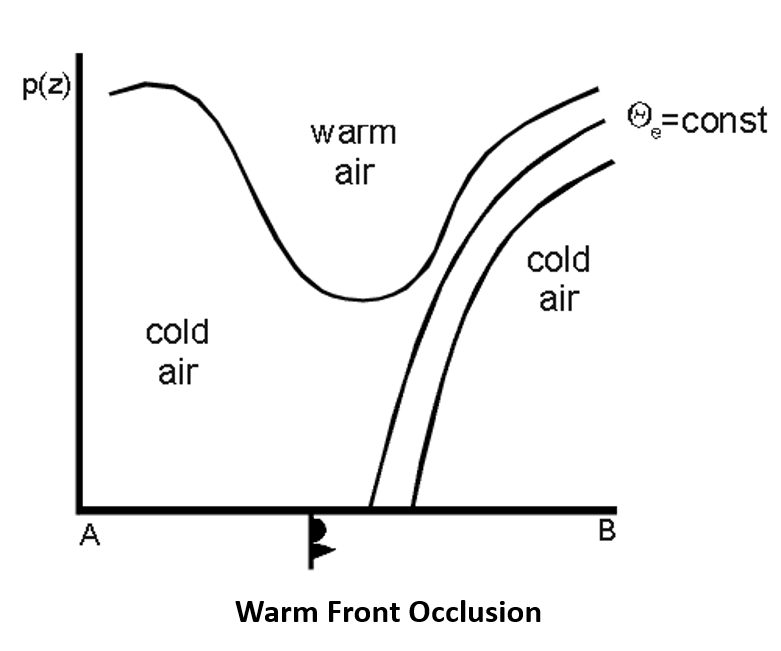
- If the air situated in front of the Warm Front is colder than the air behind, a so-called Warm Front Occlusion develops which has a forward inclined frontal surface
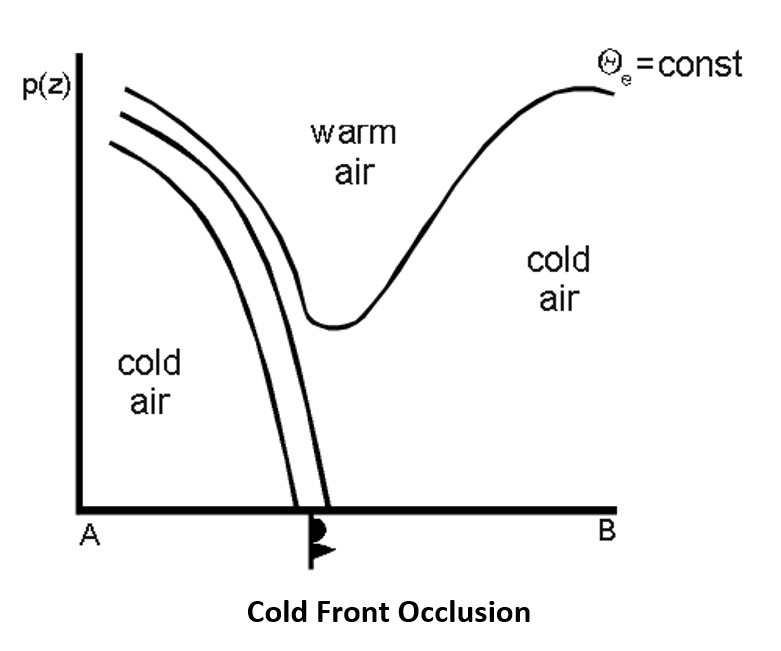
- If the air situated in front of the Warm Front is warmer than the air behind, a so-called Cold Front Occlusion develops which has a backward inclined frontal surface
 |
 |
Deviations between cloud configurations in satellite images and the classical Norwegian model
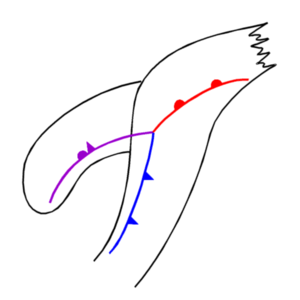
Very soon after the use and study of satellite images it became clear that this idealized theory cannot be observed in every step and detail in reality. In particular, the overtaking of the Warm Front by the Cold Front with very narrow warm sectors can never be seen in the early development stages (left schematic). Instead of this a merging of Cold and Warm Front cloudiness in the centre of the surface low takes place followed by a westward extension of the Occlusion cloud spiral, while the Warm Front cloudiness becomes shorter (right schematic).
 |
 |
Beside this there are Occlusion spirals which contradict the overtaking mechanism completely. Those developments show a lower cloud spiral penetrating westward from below the Cold Front and Warm Front.
This type of occlusion cloud bands can much better be explained with the conveyor belt model and is described as a different Conceptual Model (Cold Conveyor Belt Occlusion) in this Satellite Manual.
The Conveyor Belt Model
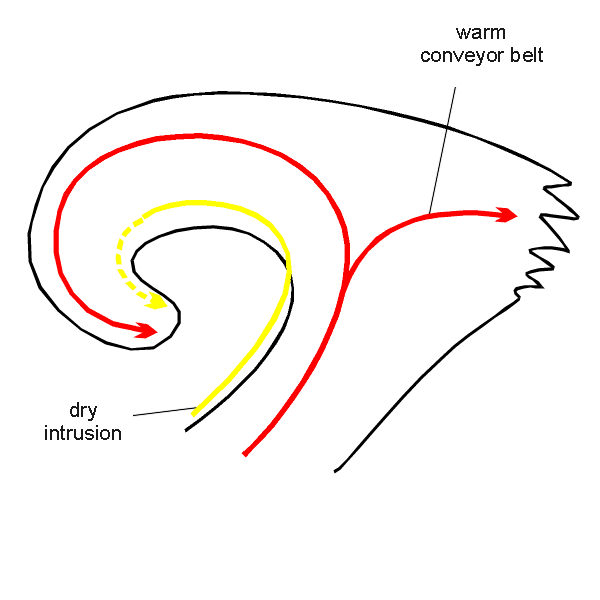
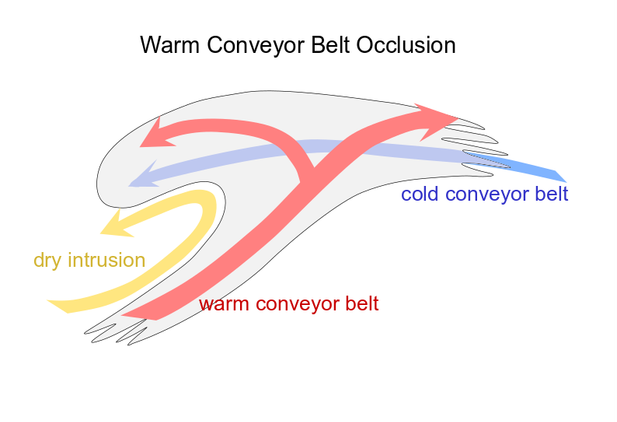
The structure and formation of the cloud spiral of the Warm Conveyor Belt Occlusion type can also be described with the conveyor belt theory (Link to the theory chapter in Basics) as follows.
The higher levels of the troposphere are characterized by two relative streams:
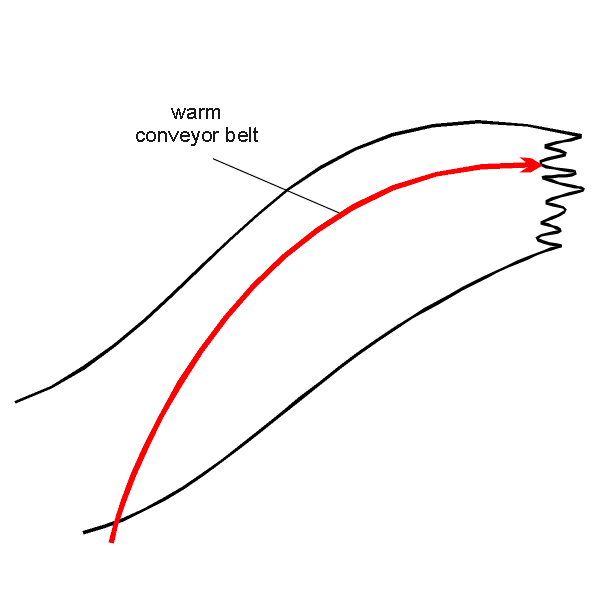
- The Warm Conveyor Belt
The configuration of the warm conveyor belt depends on the stage of development. In the early wave stage the warm conveyor belt ascends within the cloud band of the Cold and Warm Front where it turns anticyclonically parallel to the surface warm front (see Warm Front Band). During this type of Occlusion development, the warm conveyor belt develops to a ridge-like hook over the occlusion band and later on splits into two parts: the eastern branch follows the cloud band of the Warm Front while on the western branch follows the cloud spiral of the Occlusion. This is one main difference to the Cold Conveyor Belt Type Occlusion.
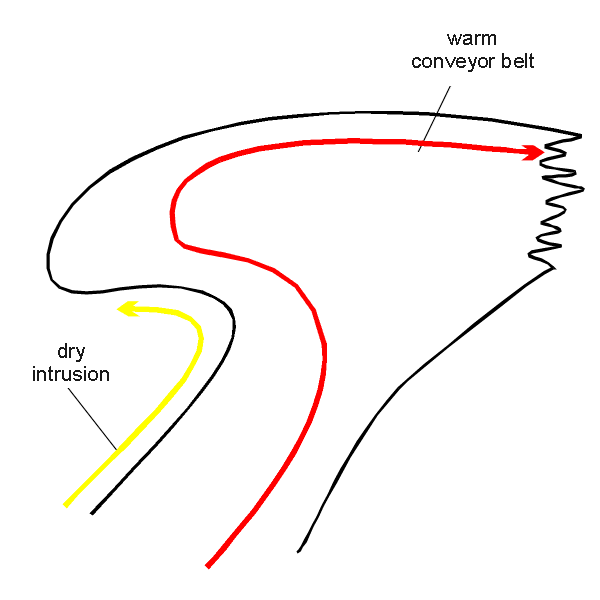
- The Dry Intrusion
The dry intrusion is accompanied by descending air originating from the upper levels of the troposphere and/or the lower levels of the stratosphere. The dry intrusion is approximately to the rear/inner cloud edge of the cloud spiral of the Occlusion. If at all it overruns only the inner boundary zones of the cloud band. These are the areas predestined for the development of Cb Cloudiness, which often can be observed in the images (see Cloud structure in satellite image) as well as in the synoptic weather reports (see Weather events). The following reasons for the convective development can be found:
- the air advected within the dry intrusion has lower values of relative humidity than the air within the occlusion cloud band; this leads to the development of a conditionally unstable stratification;
- a CVA maximum indicating moving curvature vorticity contributes to upward motion according to the omega equation. This upward motion in the potential unstable environment can cause strong convection.
The fact that the dry intrusion does not cross the Occlusion cloud band in this warm conveyor belt development type is another big difference from the Cold Conveyor Belt Type Occlusion
 |
 |
 |
Because of the view from above on the cloud tops of the occlusion spiral in satellite images a third relative stream, which is involved in the process of a cyclogenesis is not visible in these stages of development.
The Cold Conveyor Belt which can be found parallel to the surface warm front below the Warm Conveyor Belt and is as such responsible for the lower layer of the cloudiness.
Discussion
A comprehensive study at ZAMG of many occlusion events over several years shows many of the mentioned points described above, but also some deviations. These facts can be summarized as follows:
- Classical Occlusion developments like the one described in this chapter occur rather seldom
- In most cases a cold conveyor belt with a lower cloud spiral could be observed
- Whether a Warm Conveyor Belt Occlusion type or a Cold Conveyor Belt Occlusion type develops seems to depend on the stage of development of the cyclone. If the height field in the mid- and upper levels of the troposphere displays a closed cyclonic circulation, the Warm Conveyor Belt Occlusion cloud spiral characterized by multilevel cloudiness is likely (see Key parameters). This is another difference between the two types of Occlusion (see Occlusion: Cold Conveyor Belt Type - Cloud structure in satellite image) and could be a tool for an early discrimination
- While the hook form of the warm conveyor belt in the beginning of the development can clearly be observed, appears the splitting into two branches in later stages not so clear and only during the transition of a Cold Conveyor Belt to a Warm Conveyor Belt Occlusion
|
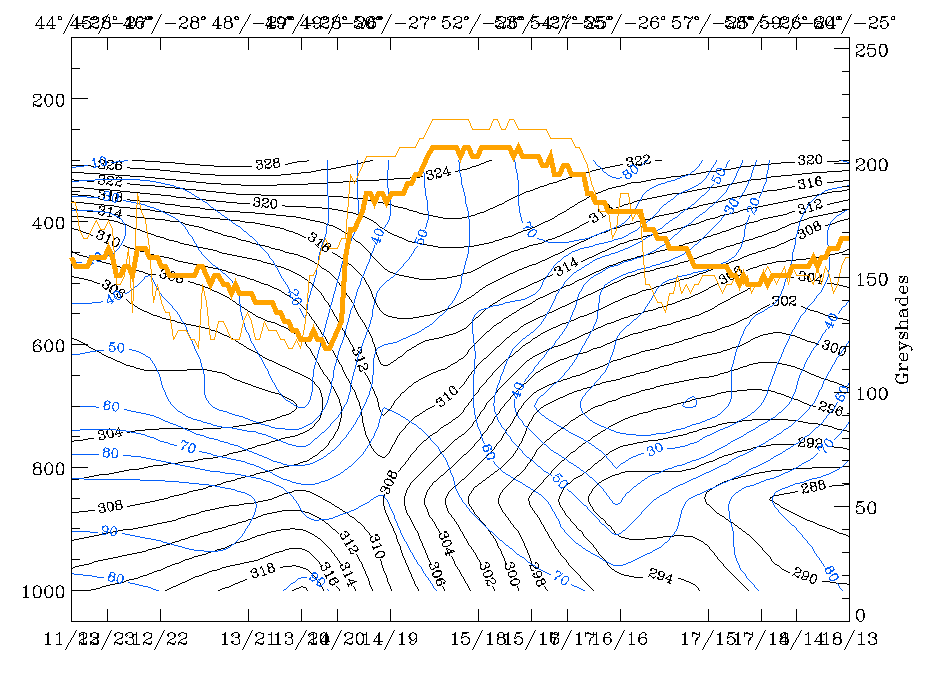
21 October 1996/18.00 UTC - Vertical cross section; black: isentropes (ThetaE), blue: relative humidity, orange thin: IR pixel values, orange thick: WV pixel values
|
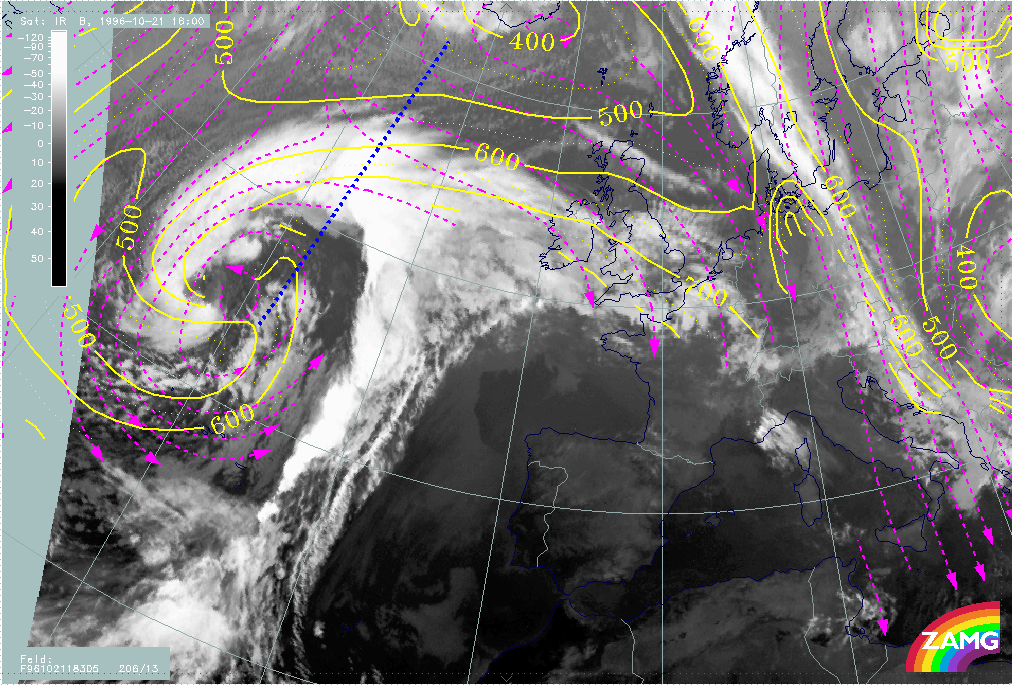
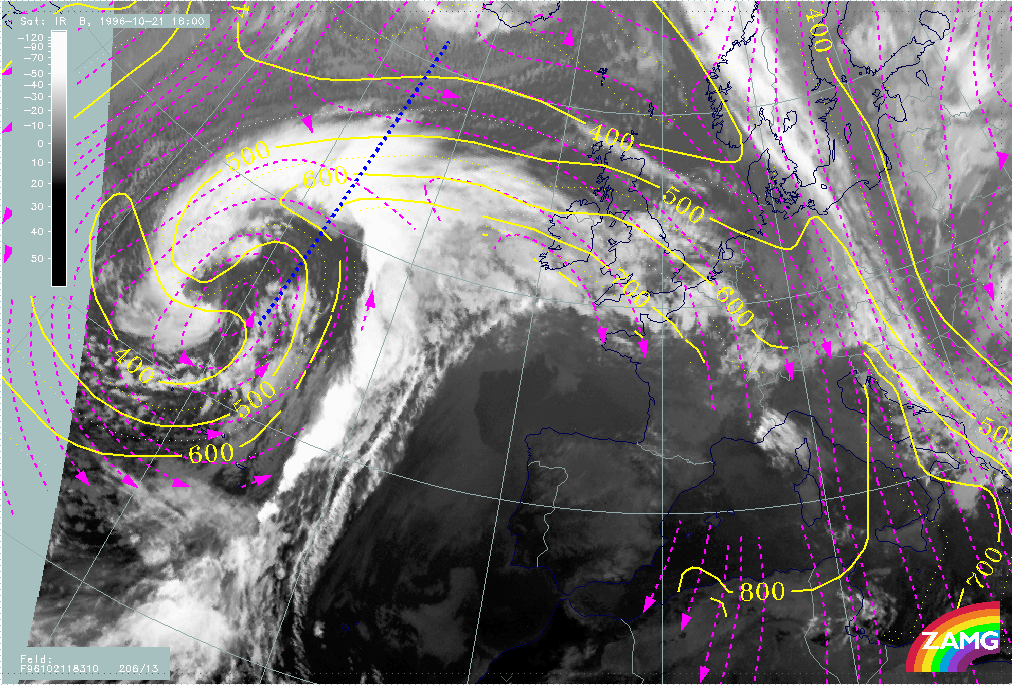
21 October 1996/18.00 UTC - Meteosat IR image; magenta: relative streams 305K - system velocity: 206° 13 m/s, yellow: isobars 305K, position of vertical cross section indicated
|
|
|
|
|
|
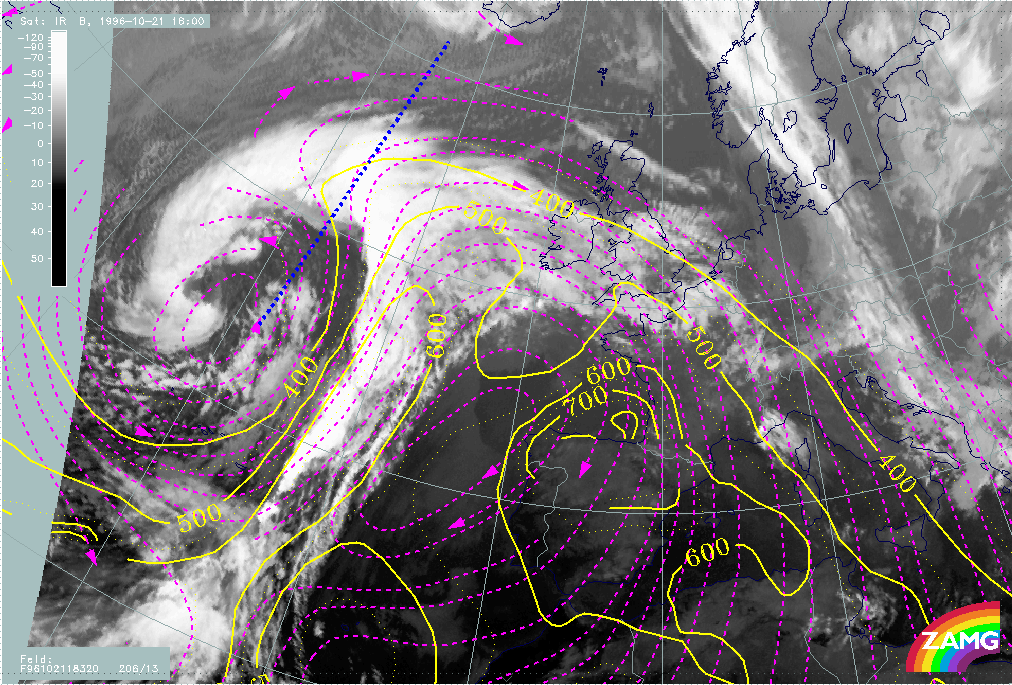
21 October 1996/18.00 UTC - Meteosat IR image; magenta: relative streams 310K - system velocity: 206° 13 m/s, yellow: isobars 310K, position of vertical cross section indicated
|
21 October 1996/18.00 UTC - Meteosat IR image; magenta: relative streams 320K - system velocity: 206° 13 m/s, yellow: isobars 320K, position of vertical cross section indicated
|
In the vertical cross section, which extends in the Atlantic from approximately 44N/28W to approximately 60N/25W, the isentropic surface of 310K is a surface within the occlusion cloud band. Both relative streams on this surface cut the cross section perpendicularly at about 650 hPa. This is an area of high humidity for the cold conveyor belt, but an area of high humidity gradient for the dry intrusion.
On the isentropic surface of 305K the cold conveyor belt can be observed within the cloud spiral.
A cold conveyor belt can still be observed on the isentropic surface of 310K but the innermost parts of the cloud spiral are already overrun by the dry intrusion.
On the isentropic surface of 320K the hook form of the upper relative stream accompanies a large part of the Occlusion cloudiness. For this the assumption has to be made that the zero line of shear vorticity does not cut the cloud band as computed by the numerical model, but follows the rear cloud edge and is connected to the western zero line of the shear vorticity.