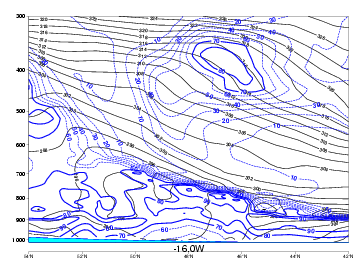
Typical Appearance In Vertical Cross Sections
Open and Closed Cells are mesoscale boundary layer phenomena. This means that unlike most of the other conceptual models, governing processes and dynamics of Open and Closed Cells are confined to the boundary layer. By absence of processes at the synoptic scale governing the dynamics of Open and Closed Cells, vertical cross sections are in this case more a means of identifying the synoptical environment than a means to have insight in the processes in Open and Closed Cell convection.
- Potential Wet Bulb Temperature (Theta-w)
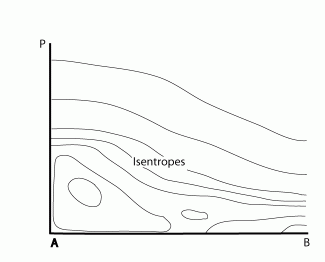
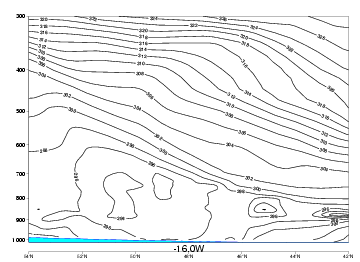
The typical instability can be easily detected in the isentropes. In the lowest levels the potential wet bulb temperature decreases with height, indicating unstable stratification. Around a mean level of 800 hPa, 2 km, wet bulb potential temperature starts to rise again, indicating a change to a stable stratification or inversion. In Open Cell Convection this level is higher than in Closed Cell Convection. - Potential Temperature (Theta)
In the vertical distribution of theta inversions in the lower layers can be detected very easily. Under the inversion potential temperature is (nearly) constant with increasing height, at the inversion potential temperature increases dramatically with height. - Temperature advection
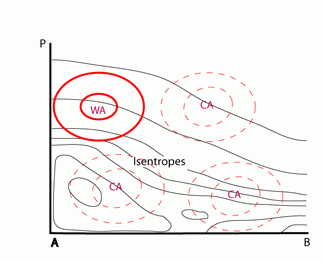
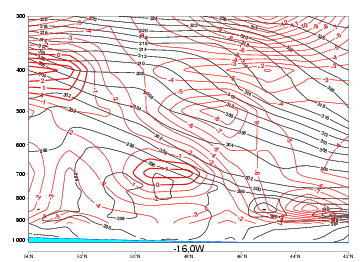
Open and Closed Cell Convection usually occur in an outbreak of cold air, behind cold fronts in areas of cold advection. - Vertical velocity
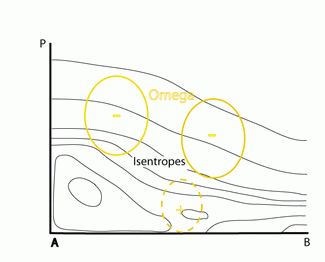
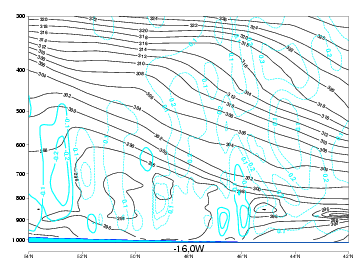
Open and Closed Cell Convection usually occur in areas with large-scale downward vertical motions, due to cold air advection and NVA. However low level convergence (induced by geography/orography) and the resultant upward velocity may 'trigger' Closed Cell Convection. - Relative Humidity
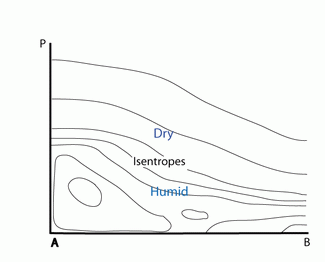
In the vertical distribution of Relative Humidity the humid layers associated with cloudiness can be seen. An dramatic decrease in Relative Humidity is seen above the cloud layers, this decrease is due to the inversion. The moist air is trapped underneath is and above the inversion the air is dry due to subsidence.
|
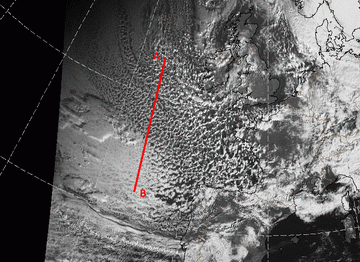
04 November 2009/06.00 UTC - Meteosat 9 HRVIS image; position of vertical cross section indicated
|
|
Potential Web bulb temperature
|
|
04 November 2009/06.00 UTC - Vertical cross section; black: isentropes (ThetaE)
|
Temperature advection (TA)
|
|
04 November 2009/06.00 UTC - Vertical cross section; red: temperature advection, black: isentropes (ThetaE)
|
Vertical velocity
|
|
04 November 2009/06.00 UTC - Vertical cross section; blue: vertical motion - Omega, black: isentropes (ThetaE)
|
Relative humidity
|
|
04 November 2009/06.00 UTC - Vertical cross section; blue: relative humidity, black: isentropes (ThetaE)
|
