Table of Contents
Cloud Structure In Satellite Images
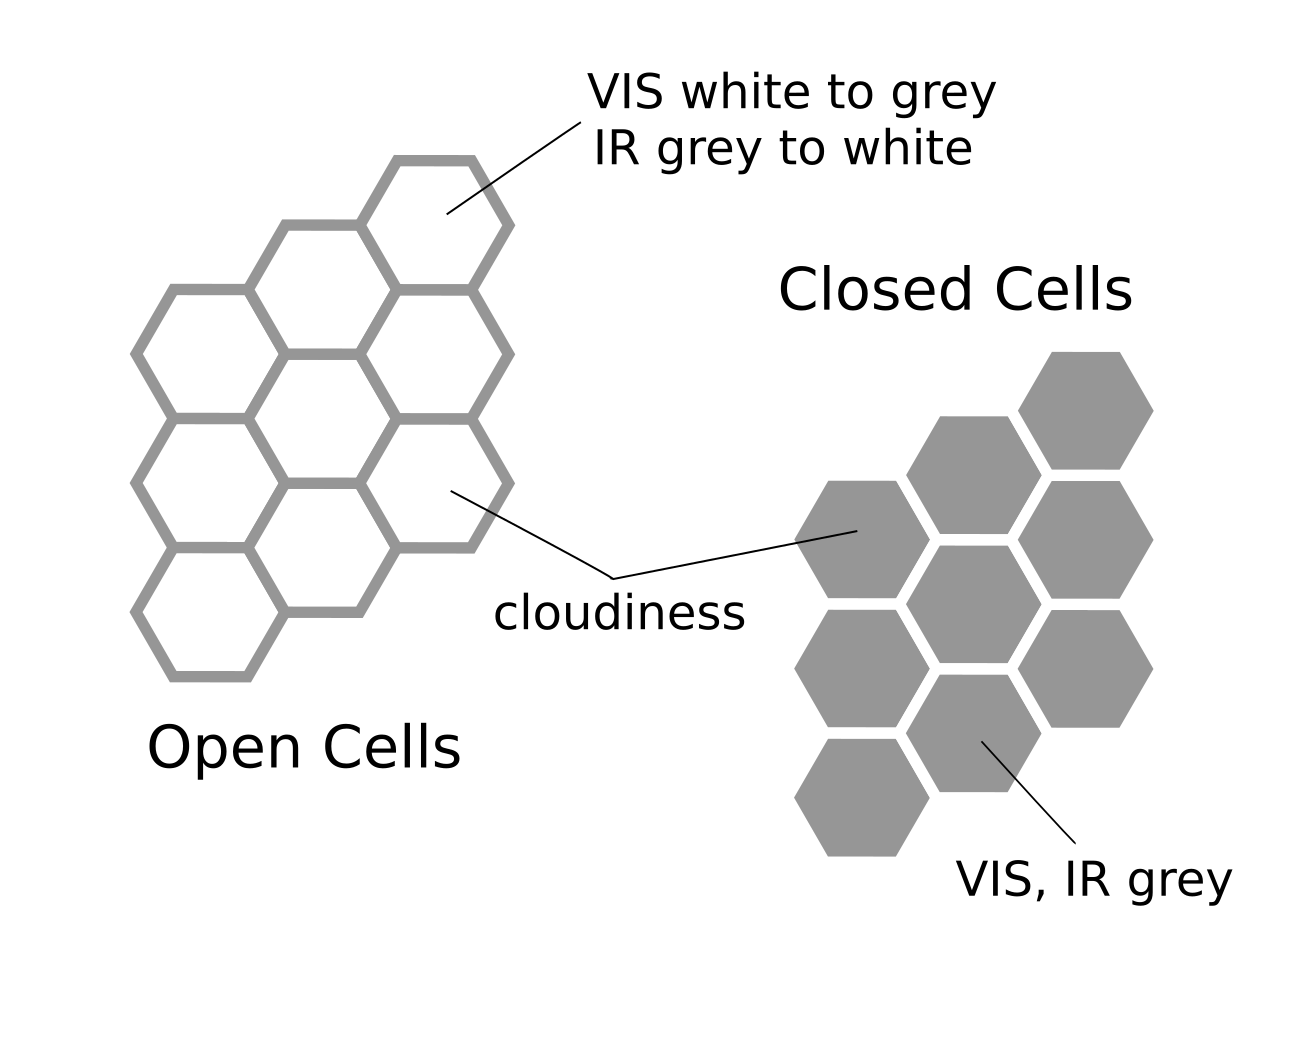
On satellite images, open and closed cells (OCs and CCs) appear as honeycomb-like (or hexagonal) patterns of cloudiness. In the case of open cells the centres are cloud free and the edges of the honeycomb are cloudy. In the case of closed cells the structure is reversed; the centres are cloudy and the edges are cloud free. The clouds of closed cells are in general shallower in depth than those of open cells. The diameters of the cells generally increase with increasing distance downstream.
Appearance in the basic channels:
IR:
In Meteosat IR imagery the pattern of open cells is easily discernible, due to the temperature difference between the cloud tops at the borders and the surface in the cloud free centres. Closed cells are not so easily discernible in IR imagery. This is due to the extensive cloud cover, which has a small temperature contrast at the cloud tops. Due to this small temperature contrast, a region of closed cells has a rather 'smooth' appearance in IR imagery, and the hexagonal cellular structure is not visible unless the cells start to break up so that the cloud free zones between them grow wider. Closed cells have the 'smooth' appearance in IR imagery in common with other low clouds, e.g. stratus/fog and stratocumulus sheets.
HRVis, Vis0.6 and Vis0.8 µm imagery
The hexagonal patterns of open and closed cellular convection (OCC/CCC) can easily be seen in Meteosat-8 VIS imagery. In the HRVIS images the cellular structure is even more visible due to the increased resolution.
WV6.2 and 7.3 µm imagery
In the 6.2 WV channels the OCC/CCC are normally not visible, due to their limited vertical extent (usually only up to 1 - 5 km), while the 7.3 WV channel will reveal some structure. WV imagery however, can be useful indirectly: the horizontal advection of upper-level moist air (although without associated clouds) over the CCC sheets may change the radiation balance of clouds, further leading to evaporation of the cloud sheet.
Appearance in the basic RGBs
Airmass RGB
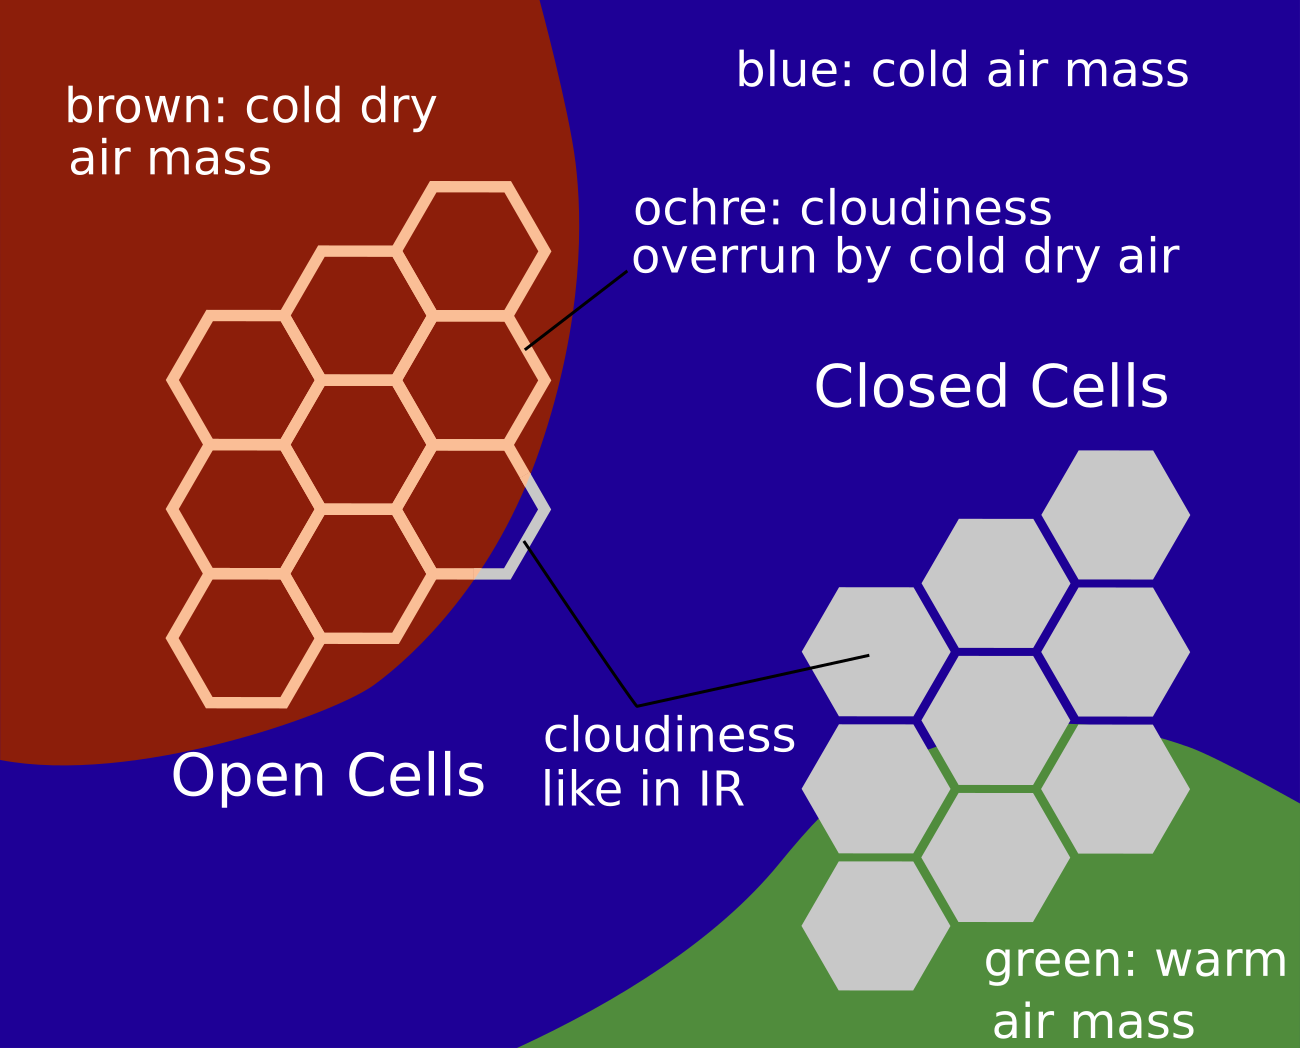
Open and closed cells both appear within a cold air mass. Therefore, there are blue and dark brown colours each for the cold and dry airmasses, respectively. While the open cells appear more to the north of the cold air, closed cells appear more in the southern or southwestern parts where airmasses are warmer. Therefore, open cells are usually overrun by dark brown or blue colours, while closed cells often appear under a greenish shadow.
Dust RGB
The large areas of regular open and closed cell convection are superimposed within large areas of blue colours representing cloud free ground below.
The cloud parts of the open cell convection are ochre for mid-level convection but also dark red where convection has matured. The closed cells are usually smaller in height and appear mostly in ochre colours.
 |
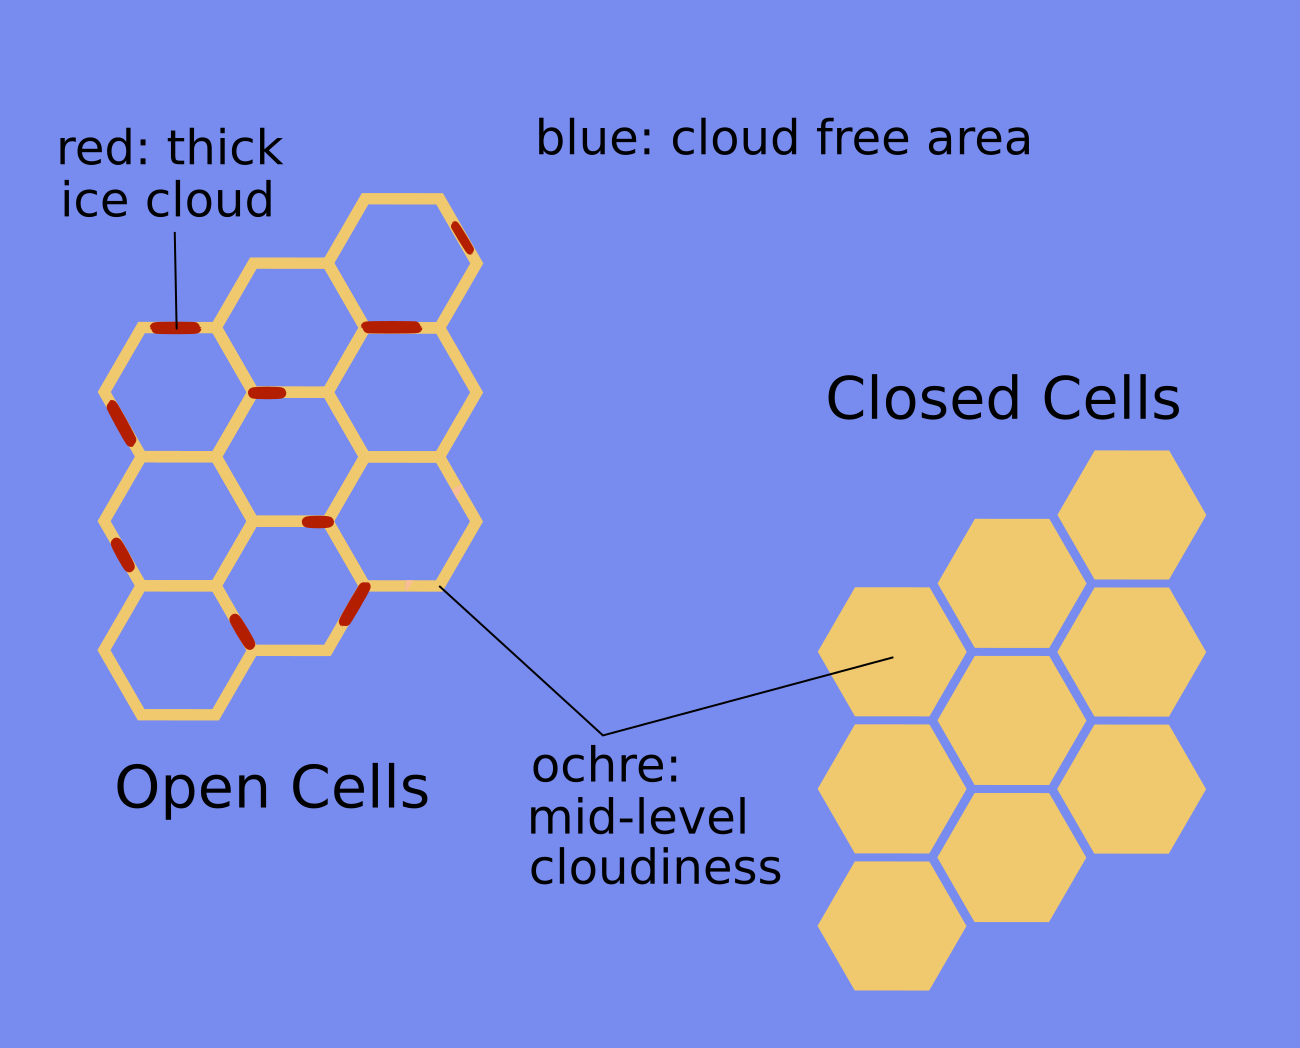 |
Legend: schematics for basic RGBs, Left: airmass RGB; right: dust RGB
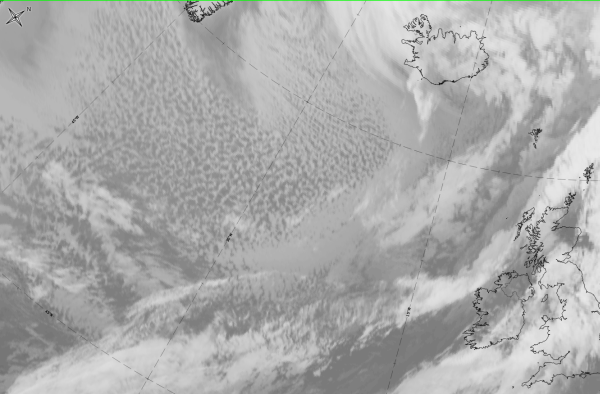
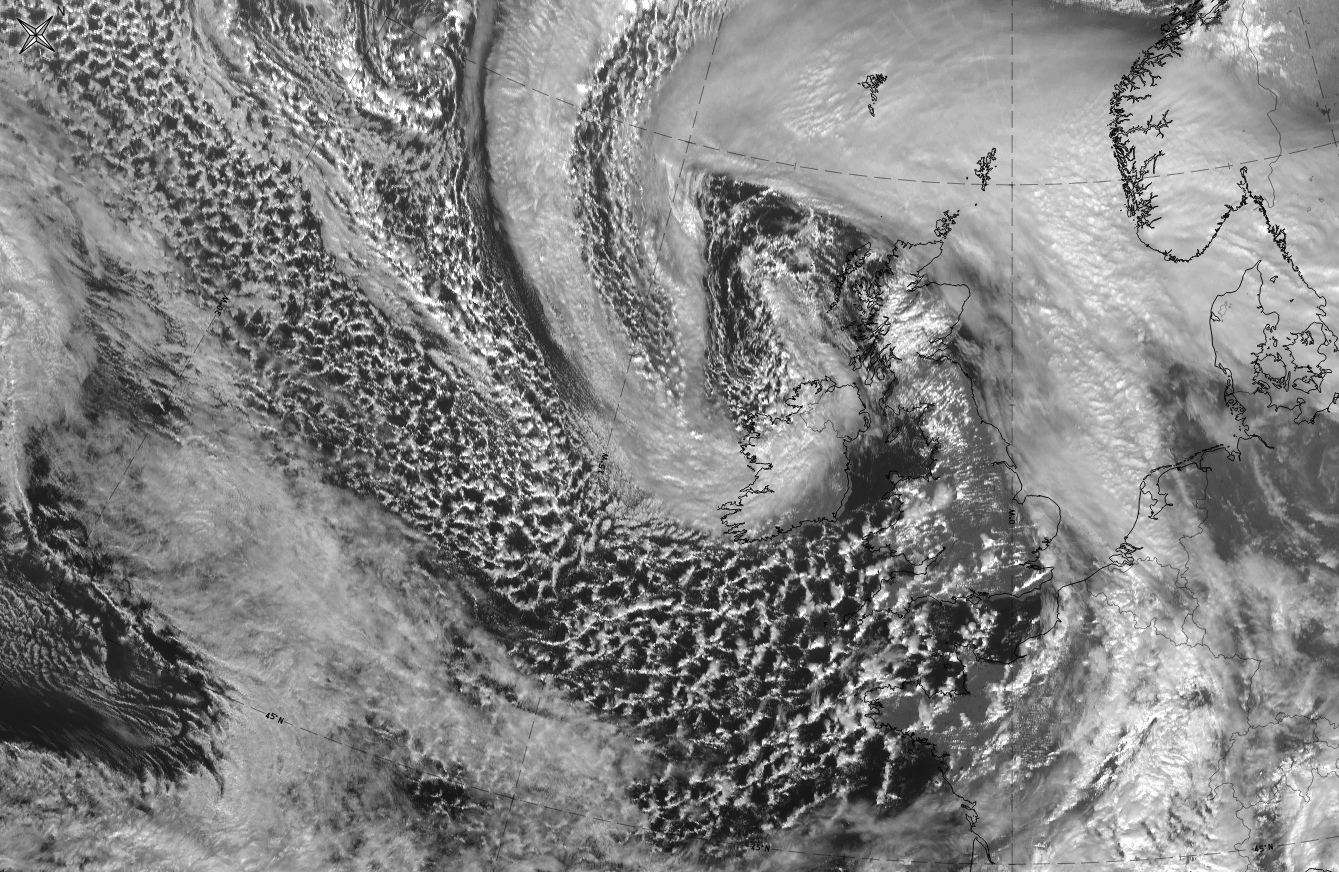
The example from 7 January 2020 at 12 UTC shows a large area of open cell convection in the north Atlantic extending from NW south of Greenland, southeast towards Ireland, as well as a smaller adjacent area to the southeast with closed cell convection.
|
|
|
|
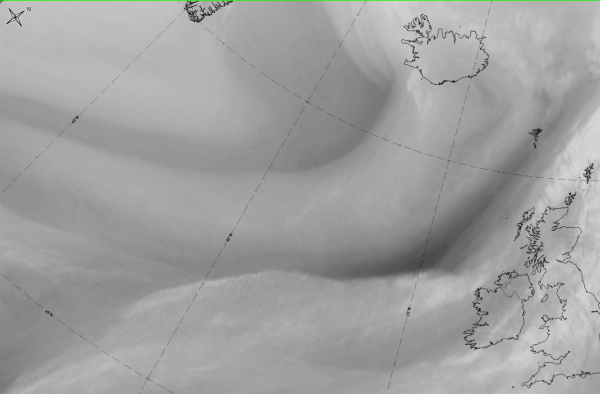
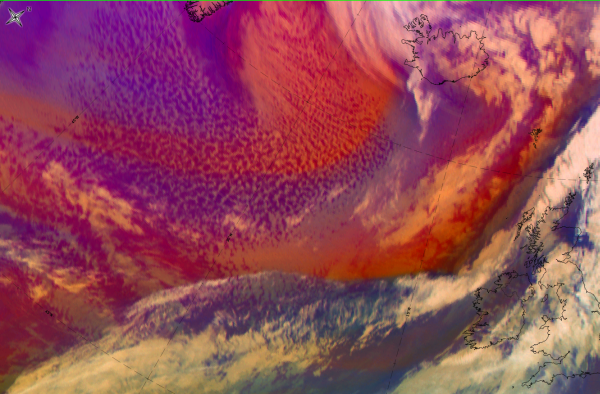
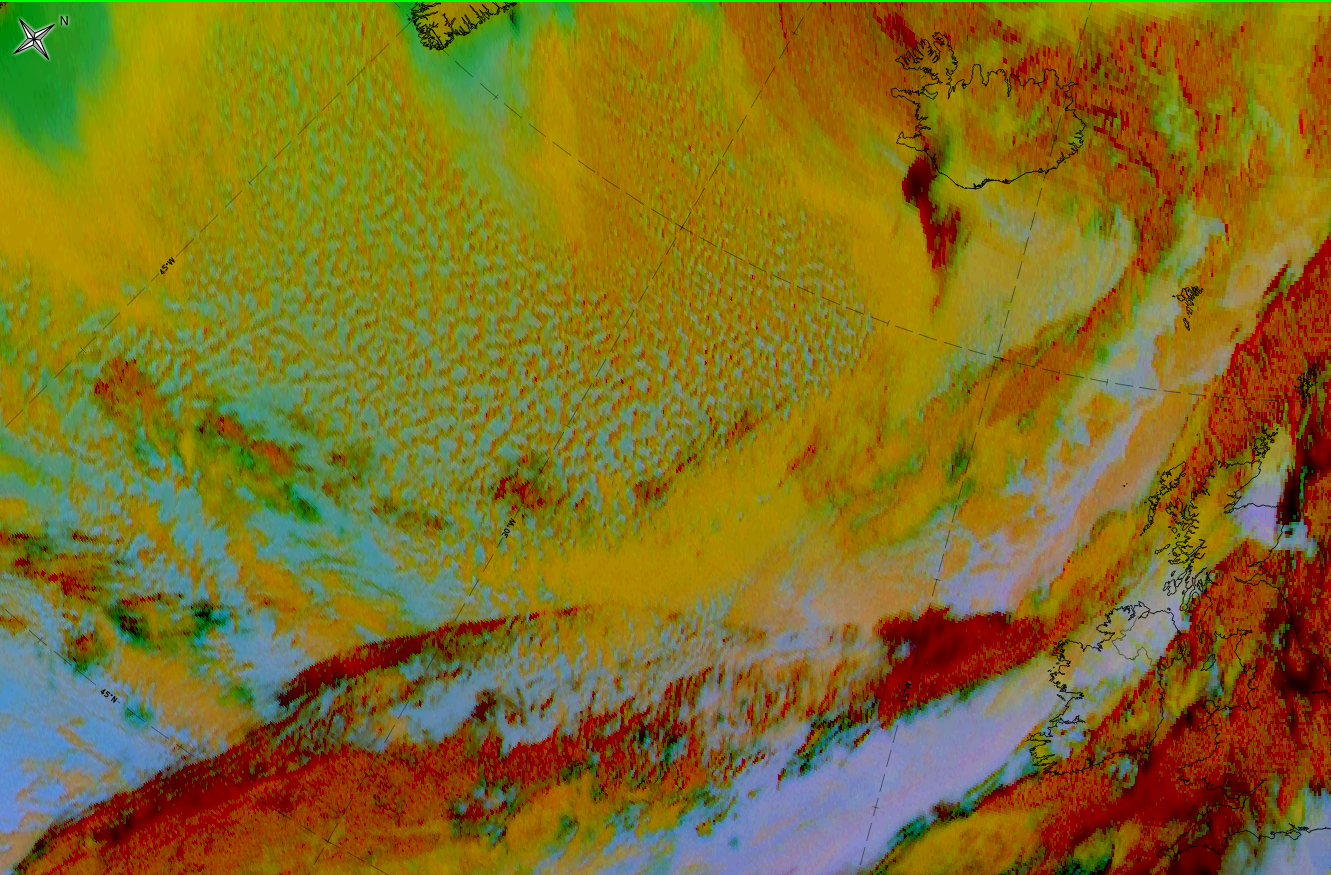
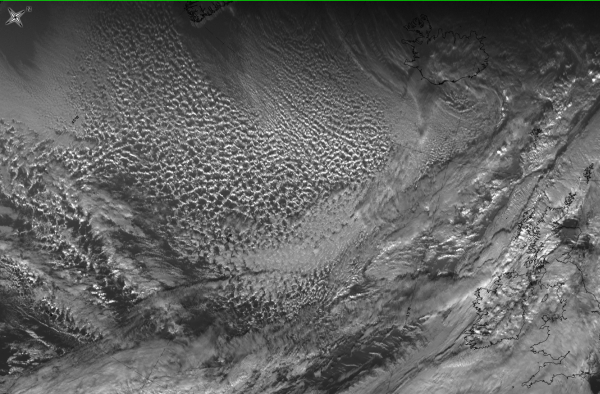
7 January 2020 at 12UTC: 1st row: IR (above) + HRV (below); 2nd row: WV (above) + Airmass RGB (below); 3rd row: Dust RGB + image gallery.
*Note: click on the Dust RGB image to access image gallery (navigate using arrows on keyboard).
| IR | A regular pattern of open cells with dark grey cloud boundaries; a dark grey area to the southeast indicating the closed cell convection. |
| HRV | A regular pattern of open and closed cell convection; light grey to white clouds. |
| WV | No regular pattern of open and closed cells is recognisable but streams of high upper level humidity and dry stripes exist. |
| Airmass RGB | Dark brown areas for cold and dry, blue areas for cold air streams comparable to WV; open and closed cells are recognisable under the dark-brown and blue colours. |
| Dust RGB | Ochre colours for closed and open cells for mid-level cloud; dark-red spots indicate thicker convection there. |
Meteorological Physical Background
Open Cell Convection and Closed Cell Convection are the result of processes involving air mass modification. Cold, dry and stable air is advected from a cold surface, e.g. an icecap or snow-covered land, over a warm water surface (an ocean, sea or lake). The cold air is advected in the rear flank of a mid-latitude cyclone. The water body supplies heat and moisture to the air by means of heating and evaporation. Due to this supply from below, the air mass becomes unstable and shallow convection occurs. The difference between air temperature and water temperature decreases with increasing distance from the source area. Also, the average potential temperature of the mixed layer increases and heat, moisture and momentum are mixed over an increasingly deeper layer. This causes a gradually increasing depth of the mixed layer, due to convective processes. The air mass in which the cellular convection occurs is characterized by quite a low inversion in the vertical stratification. That's why the convection is limited to a shallow layer.
Satellite images frequently show large areas of mesoscale cellular convection. These areas are predominantly observed over water surfaces. This mesoscale cellular convection is characterized by honeycomb-like patterns of shallow (generally 1-2 km but in some occasions larger) convective cloudiness, arranged in either 'open' or 'closed' cells. The former have cloudy borders and cloud free centers whereas the latter have cloud free borders and cloudy centers. Open and closed cells are part of a distinct lifecycle in Cold Air Outbreaks from continents or ice-surfaces over warmer sea surfaces. In this lifecycle cloudiness develops from Stratus/Sea-Fog via Cloud Streets into Open and Closed Cells.
Open and Closed Cells mostly occur over water surfaces, but Open Cells can also develop over land, when cold air is advected over a land surface heated by solar insolation. A favorable period for this is springtime. Open and Closed Cells can also be advected from sea onto land by the mean flow. Over land the cellular patterns are somewhat disturbed due to the increased surface friction over land.
Rayleigh-Bénard cells:
The organisation of clouds into a hexagonal pattern can be regarded as an atmospheric manifestation of Rayleigh-Bénard cells. These cells are
formed when convection occurs in a fluid which is confined between an upper and a lower boundary and is heated from below. The heating from
below causes convection in the fluid, and rising motions (in the manifestation of 'updraft plumes') will occur. When the rising fluid meets the
upper boundary it has to spread sideways. If this happens at an uniform speed, the boundary of the flow will have the shape of a circle. When
there are more spots with rising fluids, the boundaries will grow towards each other and where 2 boundaries meet the converging fluid is forced
to flow downwards. At the bottom of the layer the fluid has to flow sideways again and in this way the circulation is closed. The hexagonal
pattern as observed from above, is caused by the convergence of the sideward motions originating from many 'updraft plumes'. When the updraft
plumes are of uniform strength a regular hexagonal pattern will be visible.
In the case of Open and Closed Cellular Convection, the lower boundary is the sea or land surface and the upper boundary is an inversion (often a subsidence inversion). However, in the case of the theoretical Rayleigh-Bénard cells the only forcing factor is the temperature difference, in the atmosphere there are a number of extra factors and processes which influence the convective circulation. These factors and processes interfere with each other and resulting effects can be enhanced or dampened.
- One of these factors and processes is the large scale vertical motion in the boundary layer imposed by synoptic scale systems. When cellular convection occurs, the large scale vertical flow has a marked influence on the orientation of the circulation in the cells. Open cells will develop if the large-scale vertical motions in the fluid layer are downwards, closed cells will develop when the large-scale vertical motions are upwards. However the large-scale vertical motions are not strong enough to overcome the inversion at the top of the layer.
- Another important factor in the atmosphere is the release of latent heat due to condensation. Initially the convection is only thermally induced, but when condensation occurs latent heat release adds to the thermal forcing. In the development of a cold air outbreak condensation becomes quickly a factor of importance when clouds develop such as sea-fog, stratus or convective clouds.
- Closed Cells have a larger cloud deck and therefore cloud radiative processes and entrainment are also factors which influence the direction of the circulation in the cells.
Synoptic Environment and Characteristics
In the following paragraphs the typical synoptic environment and other characteristics will be discussed.
Open Cellular Convection
Open Cellular Convection is mostly seen in cold air outbreaks, when cold and dry air from continents is transported over a relatively warm
(water) surface. This flow often occurs behind a Cold Front (see
Cold Front
). The air mass is modified by the input of heat and moisture from the water surface. Near the water surface a mixed layer will be formed,
which is capped by an inversion. This inversion stems from the period that the air resided in its source area. The depth of the mixed layer
will increase with increasing distance from shore due to the continuing input of heat and moisture from the water surface. Clouds develop
during the transformation of the air mass. At first Sea-fog or Stratus clouds will occur. Further downstream they will develop into Cloud
Streets (see
Cloud Streets
) and eventually cellular convection will occur (Open and Closed Cells). The appearance of cellular convection can be considered as the mature
stage of the air mass transformation. In this stage the mixed layer has reached its final depth and is not deepening anymore with increasing
distance from the original source area.
Cellular convection is confined to a shallow layer, and dynamical forcing is not a factor. However, when dynamical forcing (e.g. PVA near
upper-troughs) occurs in a cold air outbreak, the convection will be enhanced and EC (see
Enhanced Cumulus
) and Comma (see
Comma
) will form.
Open cells tend to develop in a cyclonic flow at the rear side of a mature cyclone, while closed cells preferably exist in an anti cyclonic
flow with subsidence in the lower troposphere (see scheme below).
Whether Open or Closed cells form chiefly depends on the intensity of cold air, and the boundary between areas of Open and Closed cells is said
to coincide with the strong wind axis of the upper level (Images in Weather Forecasting M. J. Bader )
|
|
11 March 2006/12.00 UTC - Meteosat 8 IR image; blue: isobars
|
|
|
As was mentioned in the subchapter Cloud Structure In Satellite Images, the centers of Open Cells are cloud free and the borders are cloudy. This is an indication for the circulation in the cells, which indeed consists of rising motions at the borders and sinking motions in the centers. The rising motions lead to the formation of convective clouds at the borders.
|
Scheme of vertical circulation and cloudiness in Open Cell Convection
|
|
|
These clouds are relatively shallow (cloud top at 2-3 km), but they are capable of producing precipitation. The highest cloud tops are often situated at the vertices of the hexagons, because at the vertices there is extra convergence in the circulation in the convective cell. Open cells occur in a cold air outbreak and are driven by heating from below (from the relatively warm sea water). This means that the driving process is the same as in classic Bénard convection, however there are some additional factors. These factors are responsible for the different type of circulation in Open Cell Convection and a different vertical scaling of the convection cells compared to the classical B?ard convection. The large scale vertical motion in cold air outbreaks is generally downwards. As mentioned before, downward vertical motions lead to an open cell structure in a fluid heated from below.
|
11 March 2006/12.00 UTC - Meteosat 8 HRVIS image
|
11 March 2006/12.00 UTC - Tephigram Ekofisk
|
|
|
In the tephigram it can be seen that the lowest 3 km (about 1000-700 hPa) have unstable stratification. This unstable layer is capped by a weak inversion. The winds back with height in the unstable layer, which is an indication for Cold Air Advection. The wind speed increases only slightly with height.
| Height (hPa) | Winddirection (Deg) | Windspeed (kt) |
|---|---|---|
| 1007 | 010 | 17 |
| 1000 | 015 | 17 |
| 925 | 020 | 23 |
| 850 | 350 | 25 |
| 772 | 295 | 23 |
| 700 | 295 | 23 |
Closed Cellular Convection
Closed Cellular Convection can occur in two different situations: in the aforementioned cold air outbreaks and in a subtropical anticyclone. The first case is a somewhat mature or final stage in the developments in a cold air outbreak. The closed cells are often situated a very far downstream and immediately in the rear of a Cold Front (see Cold Front ) or near the anticyclone which flanks the cold air outbreak to the west. The second case is a typical marine stratocumulus situation, within a subtropical anticyclone and often also situated over relatively cool ocean currents. In both situations there is a well mixed and moist shallow boundary layer situated underneath quite a strong subsidence inversion. The subsidence inversion functions as a strong cap for convection by hindering the vertical growth of the clouds and forcing them to spread out horizontally
|
Scheme of vertical circulation and cloudiness in Closed Cell Convection
|
|
|
The circulation in Closed Cells is the opposite of that in Open Cells: in Closed Cells the air rises in the centres and sinks at the borders. The rising motions in Closed Cells are therefore less intense than those in Open Cells and hence the cloudiness in closed cells is vertically less developed. The clouds are shallower than those in Open Cell Convection, and due to their shallow depth and their relatively large area in the cells they look more like stratocumulus than like the convective clouds observed in Open Cellular Convection. The borders are cloud free. It is considered that radiative cooling of the cloud tops is the key responsible process in Closed Cellular Convection. This means that while the circulation of the cells is the same as in classical Bénard cells, the driving mechanism is different. The cooling of the cloud tops causes instability and sinking motions in the cloud layer, while entrainment of dry air from above the inversion and subsequent evaporative cooling also contributes to the generation of downward flows.
|
18 July 2005/12.00 UTC - Meteosat 8 HRVIS image
|
18 July 2005/12.00 UTC - Tephigram Valentia, SW Ireland
|
|
|
The tephigram of Valentia shows the vertical stratification in a region of Closed Cell Convection. There is a saturated layer of about 650 m depth directly underneath the inversion at 800 hPa, indicating a cloud layer. The wind is veering slightly with height, which is an indication for Warm Air Advection, while the wind speed is nearly constant. Above the inversion the wind is backing with height. At the inversion wind speed decreases, but above the inversion it increases again.
| Height (hPa) | Winddirection (Deg) | Windspeed (kt) |
|---|---|---|
| 1028 | 060 | 12 |
| 1000 | 065 | 25 |
| 925 | 080 | 25 |
| 850 | 075 | 35 |
| 700 | 065 | 45 |
The change from Open Cell Convection into Closed Cell Convection is not clearly understood yet. Possible factors which could play a role are: the temperature difference between sea and air, the strength of the inversion, large-scale vertical motions in the boundary layer and forces/processing governing them, and cloud deck processes (radiative cooling, entrainment). It's an interplay between the instability in the mixed layer, the strength of the inversion and vertical motions in the mixed layer. When the upward motions (either purely convective or induced by large scale vertical motions) are not strong enough to overcome (or penetrate into) the inversion layer, the flow will spread horizontally just under the inversion. Accompanying cloudiness will then spread also and cloudiness will increase. Due to the increased cloudiness, which grows into a deck under the inversion, cloud deck processes will become more important. Eventually this can lead to a change in the driving mechanism of the cellular convection and hence the change from Open into Closed Cells. Mostly the transition between cell types is quite abrupt, which infers that there is some kind of 'switch mechanism' (in the forcings) governing the direction of the circulation.
Key Parameters
- Temperature Advection
Closed, but especially Open Cell convection often happen in Cold Air Outbreaks at the rear side of a Cold Front. Obviously cold advection occurs in these Cold Air Outbreaks. Closed Cells are also to be found in areas without significant Temperature Advection. - Vertical Velocity
In the aforementioned cold air outbreaks the vertical motion in the mid troposphere is downward, due to the cold advection. However in the lowest layer of the troposphere upward motion is prevailing due to instability. - Relative Humidity 850/700 hPa
There is often a marked difference in the Relative Humidity between these two levels due to the (capping) inversion. Beneath the inversion, where Open and Closed Cell convection occur, the Relative Humidity is quite high. Above the inversion the Relative Humidity is low, due to subsidence. The inversion is very often situated between 850 and 700 hPa, and the difference in Relative Humidity between these two layers is very clear. The inversion height can also be determined more exactly by using radiosonde data. The inversion is generally lower in Closed Cell Convection than in open Cell Convection. Often the inversion height is around the 850 hPa level for Closed Cells and well above this level for Open Cells. - 1000 hpa height.
The transition zone between open en closed cells is to be found in the change of the curvation in the surface pressure fields from cyclonic towards anti cyclonic, where Open Cells are situated in a cyclonic environment and Closed Cells in an anti cyclonic surrounding. - Jet streak 300 hPa.
On the cold side of the Jet streak open cells can be found while on the warm side closed cells are situated.
Temperature advection (TA)
|
|
23 September 2005/06.00 UTC - Meteosat IR image; red solid: temperature advection - WA, red dashed: temperature advection - CA
|
|

|
Isotachs at 300 hPa
|
|
04 November 2009/09.00 UTC - Meteosat IR10.8 image; yellow: isotachs 300 hPa, black: zero line of shear vorticity 300 hPa
|
|
|
Vertical velocity
|
|
23 September 2005/06.00 UTC - Meteosat IR image; yellow solid: vertical motion (Omega) - upward motion, yellow dashed: vertical
motion (Omega) - downward motion
|
|
|
Relative humidity 850/700 hPa
|
|
23 September 2005/06.00 UTC - Meteosat IR image; blue: solid: Relative Humidity >= 70% at 850 hPa, blue dashed: Relative
Humidity < 70% at 850 hPa
|
|
|
|
|
23 September 2005/06.00 UTC - Meteosat IR image; blue: solid: Relative Humidity >= 70% at 700 hPa, blue dashed: Relative
Humidity < 70% at 700 hPa
|
|
|
|
|
04 November 2009/09.00 UTC - Meteosat HRVIS image; blue: isobars
|
|
|
Typical Appearance In Vertical Cross Sections
Open and Closed Cells are mesoscale boundary layer phenomena. This means that unlike most of the other conceptual models, governing processes and dynamics of Open and Closed Cells are confined to the boundary layer. By absence of processes at the synoptic scale governing the dynamics of Open and Closed Cells, vertical cross sections are in this case more a means of identifying the synoptical environment than a means to have insight in the processes in Open and Closed Cell convection.
- Potential Wet Bulb Temperature (Theta-w)
The typical instability can be easily detected in the isentropes. In the lowest levels the potential wet bulb temperature decreases with height, indicating unstable stratification. Around a mean level of 800 hPa, 2 km, wet bulb potential temperature starts to rise again, indicating a change to a stable stratification or inversion. In Open Cell Convection this level is higher than in Closed Cell Convection. - Potential Temperature (Theta)
In the vertical distribution of theta inversions in the lower layers can be detected very easily. Under the inversion potential temperature is (nearly) constant with increasing height, at the inversion potential temperature increases dramatically with height. - Temperature advection
Open and Closed Cell Convection usually occur in an outbreak of cold air, behind cold fronts in areas of cold advection. - Vertical velocity
Open and Closed Cell Convection usually occur in areas with large-scale downward vertical motions, due to cold air advection and NVA. However low level convergence (induced by geography/orography) and the resultant upward velocity may 'trigger' Closed Cell Convection. - Relative Humidity
In the vertical distribution of Relative Humidity the humid layers associated with cloudiness can be seen. An dramatic decrease in Relative Humidity is seen above the cloud layers, this decrease is due to the inversion. The moist air is trapped underneath is and above the inversion the air is dry due to subsidence.
|
04 November 2009/06.00 UTC - Meteosat 9 HRVIS image; position of vertical cross section indicated
|
|
|
Potential Web bulb temperature
|
|
04 November 2009/06.00 UTC - Vertical cross section; black: isentropes (ThetaE)
|
|
|
Temperature advection (TA)
|
|
04 November 2009/06.00 UTC - Vertical cross section; red: temperature advection, black: isentropes (ThetaE)
|
|
|
Vertical velocity
|
|
04 November 2009/06.00 UTC - Vertical cross section; blue: vertical motion - Omega, black: isentropes (ThetaE)
|
|
|
Relative humidity
|
|
04 November 2009/06.00 UTC - Vertical cross section; blue: relative humidity, black: isentropes (ThetaE)
|
|
|
Weather Events
| Parameter | Description - Open Cells | Description - Closed Cells |
| Precipitation |
|
|
| Temperature |
|
|
| Wind (incl. gusts) |
|
|
| Other relevant information |
|
|
For demonstrating the weather situation two examples are shown: one for open cellular convection and one for closed cellular convection.
 |
 |
Legend:
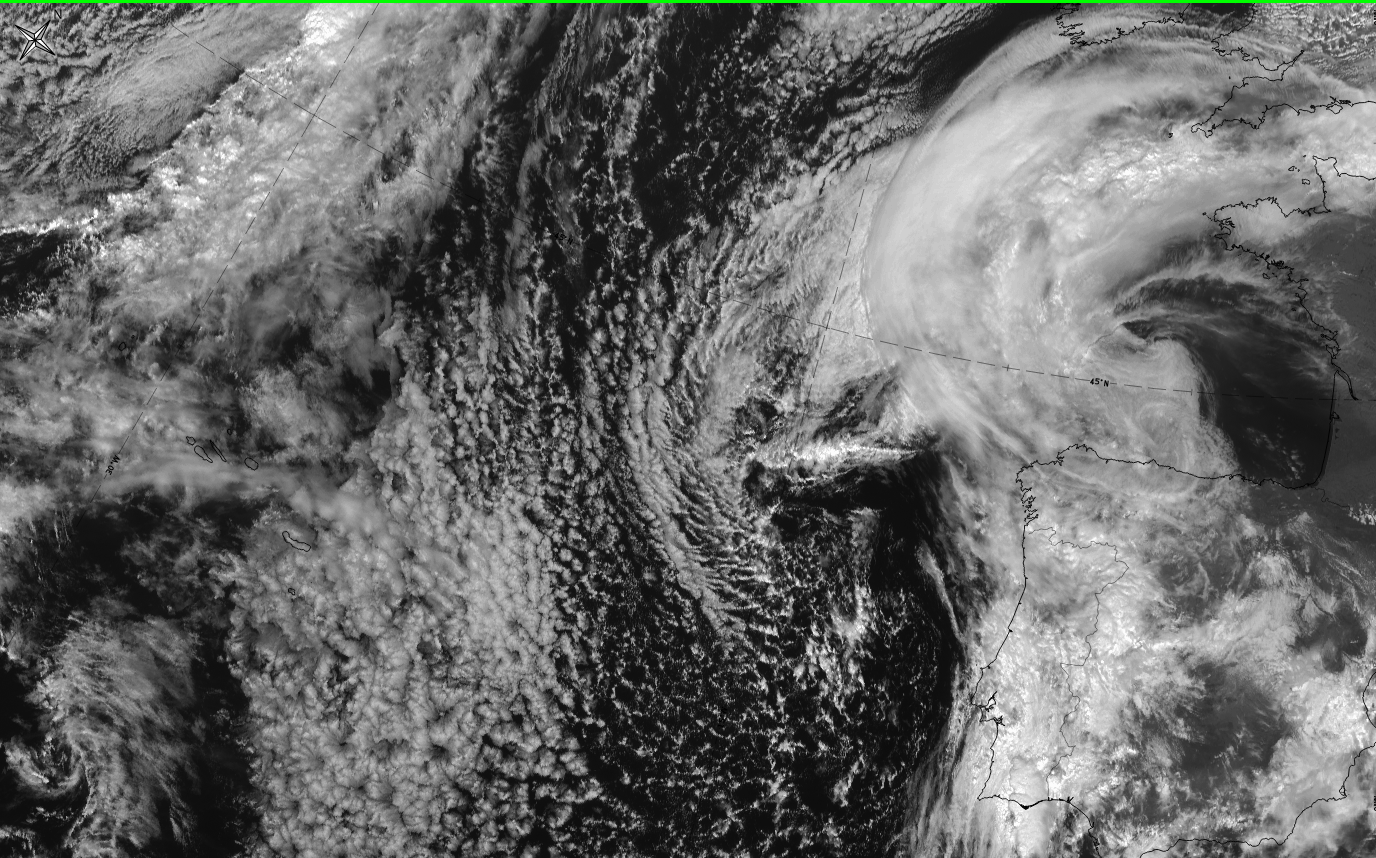
Left: 29 February 2020 at 12 UTC. HRV: open cell convection, Right:20 March 2020 at 12 UTC. HRV: closed cell convection
On 29 February 2020 at 12 UTC a large area of regularly arranged open cells extends from the NW Atlantic to Brittany, France and to SW England where the cells become larger.
|
|
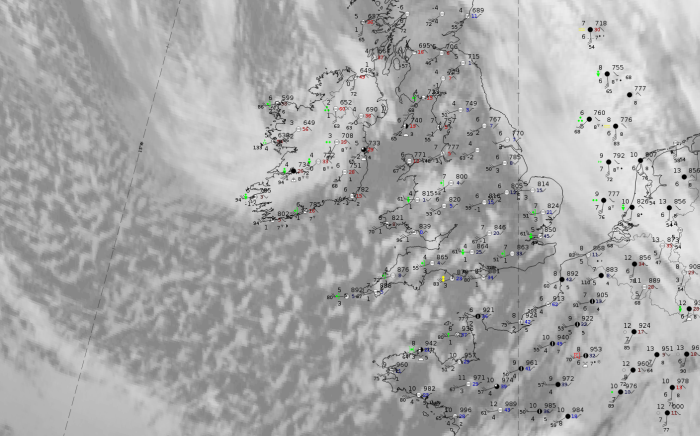
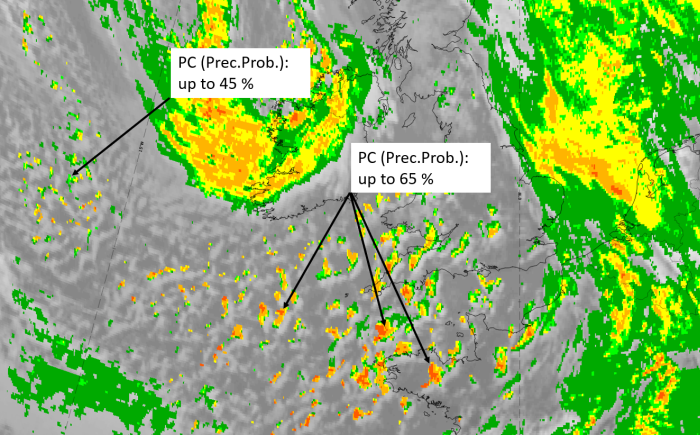
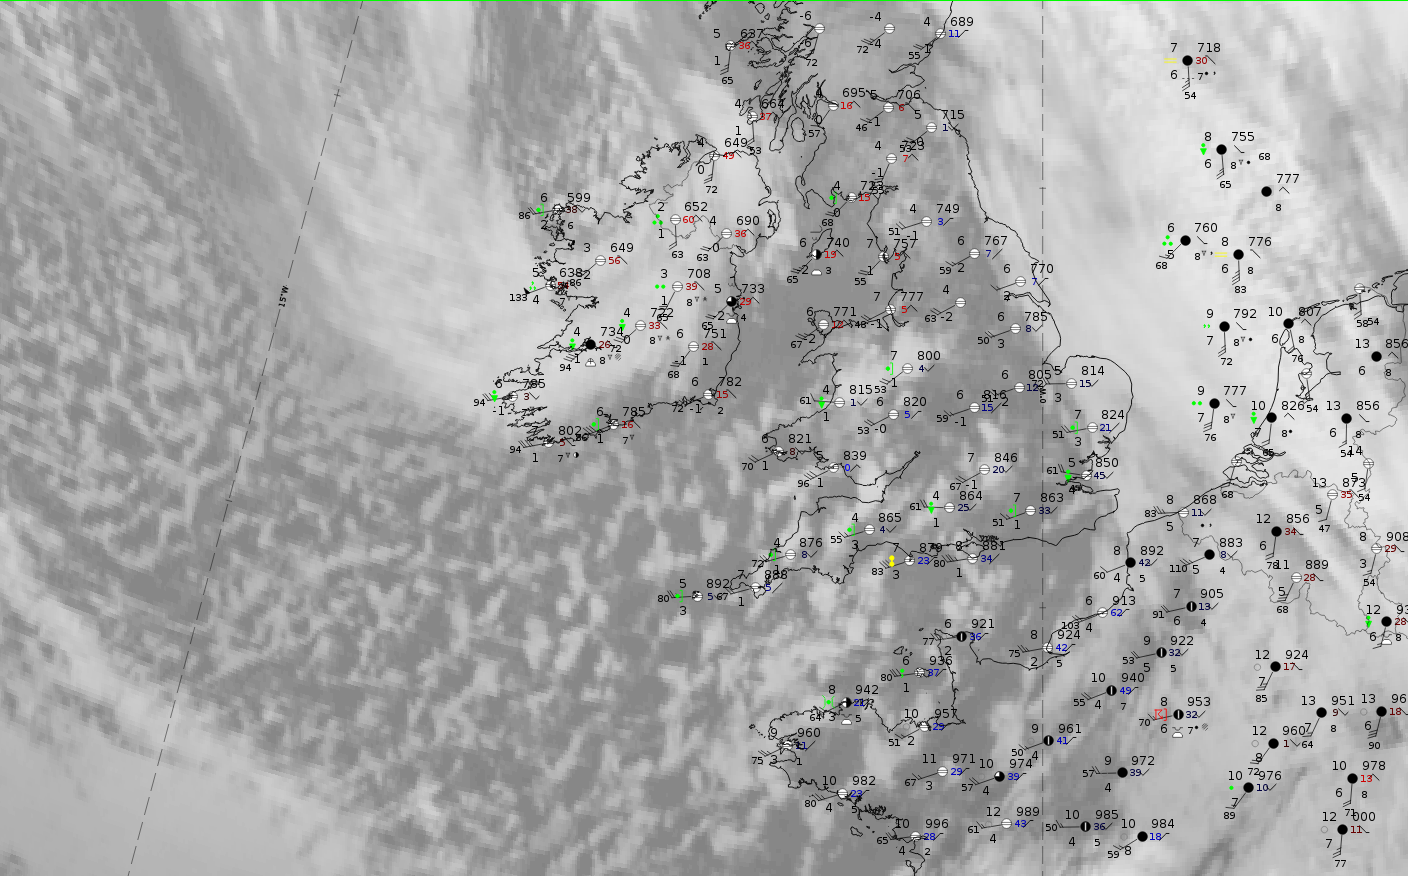
Legend: 29 February 2020 at 12UTC: IR + synoptic measurements (above) + probability of moderate rain (Precipitting clouds PC - NWCSAF).
Note: for a larger SYNOP image click this link.
Land-based station reports at the eastern boundary of the open cell convection over land include showers with low-intensity rain. The precipitation probability of 65% there is rather high but decreases more to the west, over the Atlantic.
|
|
|
|
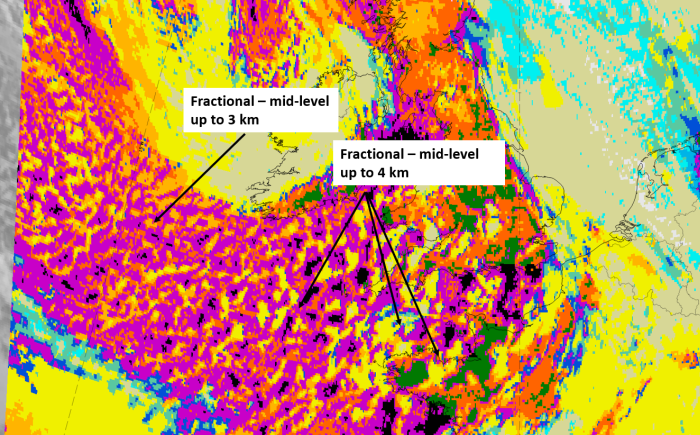
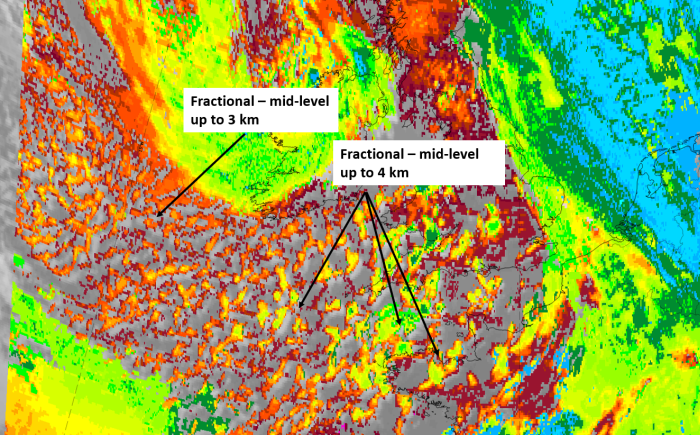
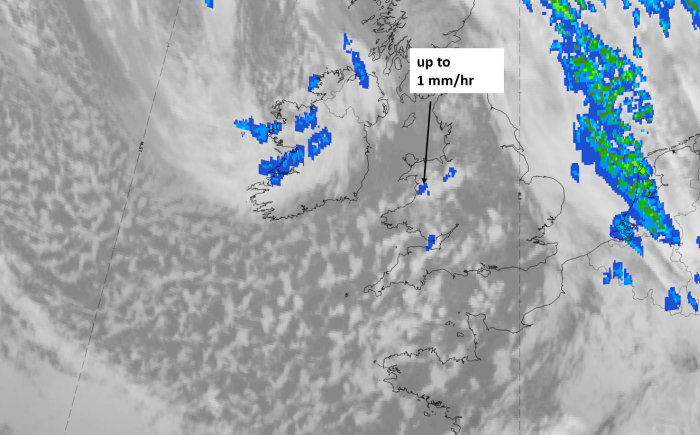
Legend:
29 February 2020 at 12 UTC, IR; superimposed:
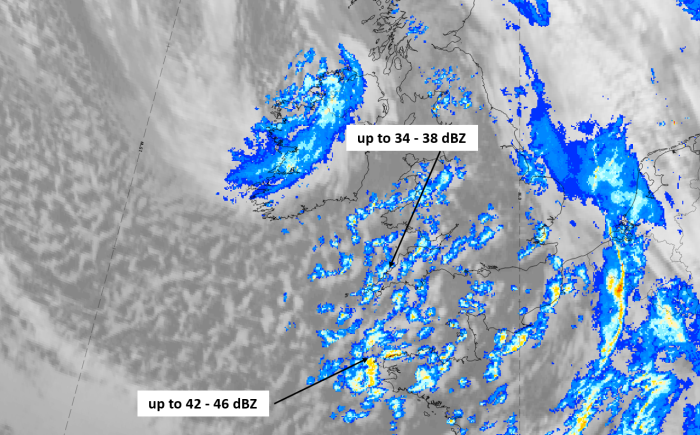
1st row: Cloud Type (CT NWCSAF) (above) + Cloud Top Height (CTTH - NWCSAF) (below); 2nd row: Convective Rainfall Rate (CRR NWCSAF) (above) + Radar intensities from Opera radar system (below).
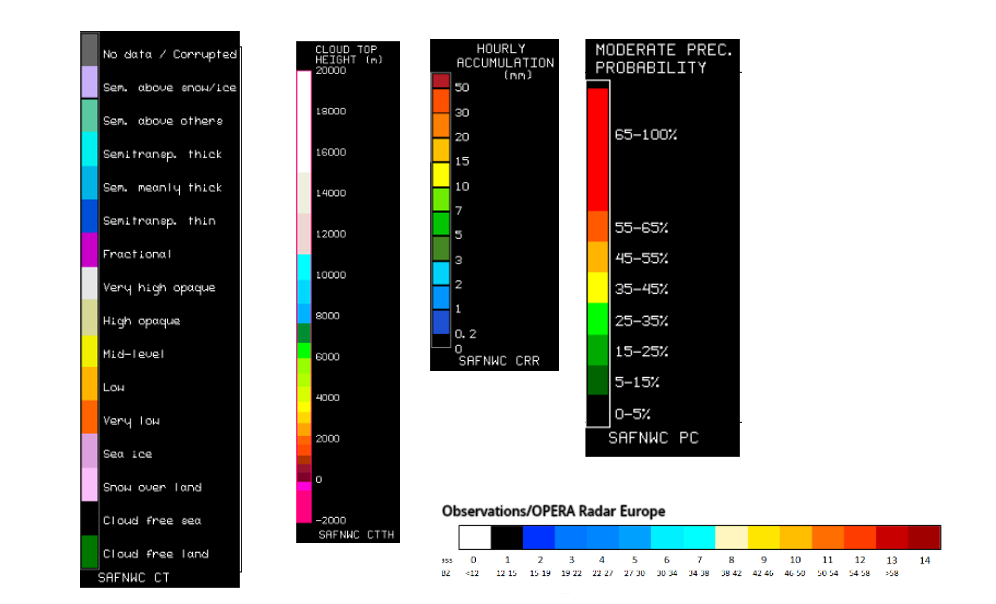
For identifying values for Cloud type (CT), Cloud type height (CTTH), precipitating clouds (PC), and Opera radar for any pixel in the images look into the legends. (link).
On 20 March 2020 at 12 UTC a large area of regularly arranged open cells extends from the Azores to Madeira.
 |
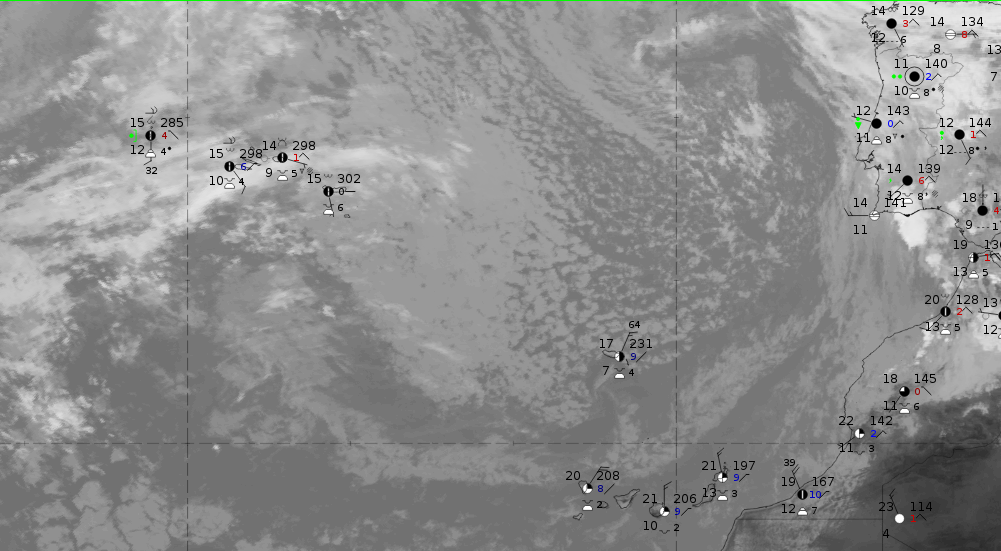 |
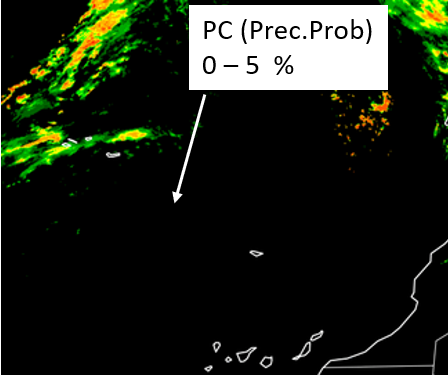
Legend: 20 March 2020 at 12UTC: l: IR + synoptic measurements; r: probability of moderate rain (Precipitating clouds PC - NWCSAF)
Station reports from Madeira and the Azores show high cloud cover values but no rain nor any showers. The precipitation probabilities are less than 5 %.
 |
 |
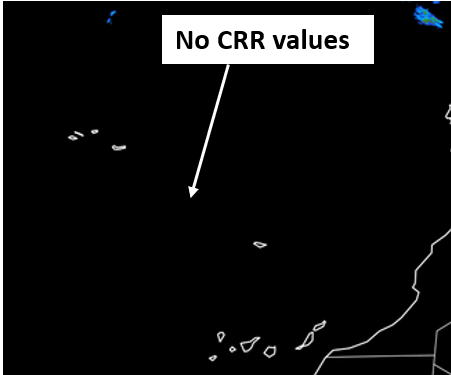 |
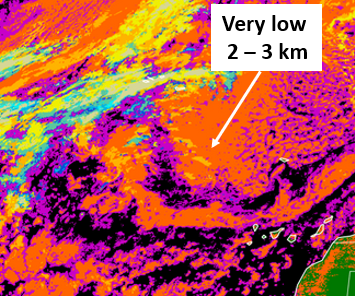
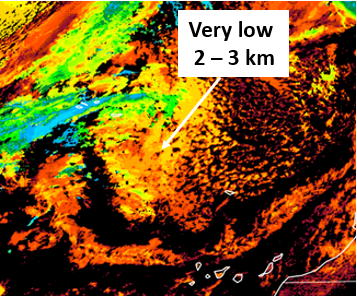
Legend:
20 March 2020 at 12 UTC, IR; images from NWCSAF SAF archive: u.l.: Cloud Type (CT NWCSAF); u.r. Cloud Top Height (CTTH - NWCSAF); l.l.: Convective Rainfall Rate (CRR NWCSAF); l.r. Radar intensities from Opera radar system
For identifying values for Cloud type (CT), Cloud type height (CTTH), precipitating clouds (PC), and Opera radar for any pixel in the images look into the legends. (link).
References
- AGEE, E.M, and LOMAX, F. (1978): Structure of the mixed layer and inversion layer associated with patterns of mesoscale cellular convection during AMTEX 75, J. Atmos. Sci., 35, 2281-2301.
- AGEE, E.M (2006): An explanation of actiniae cloud patterns (extended abstract), 14th Conference on Interaction of the Sea and Atmosphere, Atlanta, GA, Amer. Meteor. Soc.,
- ATKINSON, B.W. and ZHANG, J.W. (1996): Mesoscale shallow convection in the atmosphere, Reviews of Geophysics, 34, 403-431.
- BADER, M.J. (1995): Images in weather forecasting, Beitr.Phys.Atmos., 61, 169-186
- VAN DELDEN, A. (1998): On the flow-pattern of shallow atmospheric convection, Beitr.Phys.Atmos., 61, 169-186
- DE JONG, M. P. C. and BATTJES, J. A. (2004): Low-frequency sea waves generated by atmospheric convection cells, J. Geophys. Res., 109, C01011
- HELFAND, H. M., and KALNAY, E. (1983): A model to determine open or closed cellular convection., J. Atmos. Sci., 40, 631-650.
- KRISTOVICH, D.A.R., LAIRD, N.F., HJELMFELT, M.R., DERICKSON, R.G. and COOPER K. (1999): Transitions in boundary layer meso-γ convective structures: An observational case study, Mon. Wea. Rev., 127, 2895-1909.
- KHANNA, S. and BRASSEUR, J.G. (1998): Three-Dimensional Buoyancy- and Shear-Induced Local Structure of the Atmospheric Boundary Layer, J. Atmos. Sci, 55, 710-743.
- KRISHNAMURTI, R. (1975): On Cellular Cloud Patterns. Part 1: Mathematical Model, J. Atmos. Sci, 32, 1353-1363
- KRISHNAMURTI, R. (1975): On Cellular Cloud Patterns. Part 2: Laboratory Model, J. Atmos. Sci, 32, 1364-1372
- KRISHNAMURTI, R. (1975): On Cellular Cloud Patterns. Part 3: Applicability of the Mathematical and Laboratory Models, J. Atmos. Sci, 32, 1373-1383
- KRUEGER, A. F. and FRITZ, S. (1961): Cellular cloud patterns revealed by TIROS I,. Tellus, 13, 1-7.
- KRUSPE, G., and BAKAN, S. (1990): The atmospheric structure during episodes of open cellular convection observed in KonTur 1981, J. Geophys. Res., 95, D2, 1973-1984
- LIU. A. Q., MOORE, G. W. K., TSUBOKI, K., and RENFREW, I. A. (2004): A high-resolution simulation of convective roll clouds during a cold-air outbreak, Geophysical Research Letters, 31, L03101.
- SHAO, Q., and RANDALL, D. A. (1996): Closed Mesoscale Cellular Convection Driven by Cloud-Top Cooling. Journal of the Atmospheric Sciences, 53, 2144-2165
- STEVENS B. et al. (2005): Pockets of open cells (POCS) and drizzle in marine stratocumulus, Bull. Amer. Metor. Soc., 86, 51-57
- WECKWERTH, T. M., WILSON, J. W., WAKIMOTO, R. M., and N. A. CROOK (1997): Horizontal convective rolls: Determining the environmental conditions supporting their existence and characteristics, Mon. Wea. Rev., 125, 505-526.