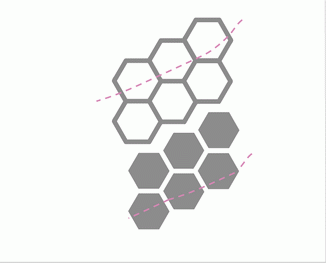
Key Parameters
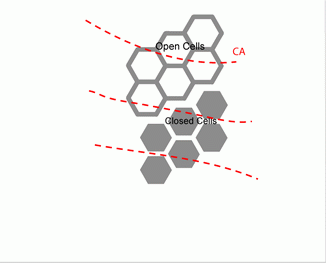
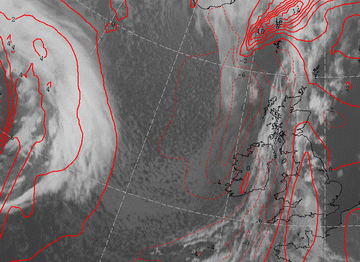
- Temperature Advection
Closed, but especially Open Cell convection often happen in Cold Air Outbreaks at the rear side of a Cold Front. Obviously cold advection occurs in these Cold Air Outbreaks. Closed Cells are also to be found in areas without significant Temperature Advection. - Vertical Velocity
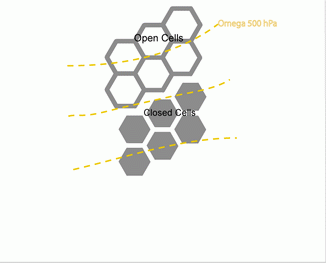
In the aforementioned cold air outbreaks the vertical motion in the mid troposphere is downward, due to the cold advection. However in the lowest layer of the troposphere upward motion is prevailing due to instability. - Relative Humidity 850/700 hPa
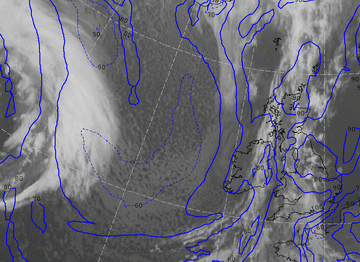
There is often a marked difference in the Relative Humidity between these two levels due to the (capping) inversion. Beneath the inversion, where Open and Closed Cell convection occur, the Relative Humidity is quite high. Above the inversion the Relative Humidity is low, due to subsidence. The inversion is very often situated between 850 and 700 hPa, and the difference in Relative Humidity between these two layers is very clear. The inversion height can also be determined more exactly by using radiosonde data. The inversion is generally lower in Closed Cell Convection than in open Cell Convection. Often the inversion height is around the 850 hPa level for Closed Cells and well above this level for Open Cells. - 1000 hpa height.
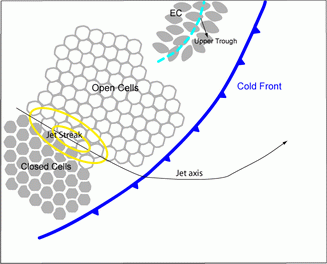
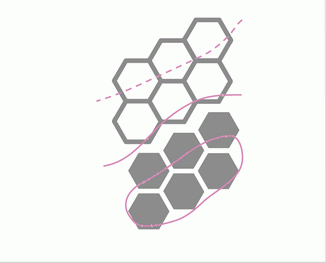
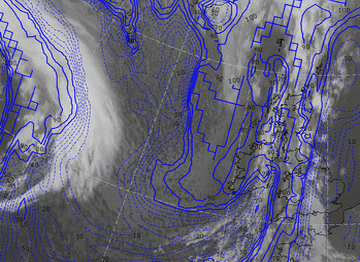
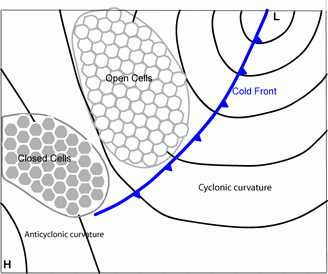
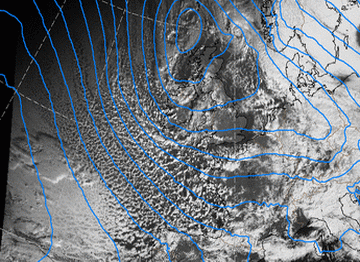
The transition zone between open en closed cells is to be found in the change of the curvation in the surface pressure fields from cyclonic towards anti cyclonic, where Open Cells are situated in a cyclonic environment and Closed Cells in an anti cyclonic surrounding. - Jet streak 300 hPa.
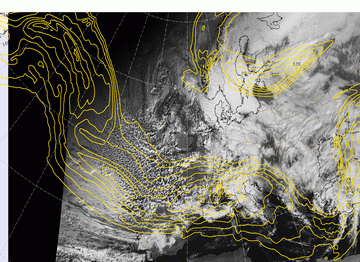
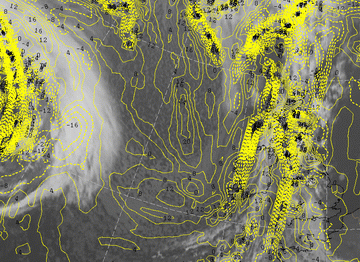
On the cold side of the Jet streak open cells can be found while on the warm side closed cells are situated.
Temperature advection (TA)
|
|
23 September 2005/06.00 UTC - Meteosat IR image; red solid: temperature advection - WA, red dashed: temperature advection - CA
|
Isotachs at 300 hPa
|
|
04 November 2009/09.00 UTC - Meteosat IR10.8 image; yellow: isotachs 300 hPa, black: zero line of shear vorticity 300 hPa
|
Vertical velocity
|
|
23 September 2005/06.00 UTC - Meteosat IR image; yellow solid: vertical motion (Omega) - upward motion, yellow dashed: vertical
motion (Omega) - downward motion
|
Relative humidity 850/700 hPa
|
|
23 September 2005/06.00 UTC - Meteosat IR image; blue: solid: Relative Humidity >= 70% at 850 hPa, blue dashed: Relative
Humidity < 70% at 850 hPa
|
|
|
23 September 2005/06.00 UTC - Meteosat IR image; blue: solid: Relative Humidity >= 70% at 700 hPa, blue dashed: Relative
Humidity < 70% at 700 hPa
|
|
|
04 November 2009/09.00 UTC - Meteosat HRVIS image; blue: isobars
|
