Weather Events
Since Jet Fibres are high altitude cirrus clouds, therefore no weather phenomena are expected on the ground are expected. However, since they appear along the jet axis in the region of maximum wind, therefore jet related phenomena such as turbulence can be expected in that region aloft.
Turbulence generally appears in the zone of high horizontal and vertical wind shear, around the jet streak. Turbulence occurs most frequently on the left-hand side below the level of the jet core, or on the right side above the level of the jet core. Furthermore, a sharply curving jet stream on the pole ward side of a Warm Front Shield, is associated with greater turbulence than compared with a straight jet stream behind the Cold Front. Jet fibres are often considered a good indication for clear-air turbulence (CAT) which may affect flights at high levels and is a major cause of discomfort and disruption to passengers on aircraft.
Associated with the Subtropical Jet Stream (STJ), but separate from it, areas of tropical CAT are observed. These may be identified by their high-cloud signature, cirrus ribbons.
| Parameter | Description |
| Precipitation |
|
| Temperature |
|
| Wind (incl. gusts) |
|
| Other relevant information |
|
For a demonstration of weather events the case of 24 May 2010 at 06 UTC is chosen.
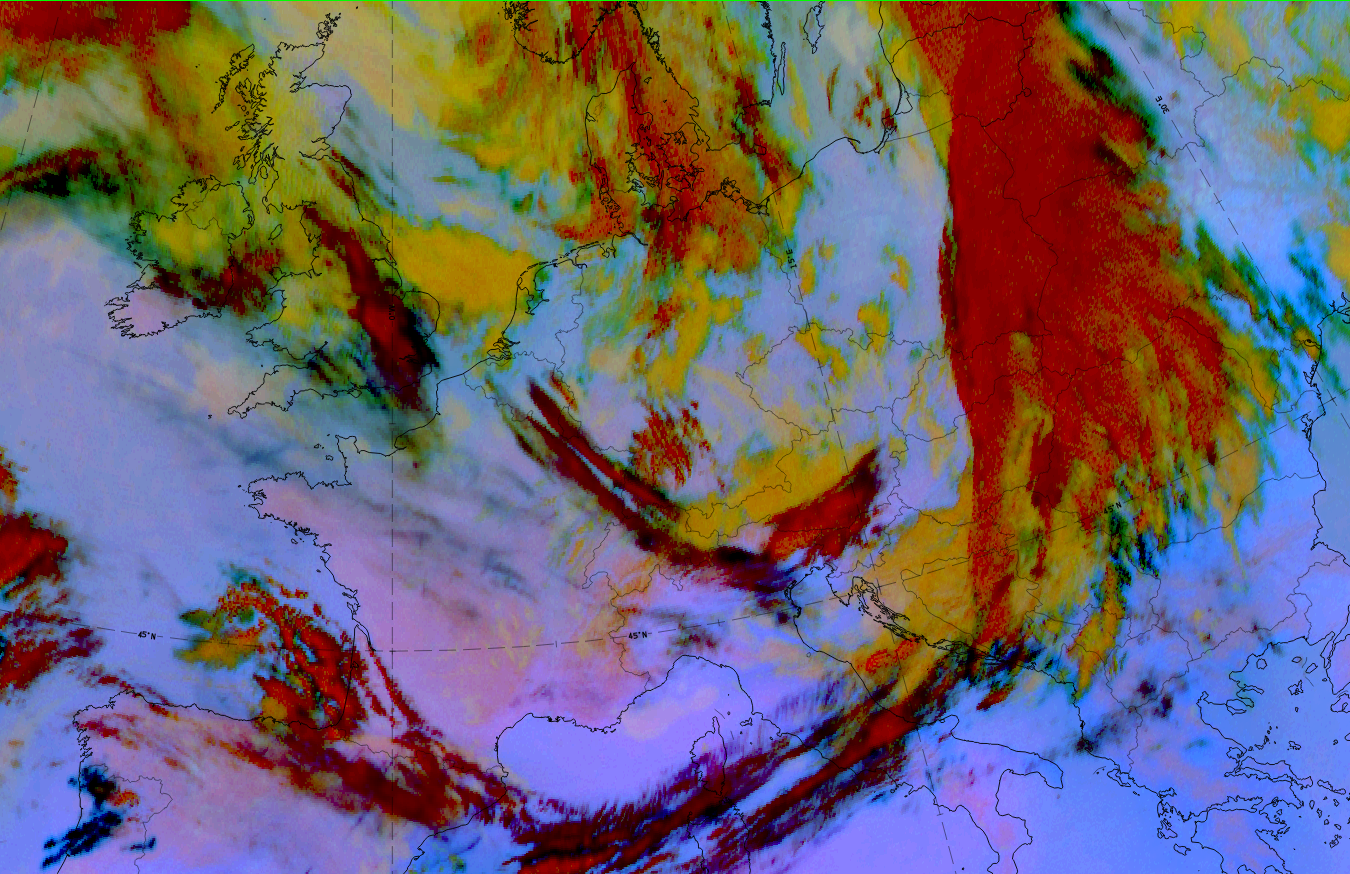
Legend: 14 May 2020 at 06 UTC; Dust RGB.
This case shows both types of jet fibres:
- At the leading side of a WF shield starting from Eastern Scotland and stretching downstream to Europe (France to Germany to Switzerland) where it changes the orientation from NW-SE to SW-NE;
- from that time onwards, it approaches the cold front and can be seen as black fibres along the wave bulge over Slovakia and Poland.
|
|
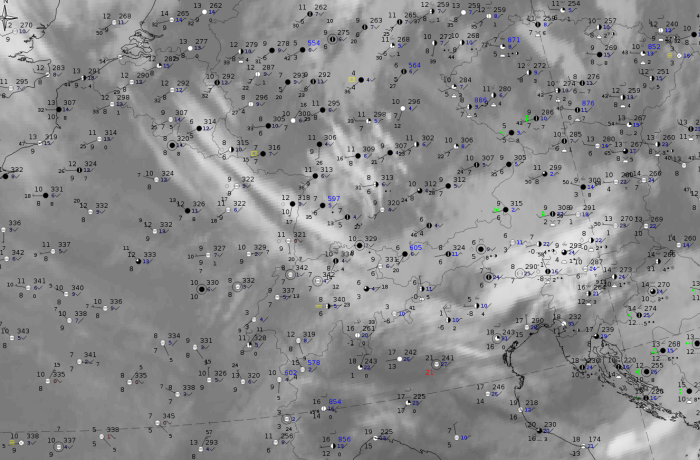
Note: for a larger SYNOP image click this link.
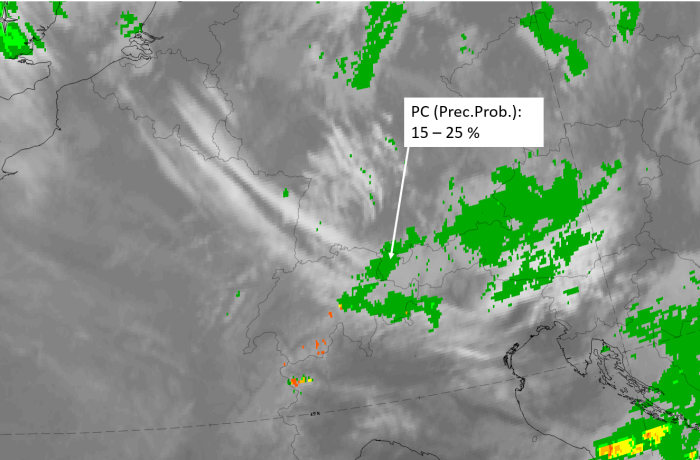
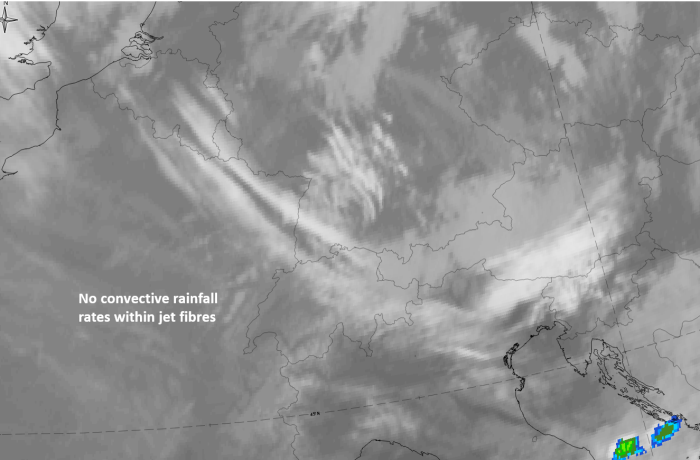
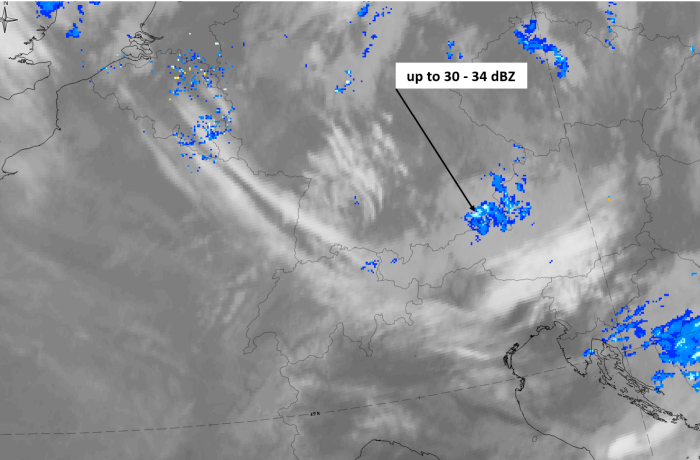
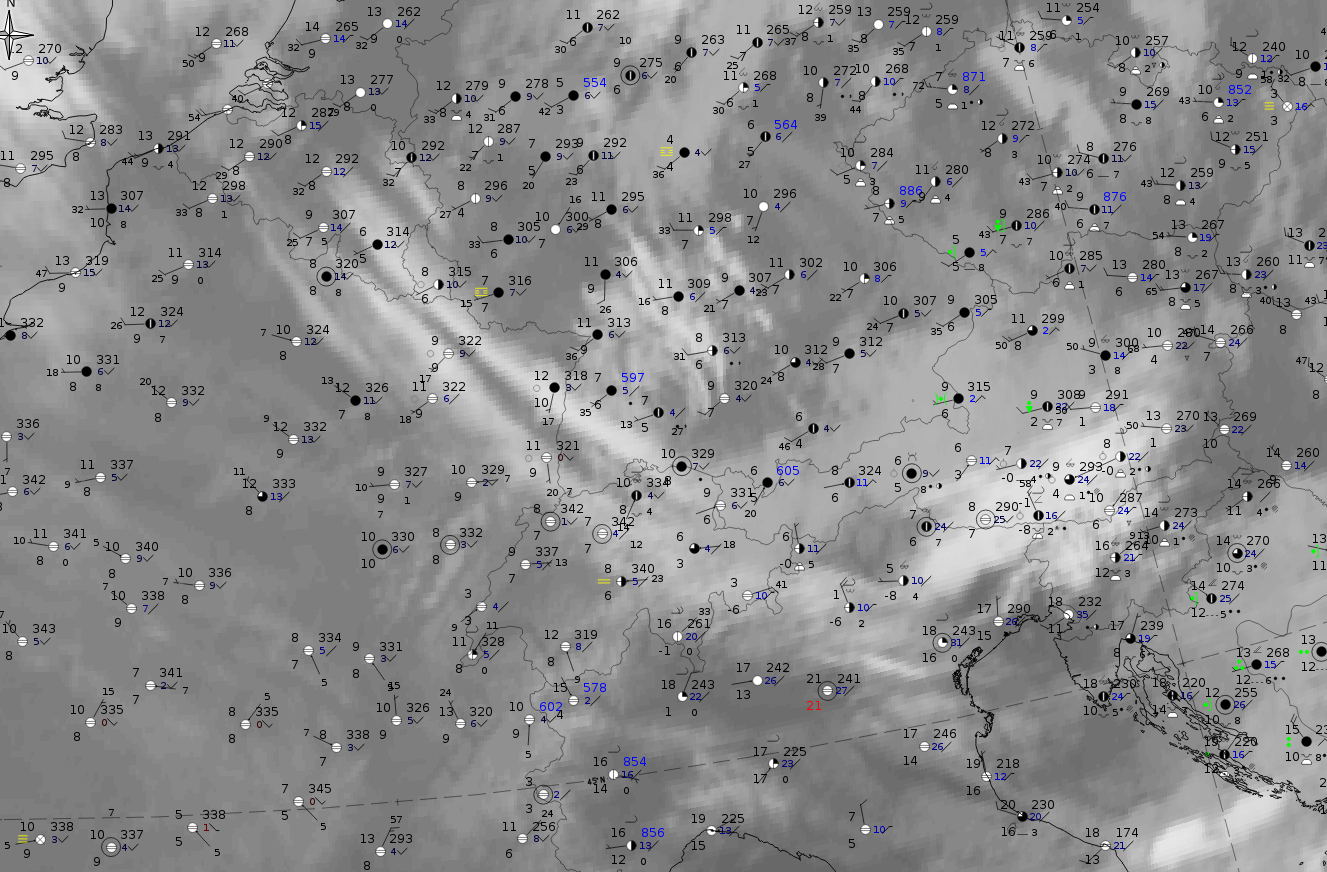
There is no precipitation report from stations below the jet fibres; mostly the conditions are overcast. The computation of precipitation probabilities from the NWCSAF are also very low. The same can be seen in the precipitation images (CRR and radar Opera) in the figure below.
|
|
|
|
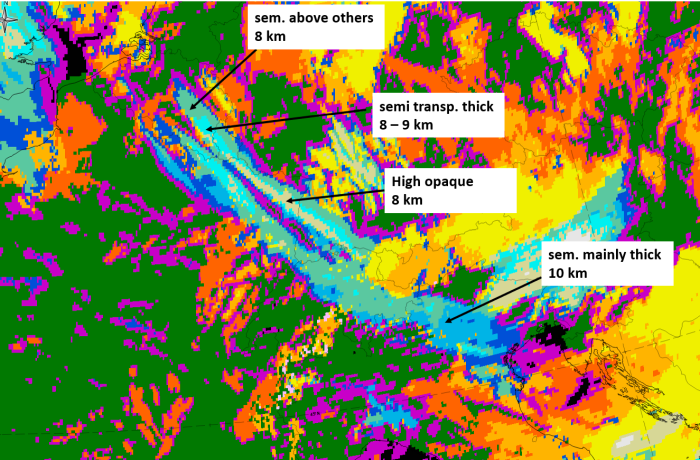
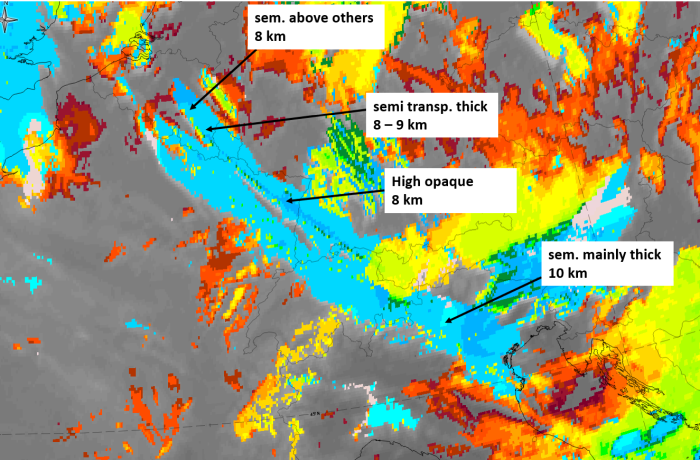
Legend:
24 May 2020 at 06 UTC, IR; superimposed:
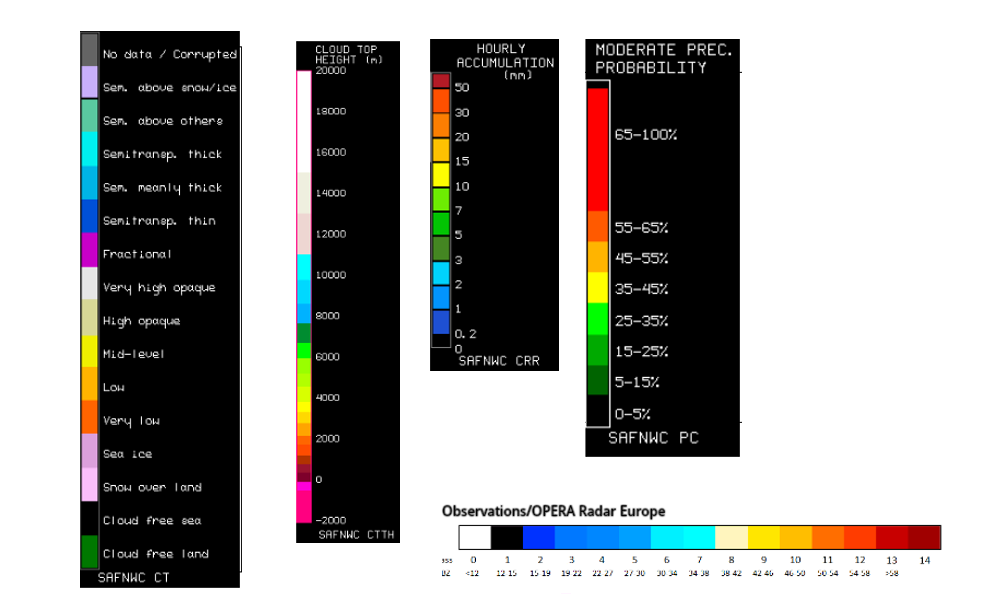
1st row: Cloud Type (CT NWCSAF) (above) + Cloud Top Height (CTTH - NWCSAF) (below); 2nd row: Convective Rainfall Rate (CRR NWCSAF) (above) + Radar intensities from Opera radar system (below).
For identifying values for Cloud type (CT), Cloud type height (CTTH), precipitating clouds (PC), and Opera radar for any pixel in the images look into the legends. (link).