Table of Contents
Cloud Structure In Satellite Images
Jet Fibres are long and narrow stripes of high, cold clouds, frequently found in satellite images. From the early days of satellite image interpretation, these clouds were considered to be connected to the jet stream and were used to identify the axis of the jet stream.
- Jet Fibres can appear wherever there are jets, but they are more easily recognisable over the ocean than over the land because of the greater contrast they have against the sea surface.
- Jet Fibres are narrow with the width on the order of magnitude of several tens of kilometres (usually less than 100). They may be very elongated, with a length on the order of magnitude between several hundreds to a couple of thousand kilometres.
- In most cases Jet Fibres persist for 8 to 12 hours. However, in some cases they dissipate and new ones develop with the whole process lasting for 24 hours or even longer.
Although they can be detached from the synoptic scale systems, they are most often found in two positions:
- A low-amplitude upper-level ridge (above the Warm Front Shield (see Warm Front Shield)
- To the east of a high-amplitude trough behind a Cold Front (see Cold Front). There are also cases when Fibres appear at an angle to the Cold Front, or even perpendicular to it. This occurs when the Cold Front is a Kata type (see Cold Front).
Jet fibres as continuation of Warm Front Shields
Appearance in the basic channels:
They appear white (or very light grey) in both IR and WV images, with a pronounced fibrous structure. In WV images they are almost always accompanied by black stripes on the cyclonic (left) side. In VIS images, Jet Fibres are nearly transparent with colouring varying from light grey to grey. Although their colouring may be very similar to that of the surrounding clouds, their shape is very different, making them easily identifyable. When a fibre appears above a lower-level cloud feature, the cloud texture is different, which makes the fibre distinct from the surroundings. VIS images sometimes reveal that the fibre casts a shadow on the cloud below or the surface below.

Appearance in the basic RGBs:
Airmass RGB
The cloud fibres extend from the leading edge of the cloud bulge of the Warm Front shield east and southeastward, where they usually exist at the sharp separation point of the blue (cold) and dark brown (dry) airmasses.
The fibres themselves look as bright and white in the airmass RGB as in the IR image.
Dust RGB
The Jet Fibres lead above an area of typical cold air cloud cells - an area which is blue in the cloud free region and is filled up with ochre to dark red within the cloud cells.
The fibres appear (dependent on their thickness) as colours between dark red and black, representing either thick or translucent ice cloud.
 |
 |
Legend: Schematics for basic RGBs Left: airmass RGB; right: Dust RGB
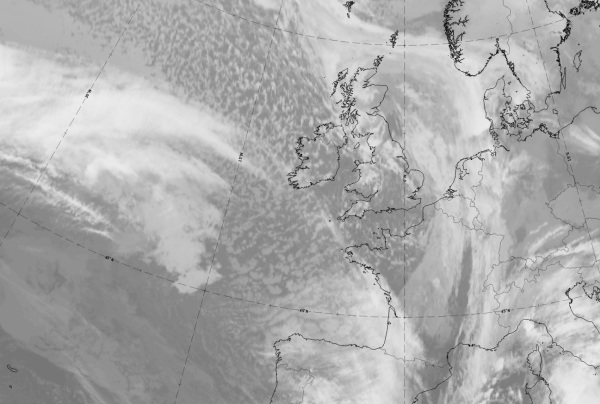
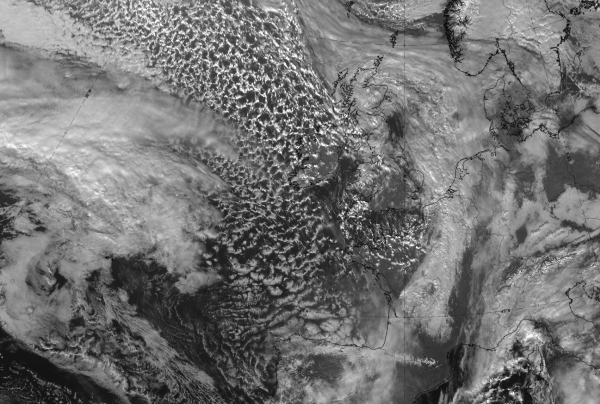
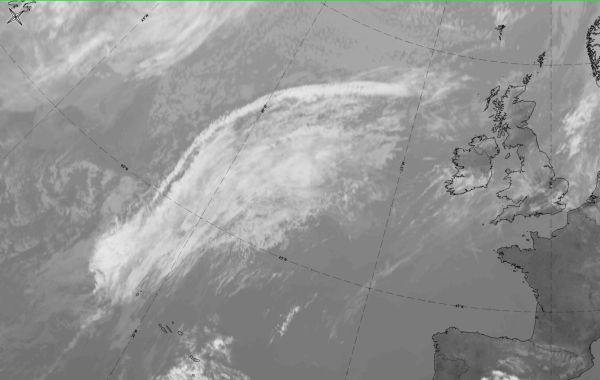
The case of 11 November 2019 at 12 UTC shows a good example for Jet fibres which lead from the edge of a warm front shield over the Atlantic across SW Ireland into France.
|
|
|
|
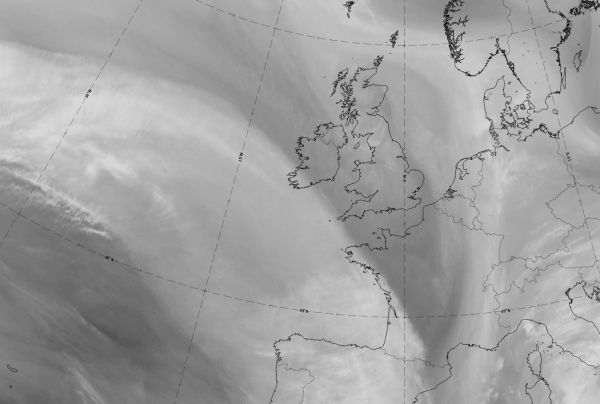
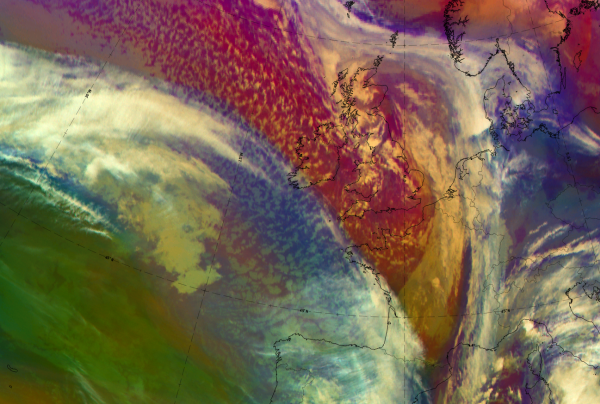

11 November 2019 at 12UTC: 1st row: IR (above) + HRV (below); 2nd row: WV (above) + Airmass RGB (below); 3rd row: Dust RGB + image gallery.
*Note: click on the Dust RGB image to access image gallery (navigate using arrows on keyboard)
| IR | Bright and fibrous. |
| HRV | Dark grey above cold air cloudiness. |
| WV | Bright grey band of high humidity with a sharp edge to the dry area in the northeast. The Cloud fibres can be found along this sharp edge where the grey shades are brighter. |
| Airmass RGB | A broad blue band representing cold air, with white fibres at the north-eastern border. Becomes a dark brown area representing cold dry air. |
| Dust RGB | Fibres are black to dark-red representing ice cloud of different thickness. |
Jet Fibres at the rear of Cold Fronts

Appearance in the basic RGBs:
Airmass RGB
The cloud fibres are along the rear side of the cold front cloud band, with the cold front cloud on the eastern and dark-brown bands or areas on the western side; the latter representing the sinking cold and dry air behind the cold front.
The fibres themselves look as bright and white as they do in the IR image; a part of them are slightly behind the cloud band partly directly at the rear.
Dust RGB
The jet fibres are along the rear side of the cold front cloud band, sometimes visible as black stripes in cases of transparent high ice cloud. Otherwise the jet fibres can appear as dark red as the cold front cloud, in cases of thick ice cloud.
 |
 |
Legend: Schematics for basic RGBs, Left: airmass RGB; right: dust RGB
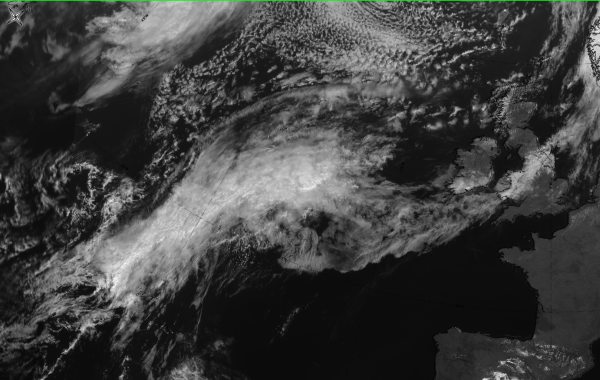
The case of 26 May 2020 at 12 UTC is a good representation of cloud fibres at the rear of, and parallel to, a cold Front cloud band over the Atlantic. In this case, the frontal system is in a wave stage and the jet fibres continue along the leading edge of the warm front band as well.
|
|
|
|
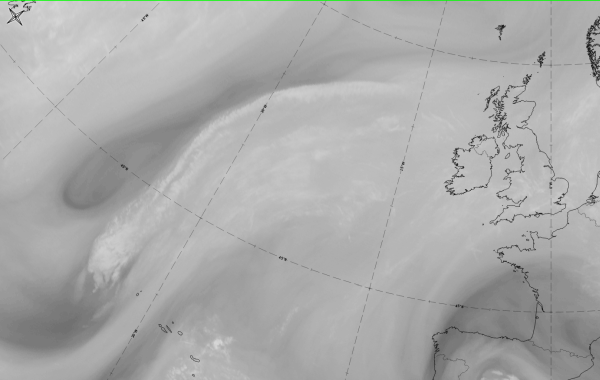
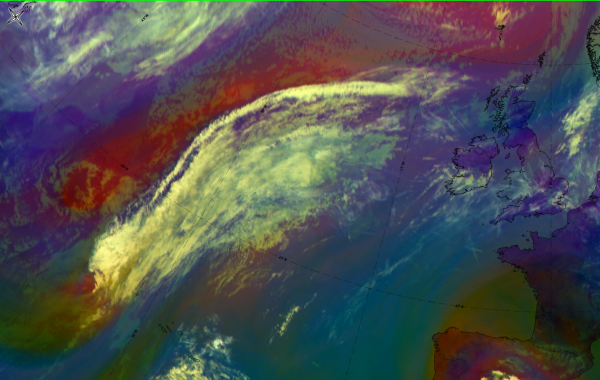

26 May 2020 at 12UTC: 1st row: IR (above) + HRV (below); 2nd row: WV (above) + Airmass RGB (below); 3rd row: Dust RGB + image gallery.
*Note: click on the Dust RGB image to access image gallery (navigate using arrows on keyboard)
| IR | A very bright jet fibre at the rear of, and partially separated from, the cold front. Also exists at the leading edge of the warm front band. |
| HRV | Dark grey jet fibre. |
| WV | Very bright at the cyclonic boundary of a broad area of high humidity (in the upper troposphere); black stripe at the cyclonic side, representing sinking dry air. |
| Airmass RGB | Clouds of fibre and frontal bands very similar to IR; dark brown stripes at the cyclonic side of the frontal system, representing sinking dry air. |
| Dust RGB | Cloud fibres are dark red in the centre but more black at the edges; thick ice cloud in the centre becomes more translucent at the edges. |
Meteorological Physical Background
Jet Fibres, also mentioned in the literature as cirrus streaks, are elongated patches of cirrus clouds, which move rapidly near the jet axis and are usually associated with jet streaks.
In general, bands of cirrus clouds tend to form or persist on the anticyclonic side of the jet. The reason for this is that jet streams are associated with the strong thermal contrast across frontal zones and the layered clouds form in the warm moist air of the Warm Conveyor Belt with cloud edge lying along the jet core.

In most cases clouds do not cross the limiting streamline of the conveyor belt and they only reach the jet stream axis in straight or anticyclonically curved sections of the jet stream.
About 50 cases were examined in this investigation. It has been observed that Jet Fibres are mostly found over the Warm Front Shield or behind a Cold Front.
There is no single theory explaining the formation of the Jet Fibres, but there are several mechanisms probably acting in combination.
Generally, there are two necessary conditions needed for clouds to develop: sufficient humidity content and upward motion.
As already mentioned one of the large-scale mechanisms causing upward motion is a Warm Conveyor Belt, bringing warm and humid air to upper levels (see Warm Front Shield - Meteorological Physical Background ). The other one, in case of the Fibres connected to a Cold Front, would be slantwise ascent of the air above the slope of the Cold Front (see Cold Front - Meteorological Physical Background ).
This synoptic scale upward motion would bring a lot of humid air to upper levels and form a broad band of clouds (frontal clouds or broad cirrus bands). So, in order to produce a cloud structure of relatively small dimensions, such as Jet Fibres, there must be an additional smaller scale mechanism.
Since a jet is necessarily involved in the formation of Jet Fibres, ascent may also occur because of the circulation in the cells around the entrance and the exit regions of the jet streak.
There is upward motion in the right entrance and left exit regions of the jet streak.
Taking into account the vertical wind shear, directly above the jet core there is also upward motion on a smaller (turbulence) scale.

Whether clouds develop or not is therefore a result of sufficient humidity in the air mass and enough upward motion from one (or a combination) of the effects mentioned above. However, this would mainly explain the formation of broader cloud bands. In some sources it is emphasised that when humidity content in the upper levels is not sufficient to allow the formation of broader cloud shield, the jet axis is still marked by a brighter shade in WV images on the anticyclonic side of the jet, and by narrow cirrus streak in IR. That would mean that these small-scale mechanisms are sometimes strong enough to lift the air sufficiently to allow ice crystals to form. Since Jet Fibres are usually rather long, the jet stream obviously acts as a means for transporting the ice particles along great distances.
In some special cases, a Jet Fibre can get an interesting ornament. Namely, ribbons of cirrus, perpendicular to the Jet Fibre (image beneath), may be seen. This phenomenon occurs in the synoptic environment of an upper level trough and is usually associated with a cold front. The deep frontal cloud dissolves, but cirrus ribbons may persist for days if wind speeds in a subtropical jet are not exceeding 40 m/s and there is a large horizontal wind shear.
|
17 October 2006/18.00 UTC - GOES 10 IR image over South America (Courtesy NOAA/NESDIS, Source: GALVIN J.F.P., 2007, The Weather and
climate of the tropics)
|
|

|
Jet Fibres behind the Cold Front
In the case of the Cold Front, besides the large scale ascending motion there is the impact of the upward motion in the right entrance region of the jet streak and small-scale upward motion caused by wind shear. Therefore, fibres form to the rear of the frontal cloud band, parallel to the jet axis, adjacent to or in the right entrance region of the jet streak, usually on the anticyclonic side of the jet.

Development of fibres behind the Cold Front: Fibres occur along the jet axis or along the anticyclonic side, in the region of the jet streak or in the right entrance region.
|
06 November 2003/06.00 UTC - Meteosat IR image; yellow: isotachs, violet: zero line of shear vorticity 300 hPa
|
|

|
The above image shows the example of Jet Fibres developed behind a Cold Front overlaid with isotachs greater than 30 m/s and the zero line of shear vorticity at 300 hPa. The fibres occur along the zero-line of shear vorticity in the entrance region of the jet streak.
Besides the cases when Jet Fibres form parallel to the frontal zone, there are also numerous cases in which jet stream comes from behind the front at a certain angle. This is typically the case when the Cold Front is Kata type. In that case fibres are also located along the jet axis or slightly on the anticyclonic side.

An example of such case can be found in the following image.
|
07 November 2003/06.00 UTC - Meteosat IR image; SatRep overlay: names of conceptual models
|
|

|
A special case is when a jet streak crosses or is going to cross the frontal cloud band, with the possible consequence of front intensification in the left exit region. In this case cloud fibres can be completely detached from the frontal systems and they usually form at large angles with the cloud band of the Cold Front ahead of them. Therefore a Jet Fibre can also be considered as an indication of the development of Front Intensification (see Front Intensification by Jet Crossing ).
|
11 November 2003/18.00 UTC - Meteosat IR image; yellow: isotachs, violet: zero line of shear vorticity 300 hPa
|
|

|
The above image shows Jet Fibres formed in the region of jet streak, along the jet axis, perpendicular to the Cold Front. One can observe the loop to see the propagation of the Fibres and the intensification that occurs at the Cold Front in the left exit region of the jet streak.
|
11 November 2003/10.00 UTC - Meteosat IR image; 11 November 10.00 UTC - 12 November 06.00 UTC hourly image loop
|
|

Jet fibres on top of the Warm Front Shield
The upward motion within a Warm Front is associated with the rising Warm Conveyor Belt with the limiting streamline on the jet axis. If the air mass in the warm conveyor belt (or a similar relative stream) is very humid, a broader band of high cloud fibres develops (see Warm Front Shield and Warm Conveyor Belt ).
Besides the smaller scale mechanisms responsible for the formation of Jet Fibres already mentioned in the case of the Cold Front, there is also an influence of the sharply curving jet stream. When the jet is curved, shear caused by the change of the wind speed is increased by the shear resulting from the change in wind direction.
Fibres also form on the cyclonic side of the Warm Front within the frontal cloud band, and there are numerous cases when the jet extends the Fibres beyond the cloud band.

Sometimes the Fibre is transported so far ahead of the Warm Front Shield that it becomes a feature unconnected to the synoptic scale systems, but only to the jet stream itself.
|
07 October 2003/12.00 UTC - Meteosat IR image
|
|
|
|
According to theory, a jet stream flows around the Warm Front Shield, with the frontal cloud band lying on the anticyclonic side of the jet axis. Supporting the theory, there are also observations from WV images in which there is a Dark Stripe along the pole ward edge of the frontal cloud band. Jet fibres develop on the anticyclonic side of the jet.
|
17 June 2003/12.00 UTC - Meteosat IR image; yellow: isotachs, violet: zero line of shear vorticity 300 hPa
|
|

|
Discussion
Although theory states that the jet flows around the Warm Front cloud band and that the fibres should therefore develop above the frontal cloud band, on the anticyclonic side of the jet, there are numerous cases in which the situation is quite different. Namely, the jet flows through the Warm Front cloud band, fibres are still along the edge of the Warm Front cloud band, but on the cyclonic side of the jet. Here is one such case:
|
16 January 2004/18.00 UTC - Meteosat IR image; yellow: isotachs, blue: shear vorticity 300 hPa
|
|

|
Or another, even more pronounced example:
|
25 September 2003/06.00 UTC - Meteosat IR image; yellow: isotachs, blue: shear vorticity 300 hPa
|
|

|
Such cases are not so rare. In the literature it is stated that in two out of nine cases (22 %) cirrus clouds were found on the cyclonic side of the jet axis.
There are several possible explanations but the most probable one is that this effect is a result of the combination of the following causes:
- The model is not perfectly reliable: parameter fields can be shifted, especially the forecast parameters.
- The Jet axis is tilted vertically: at higher levels the jet is inclined more northwards compared to its location in lower levels, looking in the direction of the jet. Therefore, if the strongest winds are at level higher than 300 hPa (which is often the highest level in the global model or at least the one representing the jet stream) it is possible that the position of the fibre is determined by a higher jet axis. In that case, the jet axis at 300 hPa would be located more southward and could therefore appear to be on the anticyclonic side of the Jet Fibre.
Finally, if we consider that the model is correct, and the fibre is exactly at the level of maximum wind, and if we still find it on the cyclonic side, the explanation could be:
- The circulation around the jet axis: small-scale circulation makes the air rise on the anticyclonic and sink on the cyclonic side. Therefore, there is necessarily also part of that circulation cell which transports the air from anticyclonic to cyclonic side at upper layers. Taking into account that air cannot dry instantly, it is possible that humid air also persists for some time on the cyclonic side of the jet.
Since this effect of Fibres forming on the cyclonic side of the jet has only been observed in the case of Fibres seen above the Warm Front Shield, another possible reason could be:
- Sharply curving jet axis: Because of the shear caused by curvature, there could also be some ascent on the cyclonic side of the jet allowing the cirrus to persist on that side.
Key Parameters
- Isotachs (at 300 hPa, 250 and 200 hPa can all be considered)
- Indications of jet intensity and the location of entrance and exit regions
- Jet Fibres form very near to the jet maximum
- Shear vorticity (zero-line of shear vorticity at 300 hPa)
- Indication of jet axis
- Zero-line of shear vorticity is parallel to both Jet Fibre and the WV Dark Stripe
In cases where Fibres are associated with the Warm Front, they appear mostly in the leading part of the jet streak. In cases of the Cold Front, Fibres usually lie within the wind maximum or in the entrance region of the jet streak.
When compared to jet axes, Fibres can in most cases be found along the zero-line of shear vorticity or slightly shifted to the anticyclonic side of the jet. Some exceptions occur in Warm Front cases (see Meteorological Physical Background ).
|
|
06 November 2003/ 06.00 UTC - Meteosat IR image, yellow: isotachs, violet: zero line of shear vorticity 300 hPa
|
|
|
|
The diagrams above show the location of wind maximum and zero-line of shear vorticity behind Ana and Kata Cold Fronts. Fibres form in the entrance region or adjacent to the jet streak.
|
|
17 June 2003/12.00 UTC - Meteosat IR image; yellow: isotachs, violet: zero line of shear vorticity 300 hPa
|
|
|
In the Warm Front case, the jet axis follows the cloud band along the cyclonic side. Fibres mostly form in the leading part of the jet streak and mostly on the anticyclonic side, but there are some exceptions (see Meteorological Physical Background ).
Supporting Parameters
- Relative humidity - necessary condition for the formation of clouds
Distribution of humidity in the model fields is governed by the synoptic scale features with which Fibres are associated. - Warm conveyor belt - the Jet Fibre coincides with the limiting streamline.
|
06 November 2003/06.00 UTC - Meteosat IR image, blue: relative humidity at 700 hPa
|
17 June 2003/12.00 UTC - Meteosat IR image, blue: relative humidity
|
|
|
|
|
|
|
|
|
05 November 2003/06.00 UTC - Meteosat IR image; magenta: relative streams 304K - system velocity 216° 12 m/s; yellow: isobars
304K
|
Typical Appearance In Vertical Cross Sections
Jet Fibres usually develop in the vicinity of, or directly above a Warm or Cold Front, therefore it is not very easy to recognise them in cross sections. Moreover, the distribution of meteorological parameters reflects what is going on in those synoptic scale systems. In other words, Jet Fibres are not clearly seen in cross-sections and they have no specific appearance. However, the distribution of key parameters associated with the fibres can give some indicators for their most likely location.
Several vertical cross-sections, perpendicular to fibres, have been examined. Typical parameters studied were:
- Isotachs
The jet streak is located near the maximum radiance in WV and IR of the fibre
Fibres are located near to the jet axis, in most cases shifted slightly to the anticyclonic side - Relative humidity
A fibre is sometimes located near a secondary humidity maximum, but the main humidity maximum represents the frontal cloudiness. - Isentropes
The slope of the isentropes shows the frontal zone
Jet Fibres behind the Cold Front
|
|
The isentropes show a downward inclined gradient zone of the Cold Front. The humidity distribution is dominated by the frontal humidity. High values of relative humidity can be found ahead of the frontal zone, along the slope of the isentropes. In some cases a secondary humidity maximum indicates a Fibre. The wind maximum is found right next to the Jet Fibre, with the Fibre being on the anticyclonic side of the jet.
|
13 January 2004/12.00 UTC - Meteosat IR image; position of vertical cross section indicated from north to south
|
13 January 2004/12.00 UTC - Vertical cross section; black: isentropes (ThetaE), yellow: isotachs, orange thin: IR pixel values,
orange thick: WV pixel values
|
|
|
|
|
|
13 January 2004/12.00 UTC - Vertical cross section; black: isentropes (ThetaE), blue: relative humidity, orange thin: IR pixel
values, orange thick: WV pixel values
|
|
Jet Fibres above the Warm Front Shield
|
|
The slope of the isentropes and the humidity distribution are typical for a Warm Front. The humidity maximum occurs along the slope of the isentropes. A secondary humidity maximum, representing the fibre, can be found on the anticyclonic side of the jet maximum. The jet maximum occurs above the forward part of the frontal surface.
|
16 February 2004/12.00 UTC - Meteosat IR image; position of vertical cross section indicated from SW to NE
|
|
|
|
|
16 February 2004/12.00 UTC - ALADIN Vertical cross section; black: isotachs, blue: relative humidity, wind arrows superimposed
|
16 February 2004/12.00 UTC - ALADIN Vertical cross section; black: isentropes (ThetaE), blue: relative humidity
|
|
|
|
16 February 2004/12.00 UTC - Vertical cross section; black: isentropes (ThetaE), yellow: isotachs, orange thin: IR pixel values,
orange thick: WV pixel values
|
16 February 2004/12.00 UTC - Vertical cross section; black: isentropes (ThetaE), blue: relative humidity, orange thin: IR pixel
values, orange thick: WV pixel values
|
|
|
Distribution of wind, humidity and equipotential temperature in a cross section through a Warm Front.
If one compares Aladin and ECMWF cross-sections, it is clear that the ECMWF model does not resolve humidity in the upper troposphere well enough. The Aladin cross sections show a much better humidity distribution along the frontal zone and in the region where Jet Fibres occur.
Weather Events
Since Jet Fibres are high altitude cirrus clouds, therefore no weather phenomena are expected on the ground are expected. However, since they appear along the jet axis in the region of maximum wind, therefore jet related phenomena such as turbulence can be expected in that region aloft.
Turbulence generally appears in the zone of high horizontal and vertical wind shear, around the jet streak. Turbulence occurs most frequently on the left-hand side below the level of the jet core, or on the right side above the level of the jet core. Furthermore, a sharply curving jet stream on the pole ward side of a Warm Front Shield, is associated with greater turbulence than compared with a straight jet stream behind the Cold Front. Jet fibres are often considered a good indication for clear-air turbulence (CAT) which may affect flights at high levels and is a major cause of discomfort and disruption to passengers on aircraft.
Associated with the Subtropical Jet Stream (STJ), but separate from it, areas of tropical CAT are observed. These may be identified by their high-cloud signature, cirrus ribbons.
| Parameter | Description |
| Precipitation |
|
| Temperature |
|
| Wind (incl. gusts) |
|
| Other relevant information |
|
For a demonstration of weather events the case of 24 May 2010 at 06 UTC is chosen.
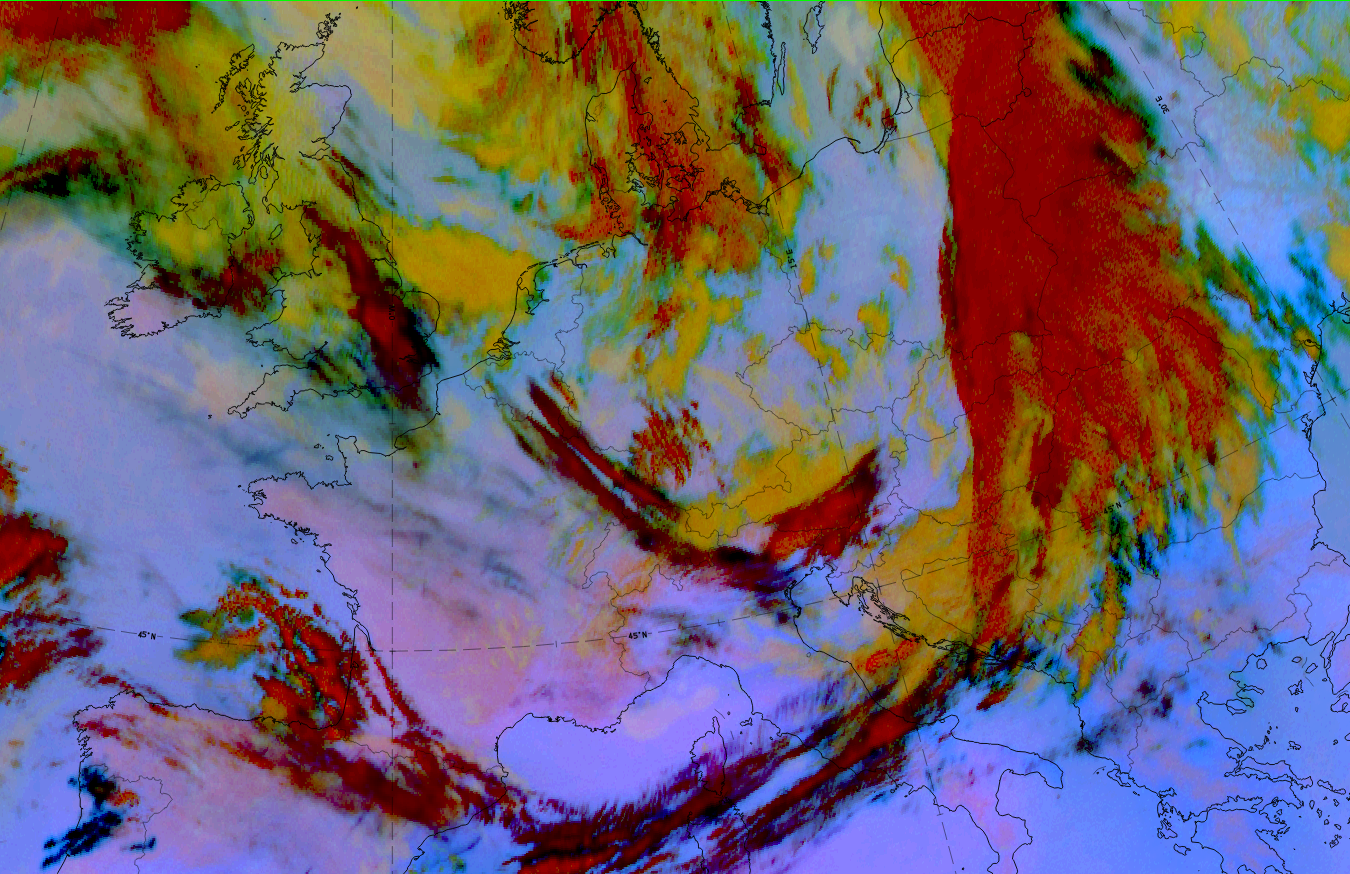
Legend: 14 May 2020 at 06 UTC; Dust RGB.
This case shows both types of jet fibres:
- At the leading side of a WF shield starting from Eastern Scotland and stretching downstream to Europe (France to Germany to Switzerland) where it changes the orientation from NW-SE to SW-NE;
- from that time onwards, it approaches the cold front and can be seen as black fibres along the wave bulge over Slovakia and Poland.
|
|
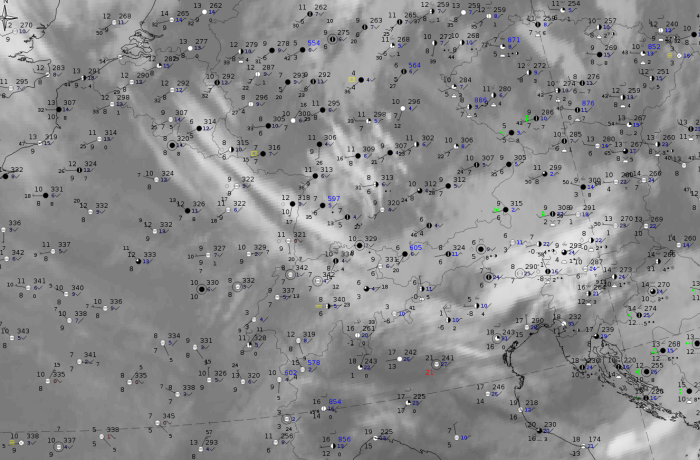
Note: for a larger SYNOP image click this link.
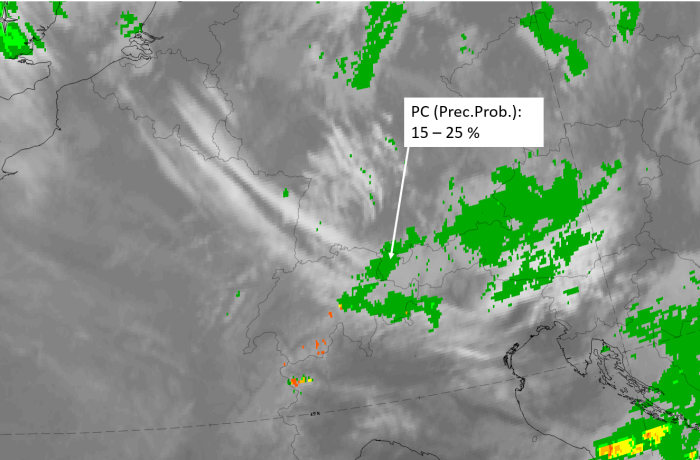
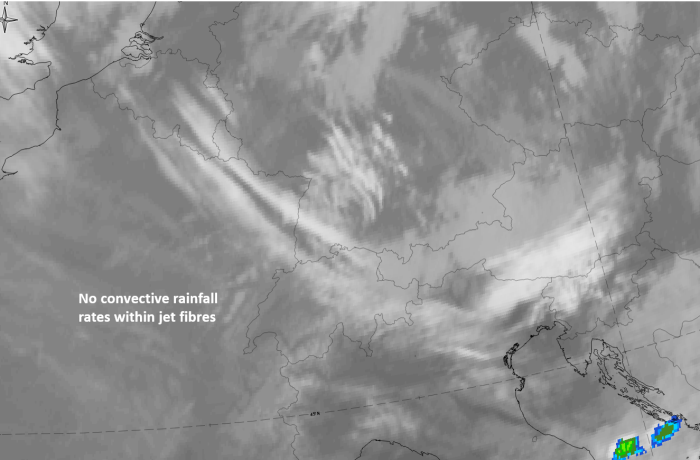
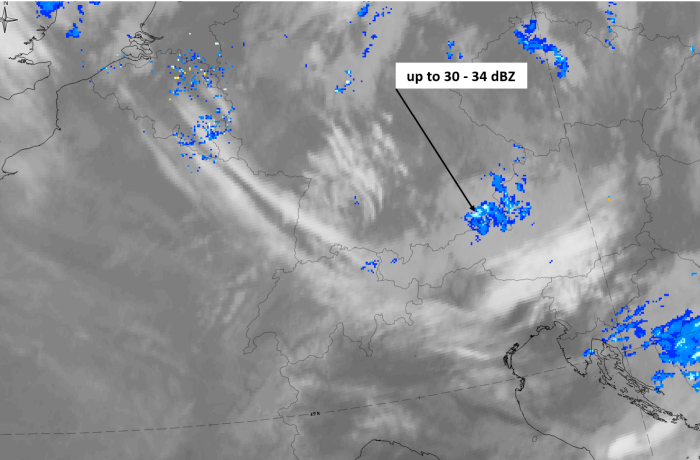
There is no precipitation report from stations below the jet fibres; mostly the conditions are overcast. The computation of precipitation probabilities from the NWCSAF are also very low. The same can be seen in the precipitation images (CRR and radar Opera) in the figure below.
|
|
|
|
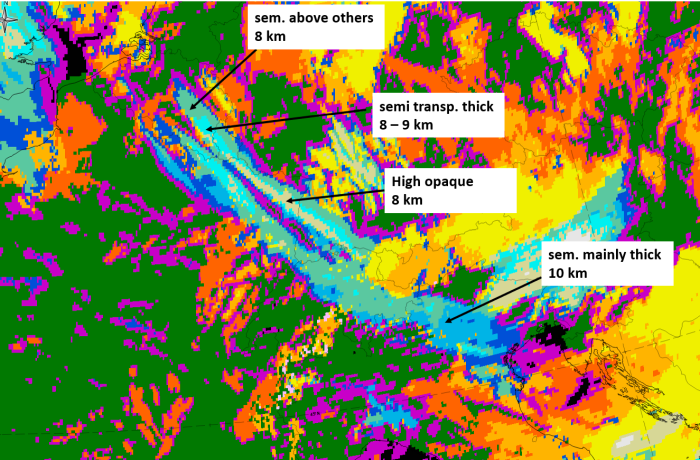
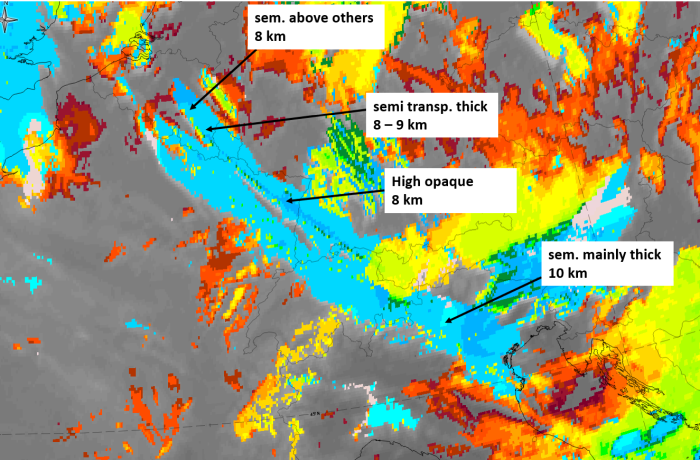
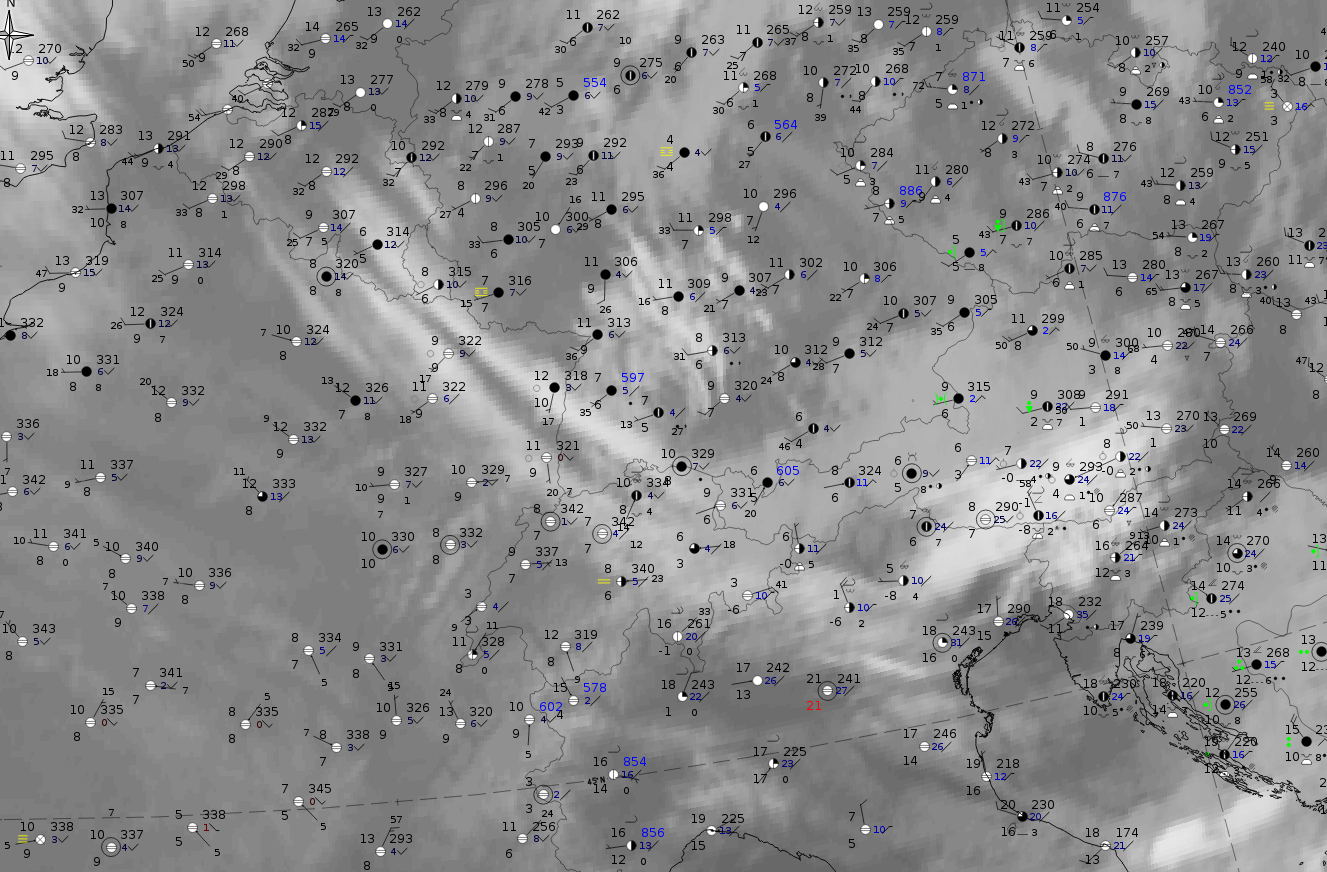
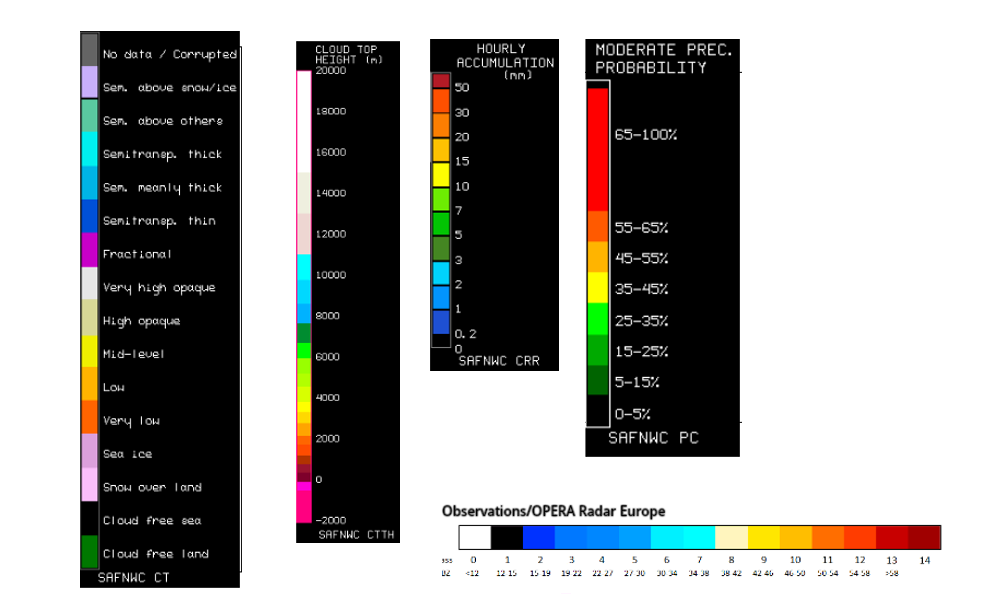
Legend:
24 May 2020 at 06 UTC, IR; superimposed:
1st row: Cloud Type (CT NWCSAF) (above) + Cloud Top Height (CTTH - NWCSAF) (below); 2nd row: Convective Rainfall Rate (CRR NWCSAF) (above) + Radar intensities from Opera radar system (below).
For identifying values for Cloud type (CT), Cloud type height (CTTH), precipitating clouds (PC), and Opera radar for any pixel in the images look into the legends. (link).
References
General Meteorology and Basics
- REITER E. R., 1963: Jet-stream meteorology, The University of Chicago Press, Chicago
- VINNICHENKO N. K., N. Z. PINUS, S. M. SHMETER, and G. N. SHUR,1980: Turbulence in Free Atmosphere, Consultants Bureau, New York
- LESTER P. F., 1995: Aviation Weather, Jeppesen Sanderson, Englewood
- ENDLICH R. M., 1953: A study of vertical velocities in the vicinity of jet streams. Journal of the Atmospheric Sciences: Vol. 10, No. 6, pp. 407-415.
- SHAPIRO M. A., 1981: Frontogenesis and geostrophically forced secondary circulations in the vicinity of jet stream-frontal zone systems. Journal of the Atmospheric Sciences: Vol. 38, No. 5, pp. 954-973.
- ENDLICH R. M. and MCLEAN G. S., 1957: The structure of the jet stream core. Journal of the Atmospheric Sciences: Vol. 14, No. 6, pp. 543-552.
- ANDERSON A. D., 1957: Free-air turbulence. Journal of the Atmospheric Sciences: Vol. 14, No. 6, pp. 477-494.
- BEDARD JR. A.J., F. CANAVERO and F. EINAUDI, 1986: Atmospheric Gravity Waves and Aircraft Turbulence Encounters. Journal of the Atmospheric Sciences: Vol. 43, No. 23, pp. 2838-2844.
- CONOVER J. H., 1960: Cirrus patterns and related air motions near the jet stream as derived by photography. Journal of the Atmospheric Sciences: Vol. 17, No. 5, pp. 532-546.
- SASSEN K., D. O'C. STARR, G. G. MACE, M. R. POELLOT, S.H. MELFI, W. L. EBERHARD, J. D. SPINHIRNE, E.W. ELORANTA, D. E. HAGEN and J. HALLETT, 1995: The 5-6 December 1991 FIRE IFO II Jet Stream Cirrus Case Study: Possible Influences of Volcanic Aerosols. Journal of the Atmospheric Sciences: Vol. 52, No. 1, pp. 97-123.
- GALVIN J.F.P., 2007: The weather and climate of the tropics, Part 2 - The subtropical jet streams. Weather: Vol. 62, No. 11, pp. 295-299.
General Satellite Meteorology
- BADER M. J., FORBES G. S., GRANT J. R., LILLEY R. B. E. and WATERS A. J. 1995: Images in weather forecasting - a practical guide for interpreting satellite and radar imagery; Cambridge University Press
- CONWAY E. D. and THE MARYLAND SPACE GRANT CONSORTIUM, 1997: An Introduction to Satellite Image Interpretation, The Johns Hopkins University Press, London
- RAO P. K., S. J. HOLMES, R. K. ANDERSON, J. S. WINSTON and P. E. LEHR, 1990: Weather satellites: Systems, Data and Environmental Applications, American Meteorological Society, Boston
Specific Satellite Meteorology
- SASSEN K. and J. R. CAMPBELL, 2001: A Midlatitude Cirrus Cloud Climatology from the Facility for Atmospheric Remote Sensing. Part I: Macrophysical and Synoptic Properties. Journal of the Atmospheric Sciences: Vol. 58, No. 5, pp. 481-496.
- VIEZEE W., R. M. ENDLICH and S. M. SEREBRENY. 1967: Satellite-Viewed Jet Stream Clouds in Relation to the Observed Wind Field. Journal of Applied Meteorology: Vol. 6, No. 5, pp. 929-935.