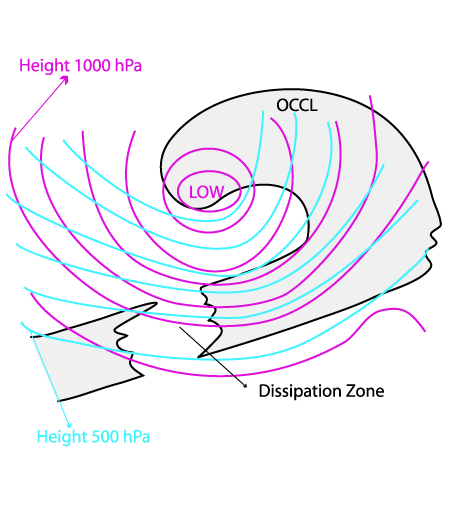
Key Parameters
- Height contours at 1000 hPa and 500 hPa:
- Upper level and low level trough corresponding to the frontal system in all stages of life cycle of Front Decay
- Acute angle between isolines of surface low and Upper Level Low indicating cold advection
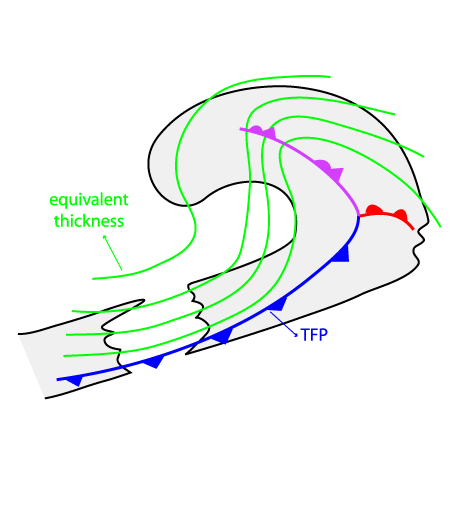
- Thermal front parameter (TFP) and equivalent thickness:
- Zone of high gradient of equivalent thickness to the rear of the cloud band
- Maximum of the TFP accompanies the cloud band
- Weakening of the thermal front parameter at the end of the life cycle of a Front Decay is possible
- Temperature advection (TA) at 700 hPa:
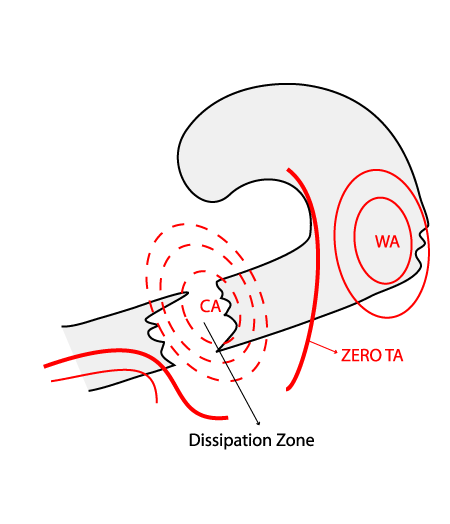
- Very distinct maximum of CA over the dissipation zone within the frontal cloud band
- Zero line of TA appears almost at right angles to the front line
- No difference between the 3 types of conceptual sub model
- CA remains mostly constant in the life cycle, although a few cases show some weakening at the mature stage of Front Decay
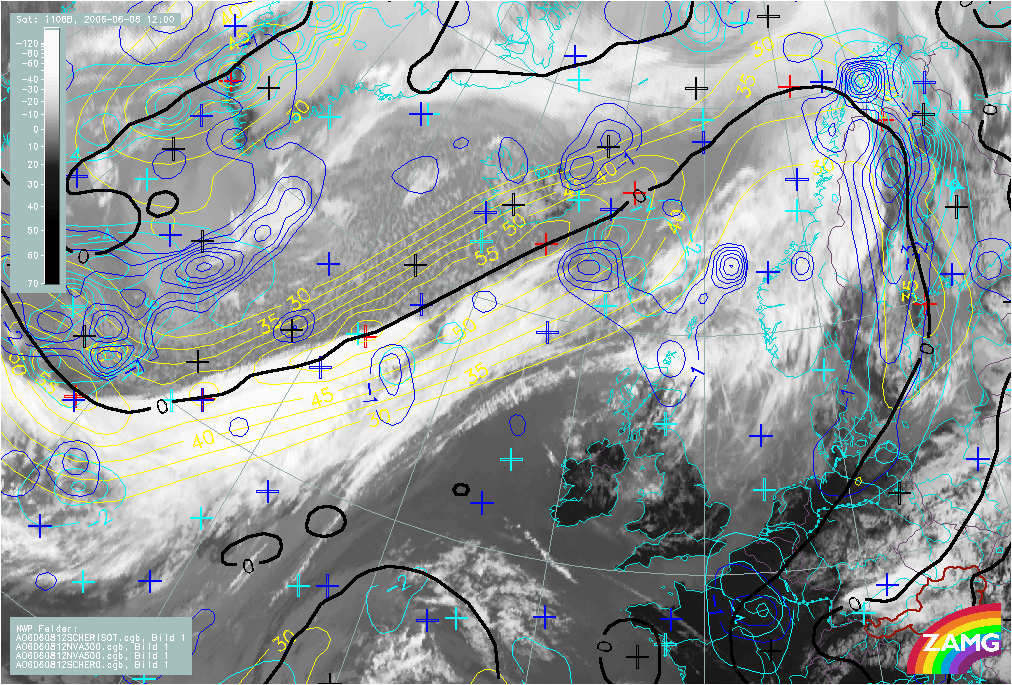
- Isotachs at 300 hPa:
- Isotachs at 300 hPa show a pronounced jet streak along the rear edge of the frontal cloud band
- Jet axis mostly parallel to the rear edge of frontal cloud band over the dissipation zone (only 30% of all cases show acute angle between jet axis and cloud band)
- The cloud gap of the Front Decay is always located on the anticyclonic side of the jet axis, near the centre and/or the right exit region of a jet streak
- Vorticity advection at 500 and 300 hPa (VA):
- Field of vorticity advection shows an NVA at 500 as well as at 300 hPa, maximum, mostly associated with the right exit region of the jet streak
- Maxima of NVA at 500 hPa and 300 hPa intensify at a more mature stage in the lifecycle of the Front Decay
- Higher coincidence between NVA maxima and the cloud gap, if the dissipation zone is situated in the right exit region of a jet streak
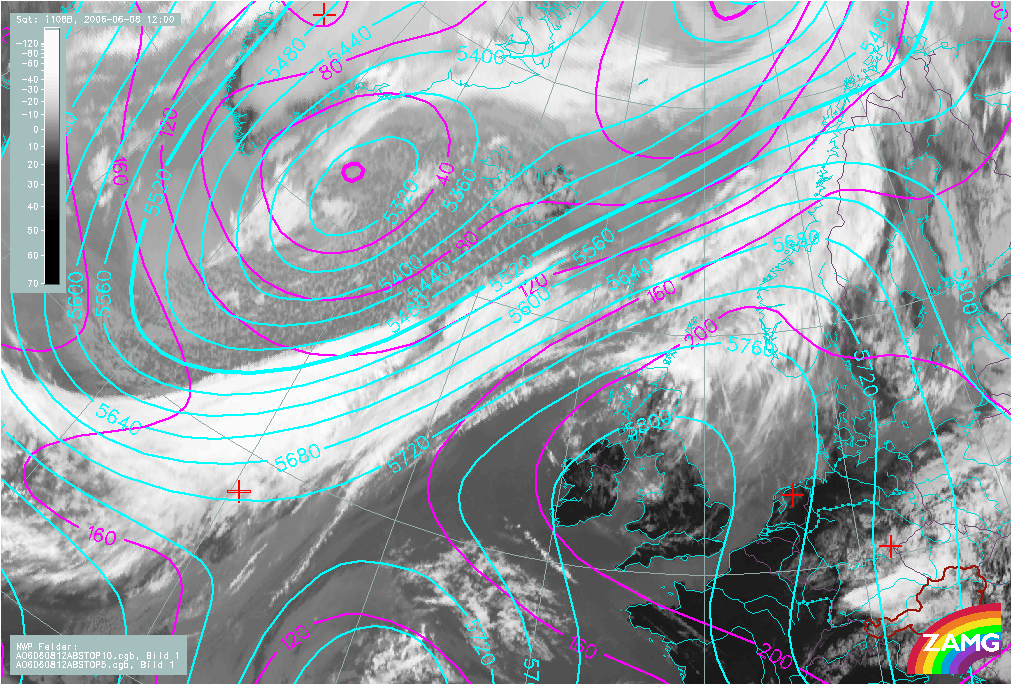
Height contours at 1000 and 500 hPa
|
08 June 2006/12.00 UTC - Meteosat 8 IR10.8 image; magenta: height contours 1000 hPa, cyan: height contours 500 hPa
|
|
|
|
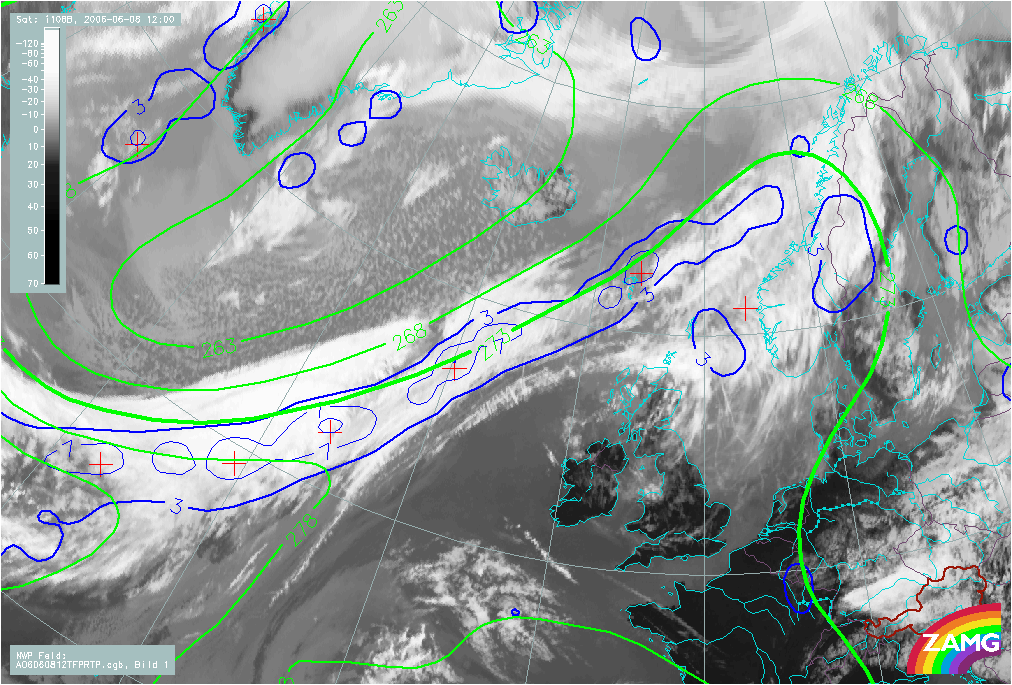
Thermal front parameter (TFP) and equivalent thickness
|
08 June 2006/12.00 UTC - Meteosat 8 IR10.8 image; blue: thermal front parameter 500/850 hPa, green: equivalent thickness 500/850 hPa
|
|
|
|
Temperature Advection at 700 hPa
|
08 June 2006/12.00 UTC - Meteosat 8 IR10.8 image; red dashed: temperature advection - CA 700 hPa, red solid: temperature advection - WA 700 hPa
|
|
|
|
Isotachs at 300 hPa and vorticity advection at 500 and 300 hPa (VA)
|
08 June 2006/12.00 UTC - Meteosat 8 IR10.8 image; blue: negative vorticity advection 500 hPa, cyan: negative vorticity advection 300 hPa, yellow: isotachs 300 hPa, black: zero line of shear vorticity 300 hPa
|
|
|
|