Table of Contents
Cloud Structure In Satellite Images
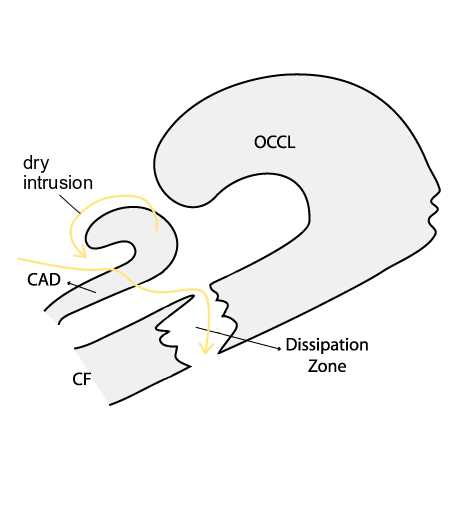
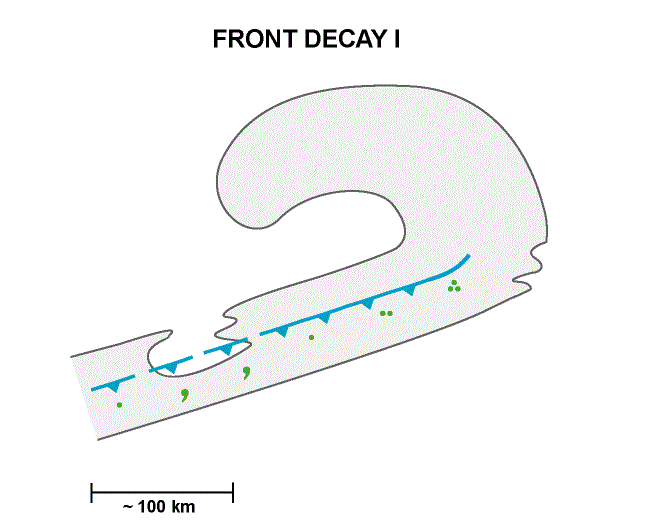
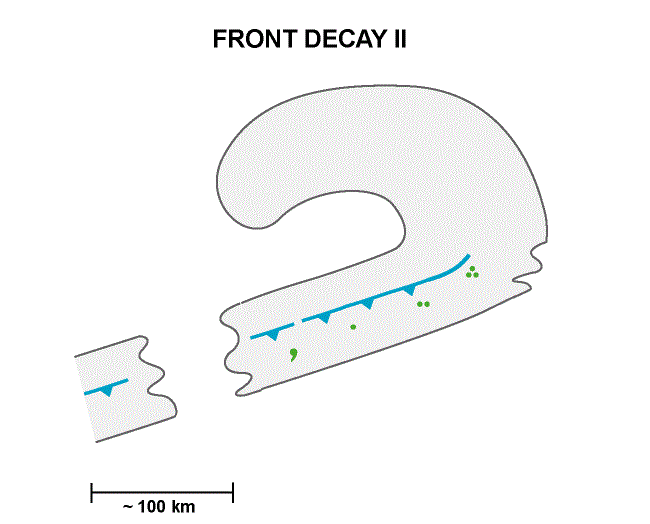
Front Decay describes a substructure in Cold Front cloud bands. Satellite images show a temporary or complete meso- to subsynoptic scale dissipation of cloudiness within a frontal cloud band. The life cycle of this mechanism ranges from 6 to 24 hours. The investigation was based on 48 cases, where 27 cases were addressed in detail.
Appearance in the basic channels
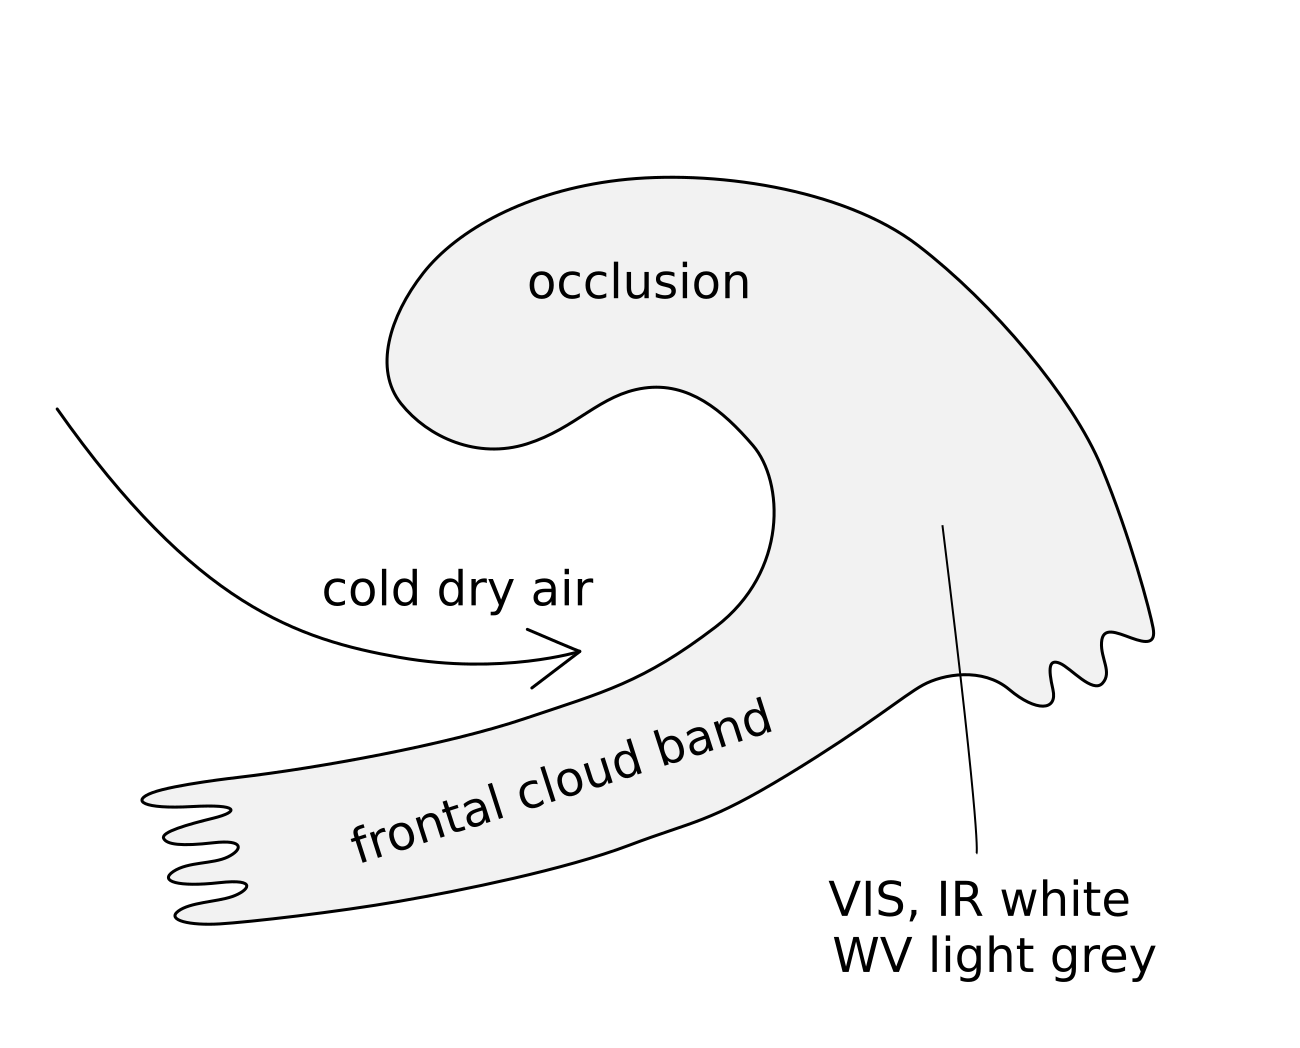
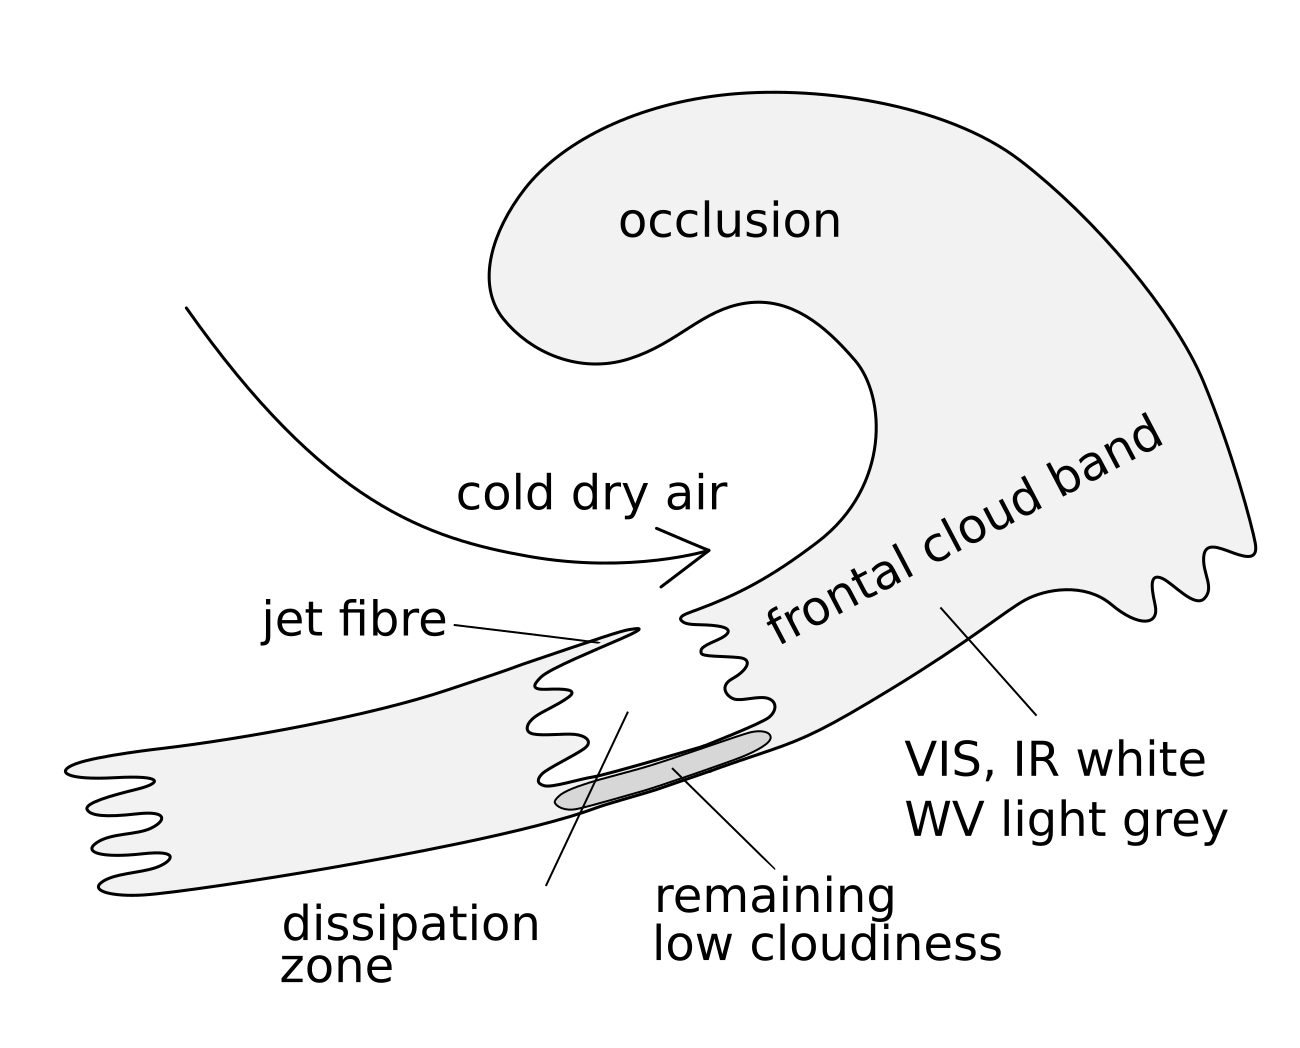
- IR imagery:
- The cloud decay generally starts from the colder, and dryer, rearward side of the frontal band, showing a dark or even black area in the IR image which increases over time.
- At an early stage dissipation takes place within high and middle-level clouds, leaving behind a dark grey stripe associated with lower cloud fraction.
- Sometimes a clear bright jet cloud fibre forms at the edge of the cloud gap. Physical processes, indicated by relative streams, lead to either the dissipation of the low clouds during the mature stage of the process, or the re-filling of the cloud gap again.
- WV imagery:
- The light grey WV band darkens from the rear edge.
- The grey shade of the dissolution zone in the WV differ depending on the characteristics of individual cases - but a weak WV band structure is present in all investigated cases.
- VIS imagery:
- In most cases the VIS image shows that low cloud fraction remains even in an advanced state of Front Decay.
- Complete dissipation in the later stage of the life cycle occurs only in 14% of the cases. The remaining 86% of the cases contain patches of thin clouds.
|
|
Appearance in the basic RGBs:
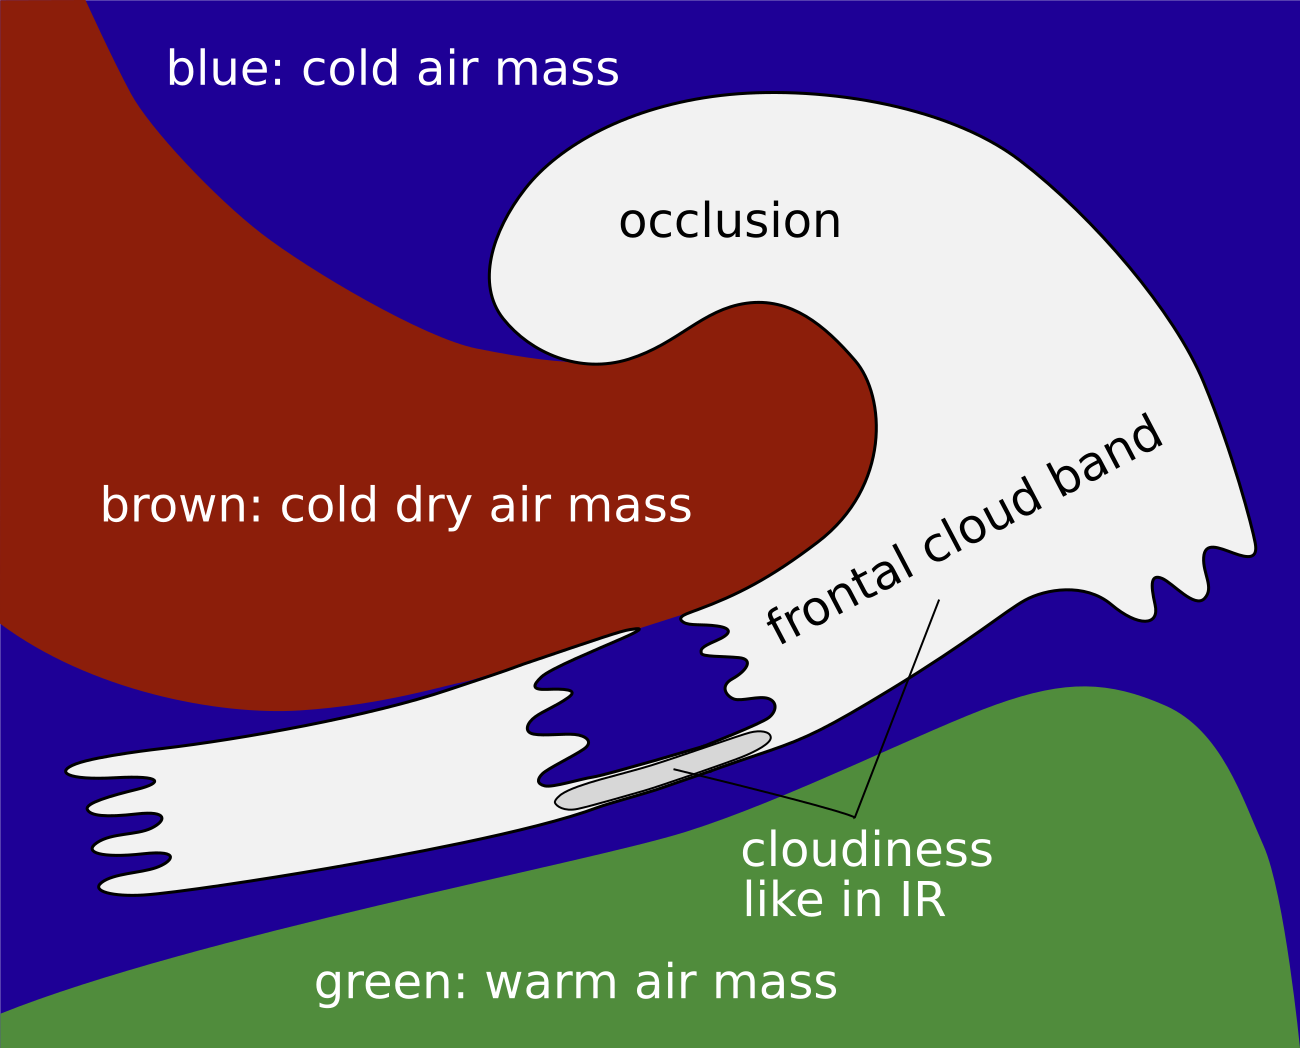
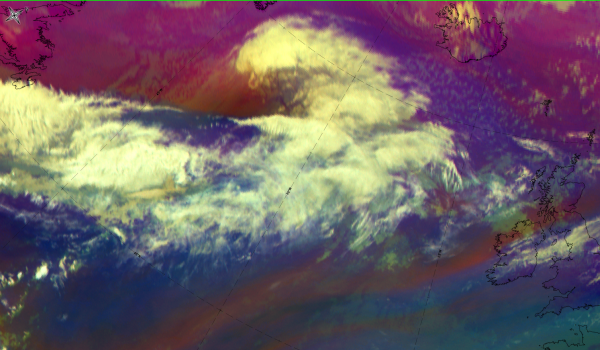
Airmass RGB
In the area of Front Decay (FD) clouds experience strong evaporation and the cloud free region shows the ground below. In this area, cold air masses have already protruded downstream, which can be seen in the blue colours. At the rear of the FD, dark brown represents the cold and dry airmasses.
As usual, the rest of the clouds associated with the cold front band is in the airmass RGB is very similar to that of the IR image.
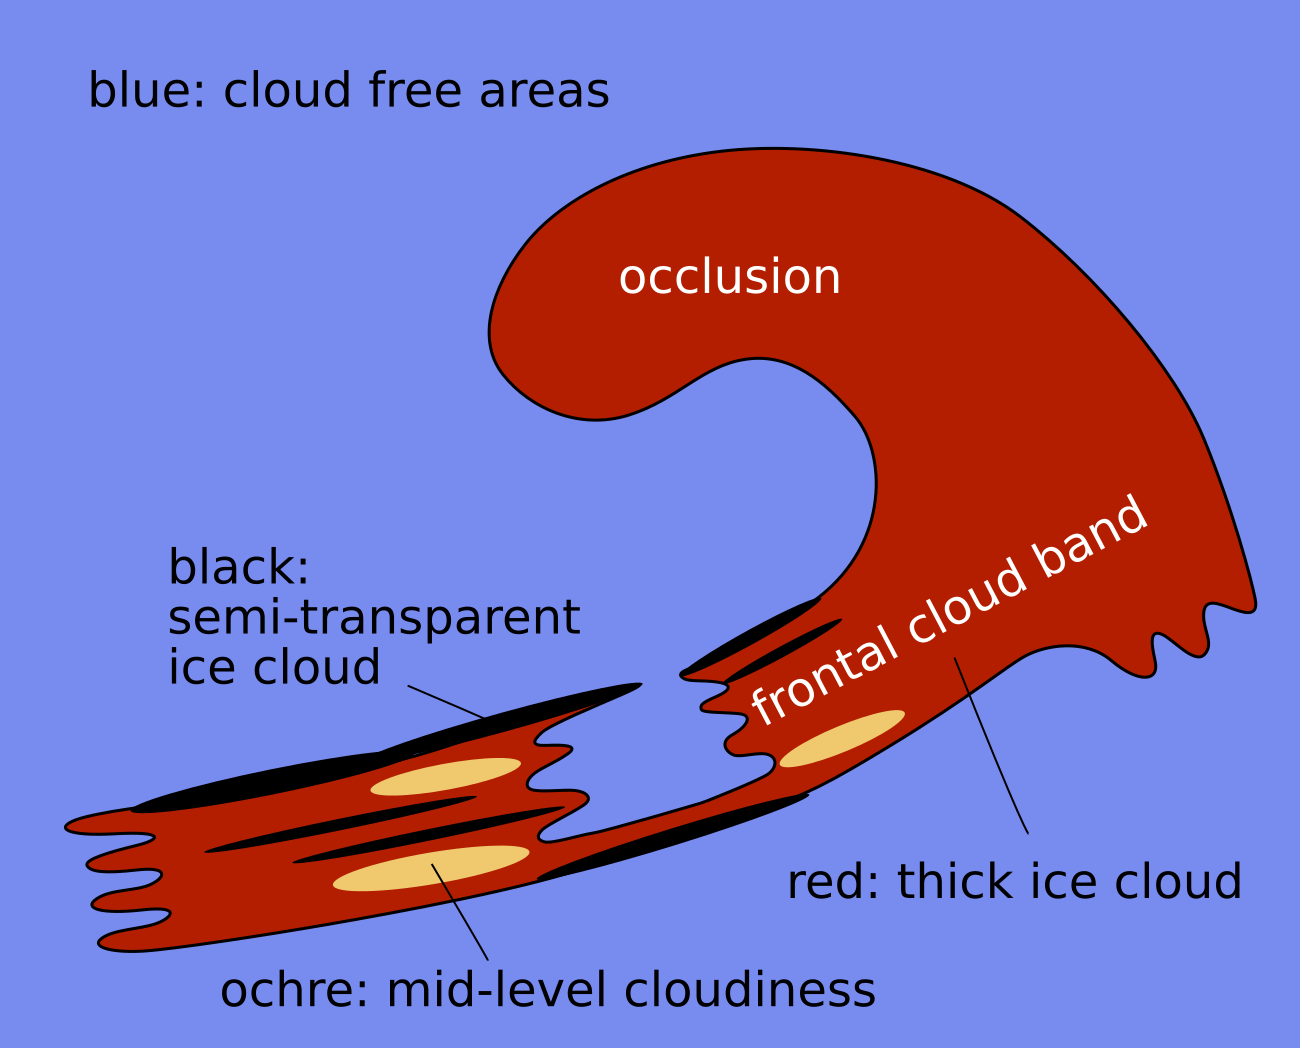
Dust RGB
In the area of the FD, where clouds are evaporated, the Dust RGB shows the Earth’s surface which is blue or pinkish blue. Sometimes greenish colours indicate that some thin medium level cloud exists.
In the surroundings, the rest of the frontal cloud band depends on the degree of evaporation of the black cloud fibres (representing high ice cloud). Some black cloud fibres can often be found at the rear of the frontal cloud band close to the jet axis. Note that in cases of reduced evaporation of the frontal clouds, dark red patches can exist, indicating thicker ice cloud.
 |
 |
Legend: Left: Airmass RGB; right: Dust RGB
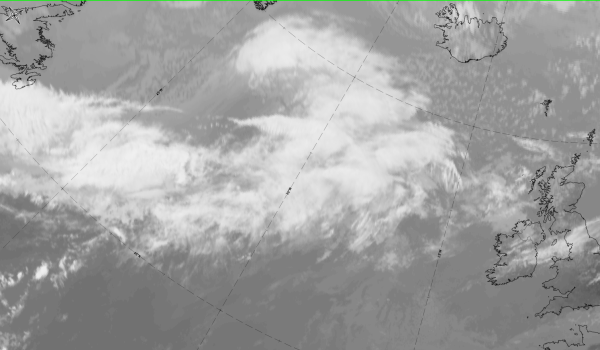
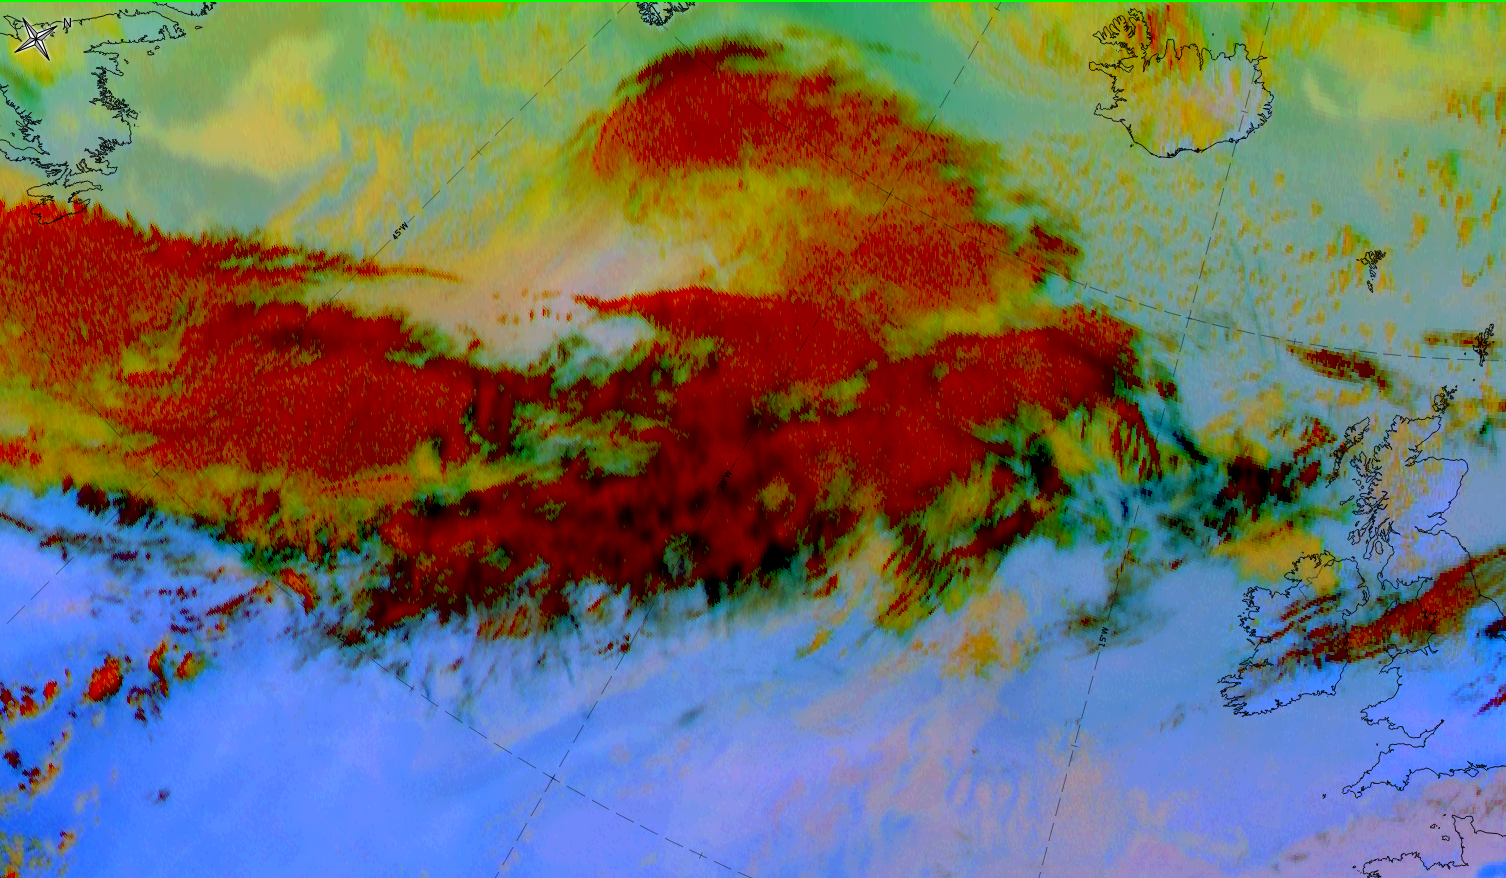
The case from 13 September 2019 shows that at 12UTC in the NW-Atlantic, a frontal system consisting of a cold frontal cloud band exists. This cold front band extends from W to NE and an occlusion cloud spiral is positioned south of, and between, Greenland and Iceland. In the cold frontal cloud band immediately south of the two pieces of cloud fibres (at the rear side), there is an area where cloud has disappeared - the area of Front Decay.
|
|
|
|
13 September 2019 at 12UTC: 1st row: IR (above) + HRV (below); 2nd row: WV (above) + Airmass RGB (below); 3rd row: Dust RGB + image gallery.
*Note: click on the Dust RGB image to access image gallery (navigate using arrows on keyboard)
| IR | Bright cold front cloud band; bright fibres at rear side at jet axis; dark area to the south of these fibres, representing an area of evaporation of high cloud. |
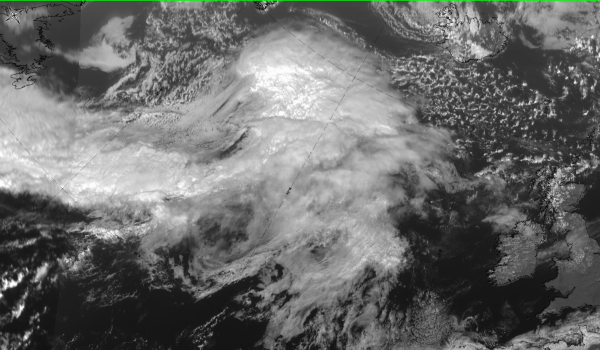
| HRV | Bright cold front cloud band; dark grey cloud in the area of the Front Decay, representing that the rest of the cloud is low and midlevel cloud. |
| WV | Bright or light grey band of high humidity in the upper layers; bright cloud fibres at the rear side; the area of Frontal Decay is slightly darker. |
| Airmass RGB | Clouds appear similar to those in the IR; around the cloud band and in the cloud free areas, bluish colours represent the cold air mass, similar to the area of Frontal Decay. At the rear, brownish colours represent the cold and dry sinking air behind the cold front. |
| Dust RGB | Frontal cloud band with ochre and dark red colours where the mid-level liquid and thick ice cloud are present. In the area of Frontal Decay, pinkish red and greenish dominate; towards the NW, mid-level cloud mid-level cloud is indicated by ochre. |
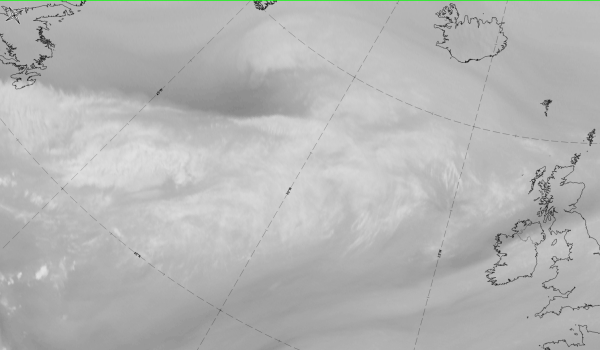
The 3-hourly sequence of images below from 13 September 2019 at 00UTC to 12 UTC shows - indicated by the white arrows - clearly the evaporation of cloudiness at the rear side of the frontal cloud band within these 12 hour period.
Legend: 13 September 2019: IR images: 00, 03, 06,09, 12 UTC.
*Note: click on the image to access the image gallery (navigate using arrows on keyboard)
Meteorological Physical Background
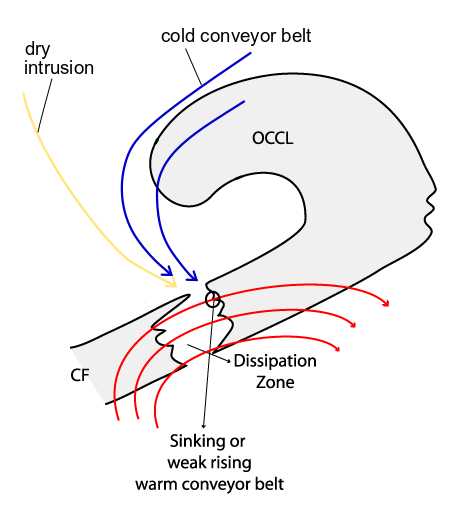
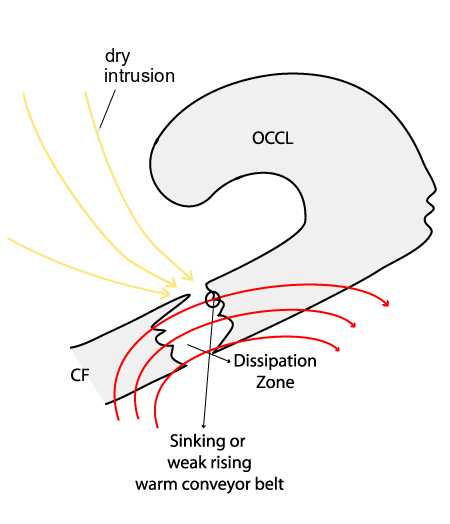
In general, the conveyor belt concept provides an excellent explanation for the decay of cloudiness within a frontal cloud band. Three synoptic situations, based on the source of the air masses transported by the relative streams, can be distinguished:
- The involvement of air rotating around the centre of a depression associated with the frontal system.
- A sinking relative stream (a cold conveyor belt or a dry intrusion) can be detected which flows at nearly right angles to the frontal cloud band at low to middle levels, leading to the characteristic decay of cloudiness.
- At upper levels, a sinking or only a very weakly rising warm conveyor belt can be observed.
|
The following figures show the relative streams of a case over the Atlantic when there is Frontal Decay occuring in air masses associated with the related system vortex:
|
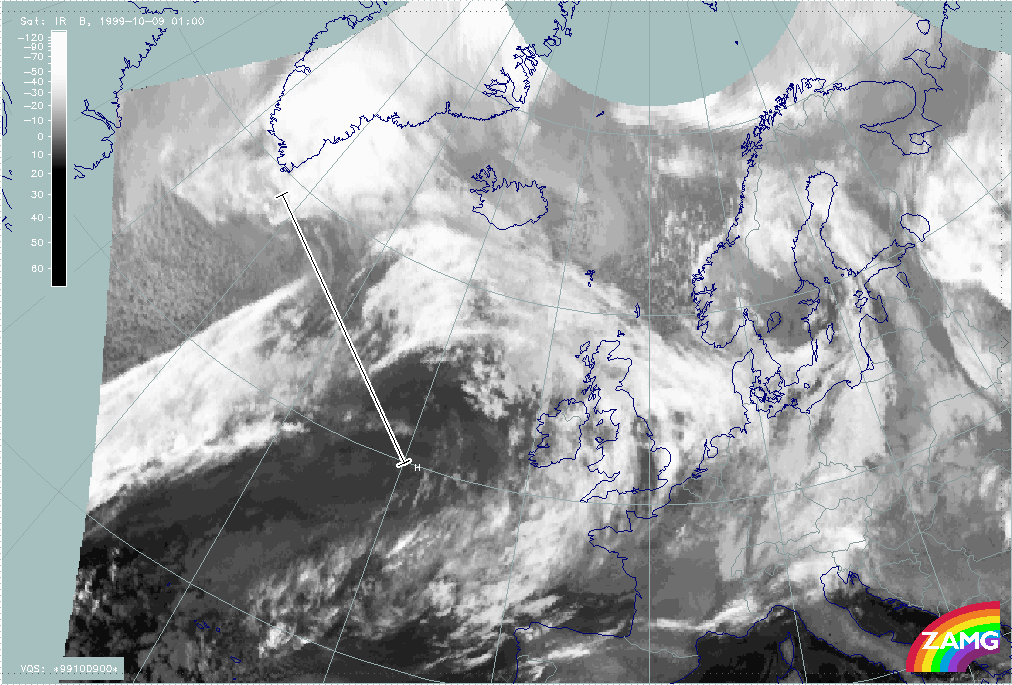
09 October 1999/01.00 UTC - Meteosat IR image; position of vertical cross section indicated
|
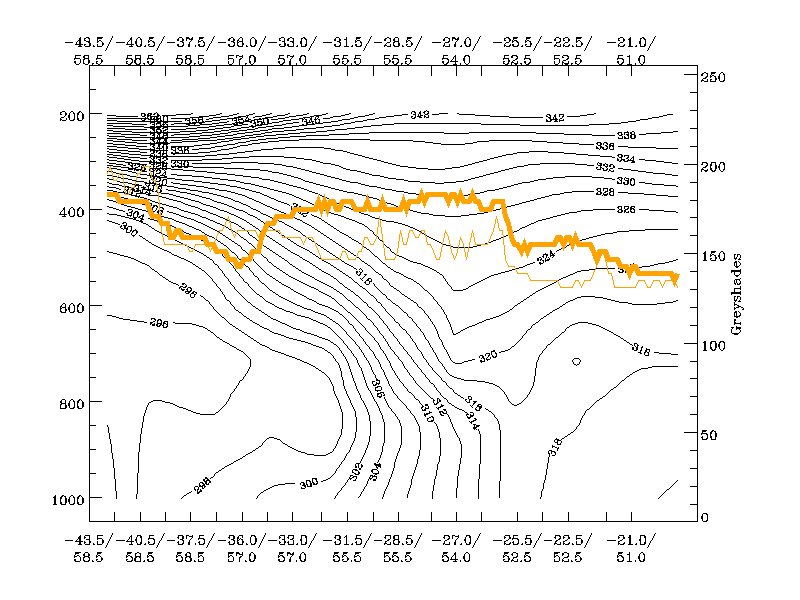
09 October 1999/01.00 UTC - Vertical cross section; black: isentropes (THETAE), orange thin: IR pixel values, orange thick: WV pixel values
|
|
|
The left image above shows the decay zone of the Cold Front over the Atlantic. The selected vertical cross section is indicated by a white line and is also shown in the right image. The selection of the isentropic surfaces was made in order to get the best impression of the inflow at low and middle levels (316K) of the frontal gradient zone, as well as to get information about the behaviour of the warm conveyor belt at high levels (322K) within and above the frontal zone.
|
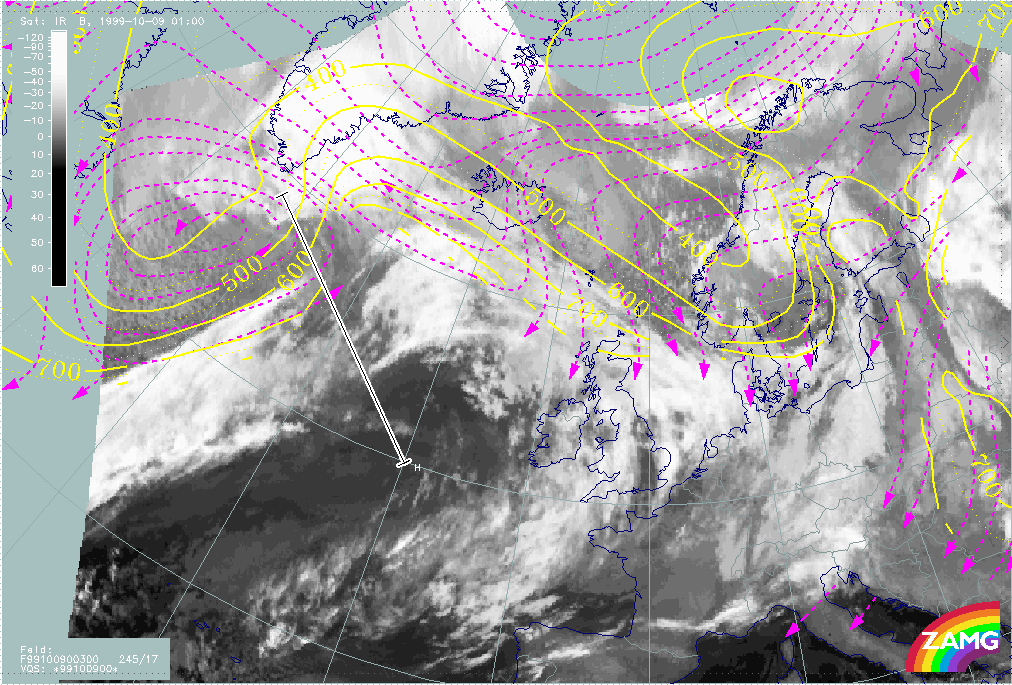
09 October 1999/01.00 UTC - Meteosat IR image; magenta: relative streams 300K - system velocity: 245° 17m/s, yellow: isobars 300K, position of vertical cross section indicated
|
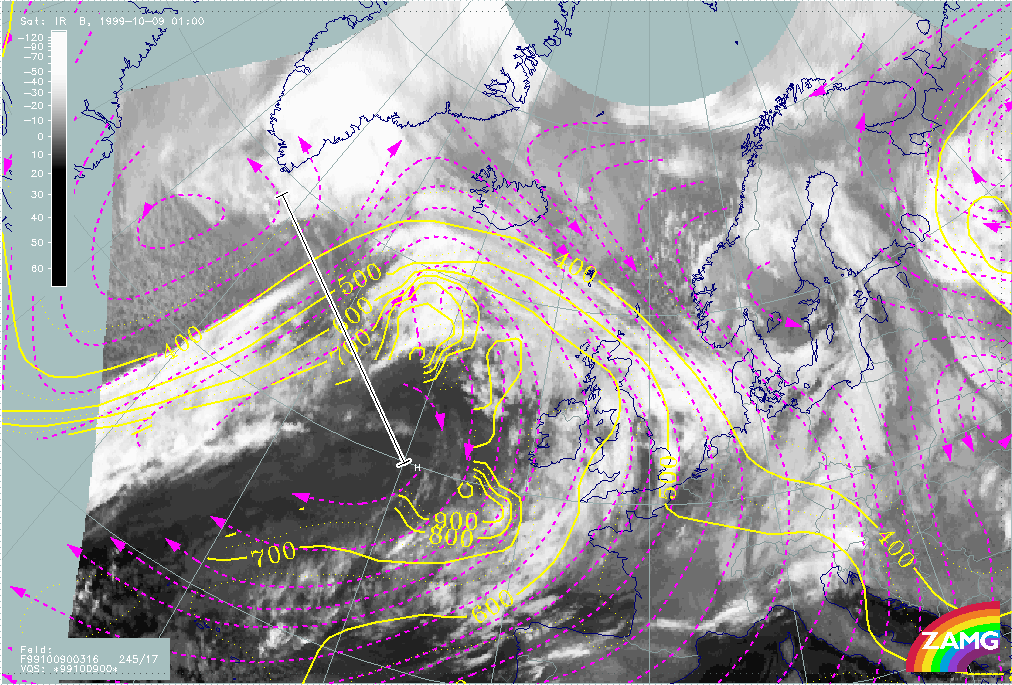
09 October 1999/01.00 UTC - Meteosat IR image; magenta: relative streams 316K - system velocity: 245° 17m/s, yellow: isobars 316K, position of vertical cross section indicated
|
|
|
In the left image above, the upper relative stream at the 300K isentropic surface can be observed sinking from about 600 hPa down to about 800 hPa in the area of cloud dissipation. In the right image above, the corresponding warm conveyor belt can be observed with the relative stream approximately parallel to the isohypses and gently rising.
A distinction can be made between cases with rising and sinking warm conveyor belts. In the case of a rising warm conveyor belt any gap within the frontal cloud band will probably close again, while in case of a sinking warm conveyor belt a complete dissipation of cloud in the IR imagery is probable.
Rising warm conveyor belt:
|
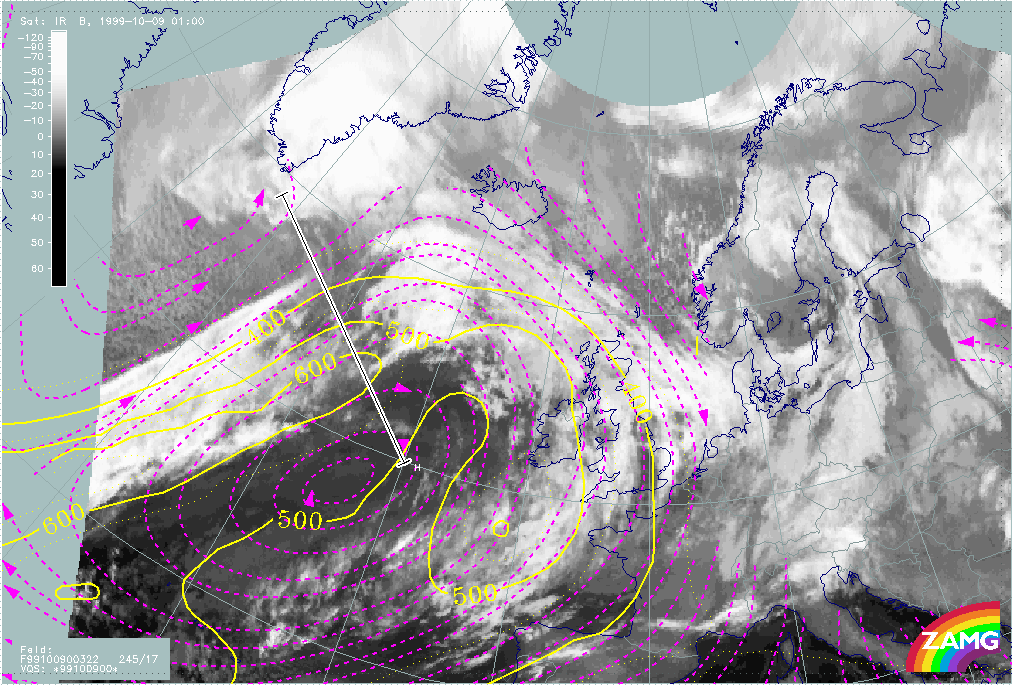
09 October 1999/01.00 UTC - Meteosat IR image; magenta: relative streams 322K - system velocity: 245° 17m/s, yellow: isobars 322K, position of vertical cross section indicated
|
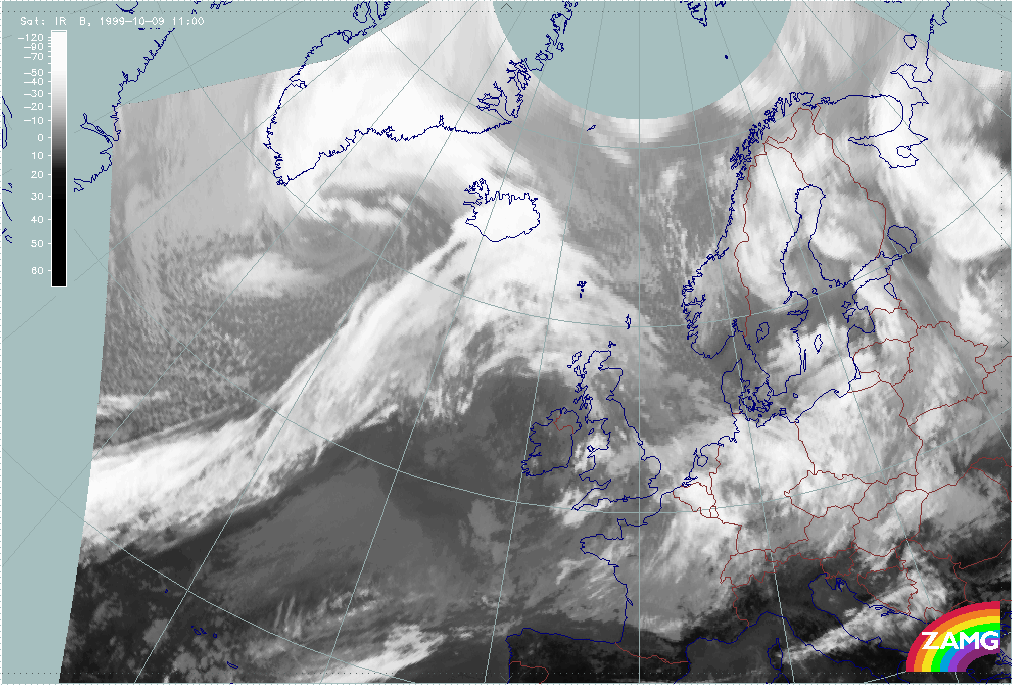
09 October 1999/11.00 UTC - Meteosat IR image
|
|
|
The left image above shows a weak rising warm conveyor belt at the isentropic surface at 322K over the area of decay. The right image shows that, 10 hrs later, the cloud gap has closed again.
Sinking warm conveyor belt:
|
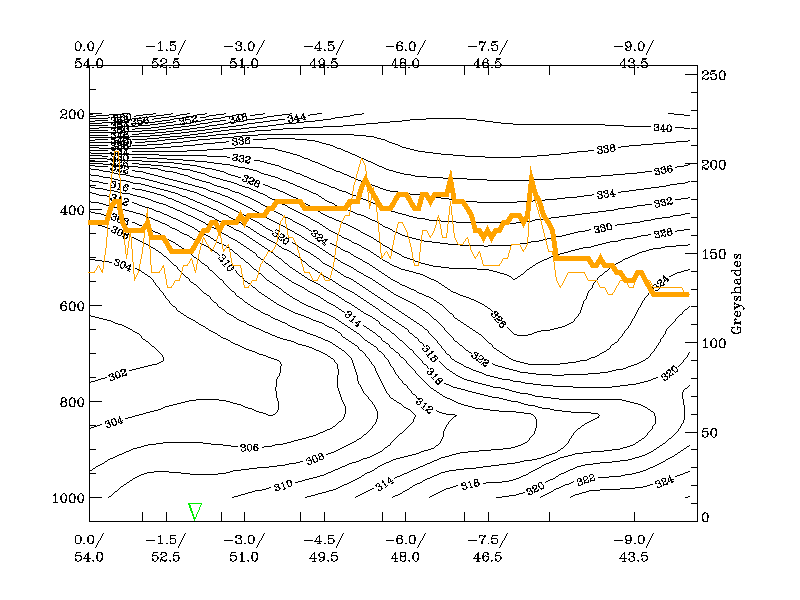
28 August 2006/06.00 UTC - Vertical cross section; black: isentropes (ThetaE), orange thin: IR pixel values, orange thick: WV pixel
|
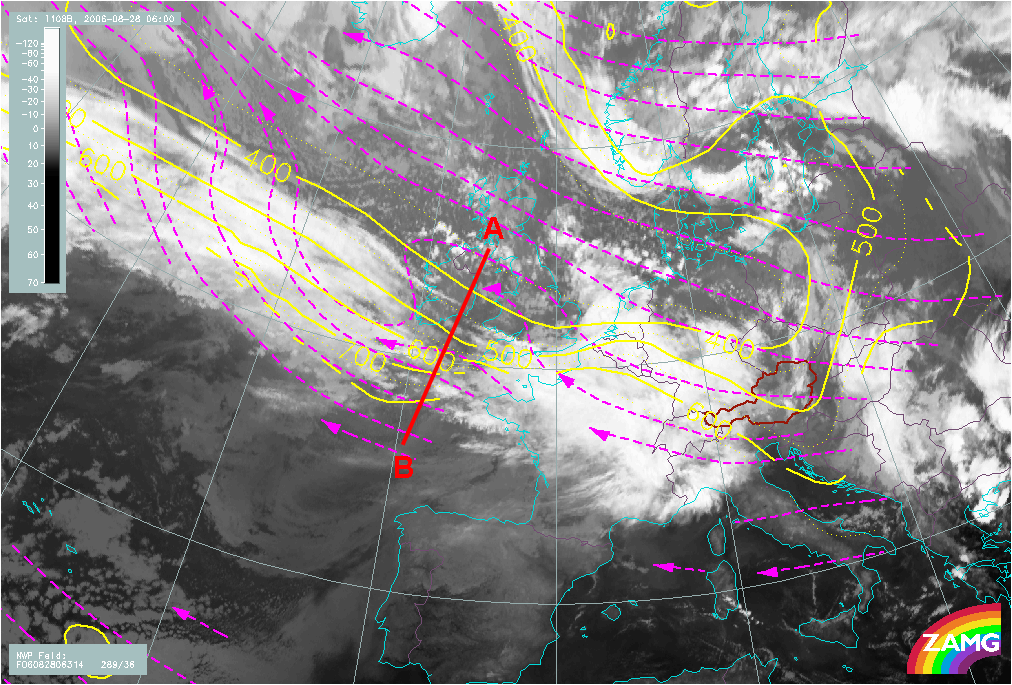
28 August 2006/06.00 UTC - Meteosat 8 IR10.8 image; magenta: relative streams 318K - system velocity: 289° 36m/s, yellow: isobars 318K; position of vertical cross section indicated
|
|
|
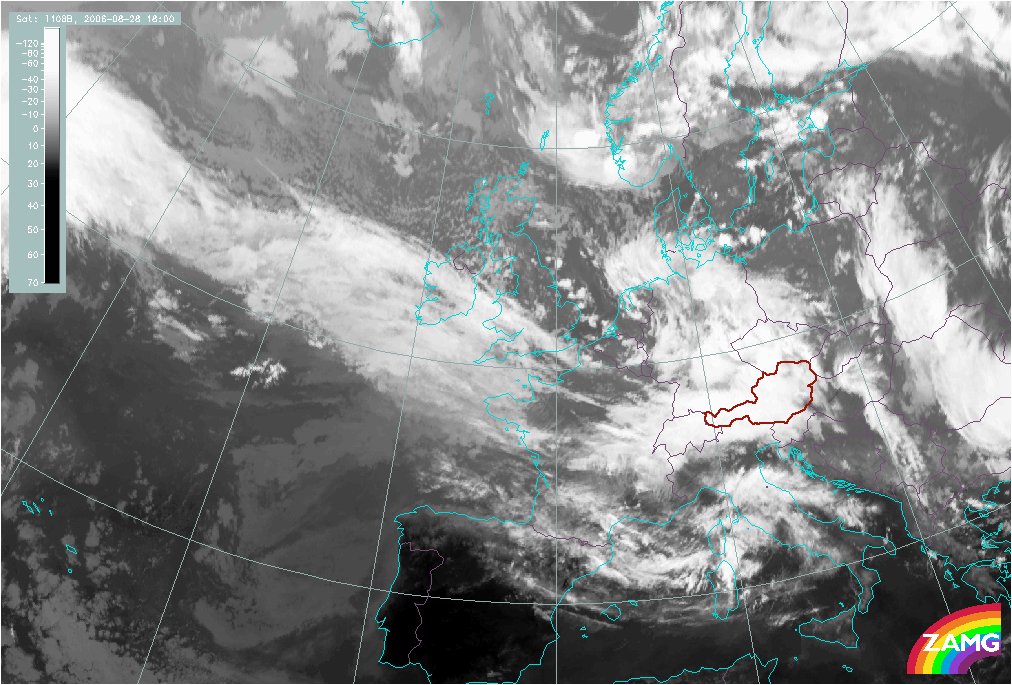
The right image above shows a sinking warm conveyor belt at the isentropic surface of 318K, which lies within the frontal gradient zone and inclined from about 400 hPa down to about 800 hPa over the area of the front decay. This situation results in a nearly complete dissipation of the cloud band, as seen in the IR10.8 image over Western France, some 12 hrs later (image below).
|
28 August 2006/18.00 UTC - Meteosat 8 IR10.8 image
|
|
About 70% of all investigated cases with inflow of air masses from within the system show an upper relative stream at lower levels and a warm conveyor belt (sinking or rising) at higher levels. Those cases are very similar to the conceptual sub model presented here. The remaining 30% show deviations from the concept (e.g. a dominating, sinking relative stream at all levels without any distinct warm conveyor belt at higher levels).
- The involvement of air masses originating from an area far behind the frontal system (e.g. because of a large low pressure system).
At low and middle levels there is a dry intrusion forming an acute angle with the frontal cloud band, together with a sinking or only very gently rising warm conveyor belt at higher levels above the zone of decay.
|
The following pictures display the relative streams of a case of a Cold Front over the eastern Atlantic when there is frontal dissolution in connection with air masses from far behind the system:
|
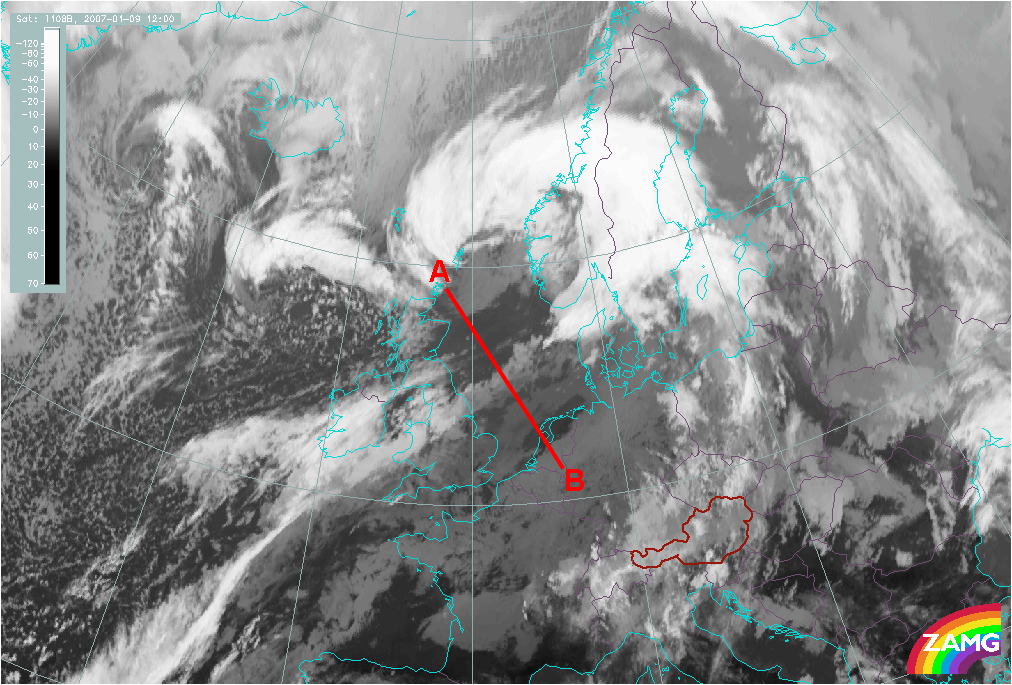
09 January 2007/12.00 UTC - Meteosat 8 IR10.8 image; position of vertical cross section indicated
|
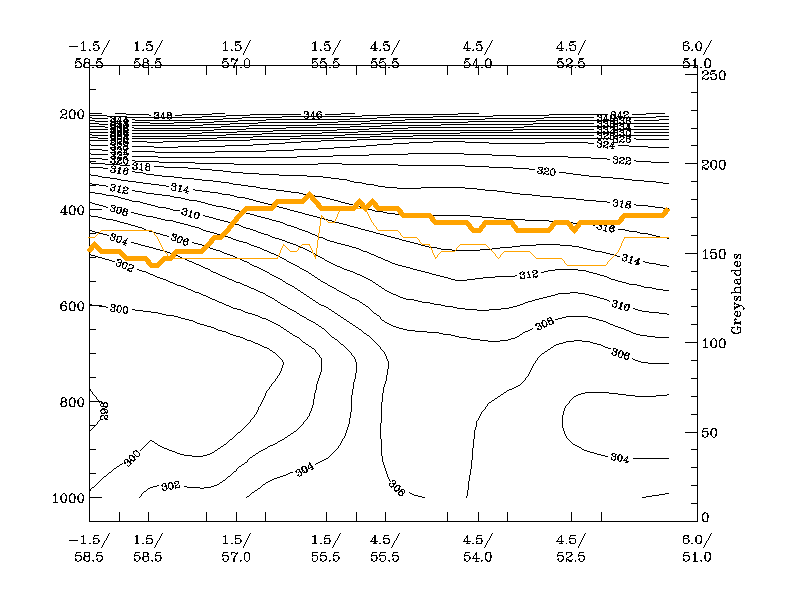
09 January 2007/12.00 UTC - Vertical cross section; black: isentropes (ThetaE), orange thin: IR pixel values, orange thick: WV pixel values
|
|
|
The left image shows the cloud dissipation zone of the Cold Front east of Great Britain. The vertical cross section is indicated by a white line and is presented in the right image. The selection of the isentropic surfaces was made in order to get an impression of the situation within the frontal surface at low levels (308K), as well for the warm conveyor belt at higher levels (316K) within or above the frontal surface.
|
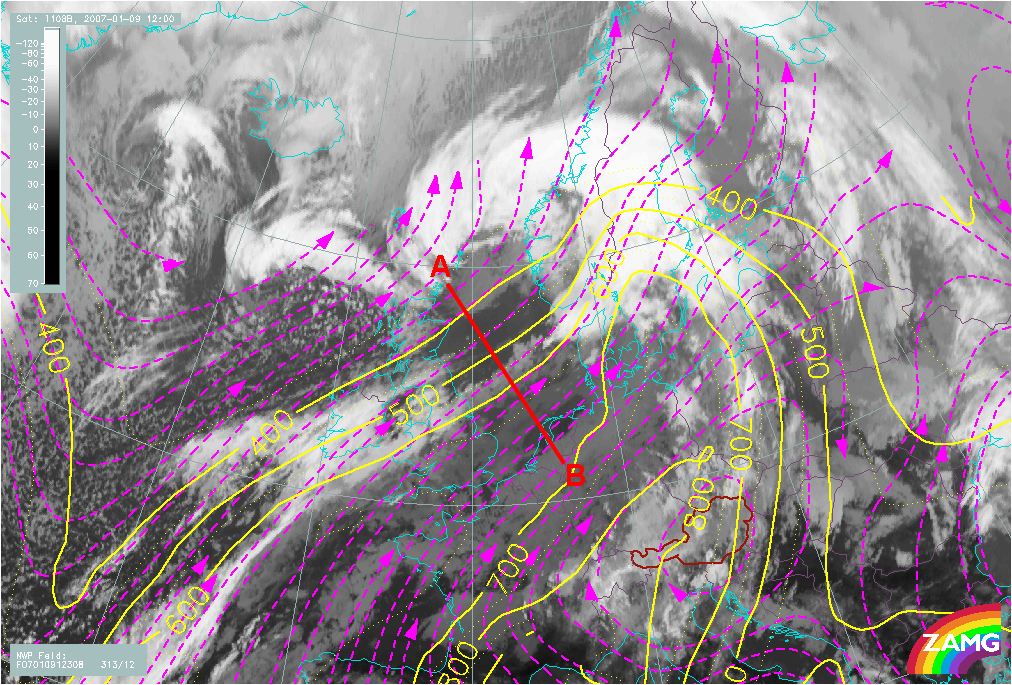
09 January 2007/12.00 UTC - Meteosat 8 IR10.8 image; magenta: relative streams 308K - system velocity: 313° 12m/s, yellow: isobars 308K; position of vertical cross section indicated
|
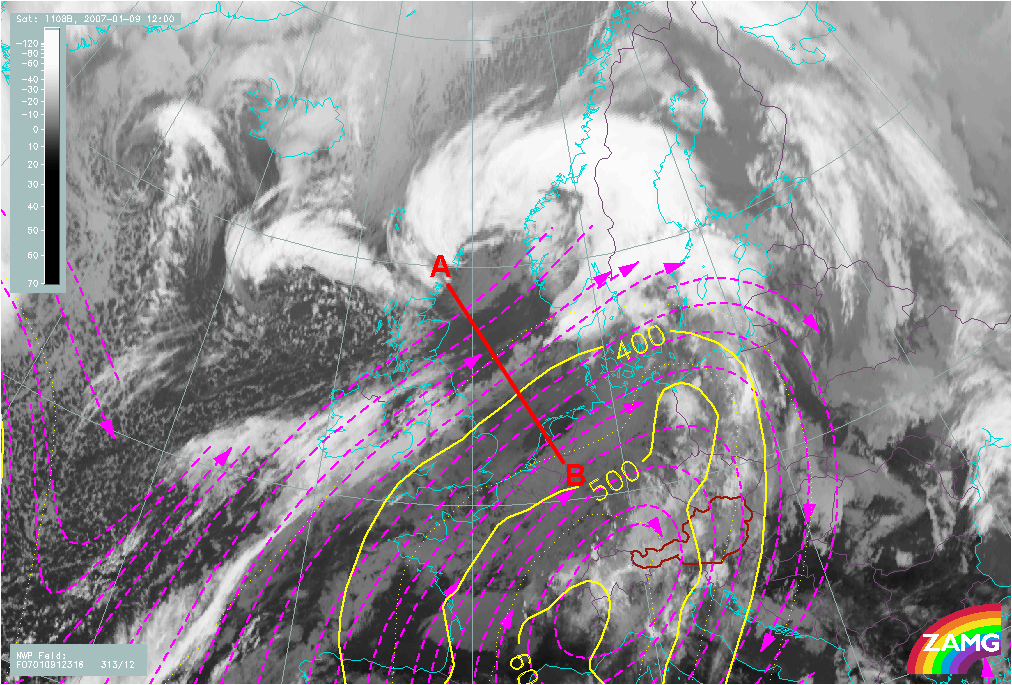
09 January 2007/12.00 UTC - Meteosat 8 IR10.8 image; magenta: relative streams 316K - system velocity: 313° 12m/s, yellow: isobars 316K; position of vertical cross section indicated
|
|
|
The left image above shows the distribution of relative streams at an isentropic surface of 308K. The upper relative streams with their origin in cold dry air from far behind the front sink rapidly from about 400 hPa down to about 600 hPa over the area of cloud decay. The warm conveyor belt at 316K gently sinks to about 400 hPa in the above right image.
The majority (60%) of all investigated cases with inflow of air from behind the system fit the model of a sinking upper relative stream at middle levels and a sinking or weakly rising warm conveyor belt very well. The remaining cases again show deviations from this conceptual sub model (e.g. a sinking warm conveyor belt at all levels and no upper relative stream).
- An inflow of air masses influenced by a second system immediately behind the front (e.g. Comma cloud or a cold air development).
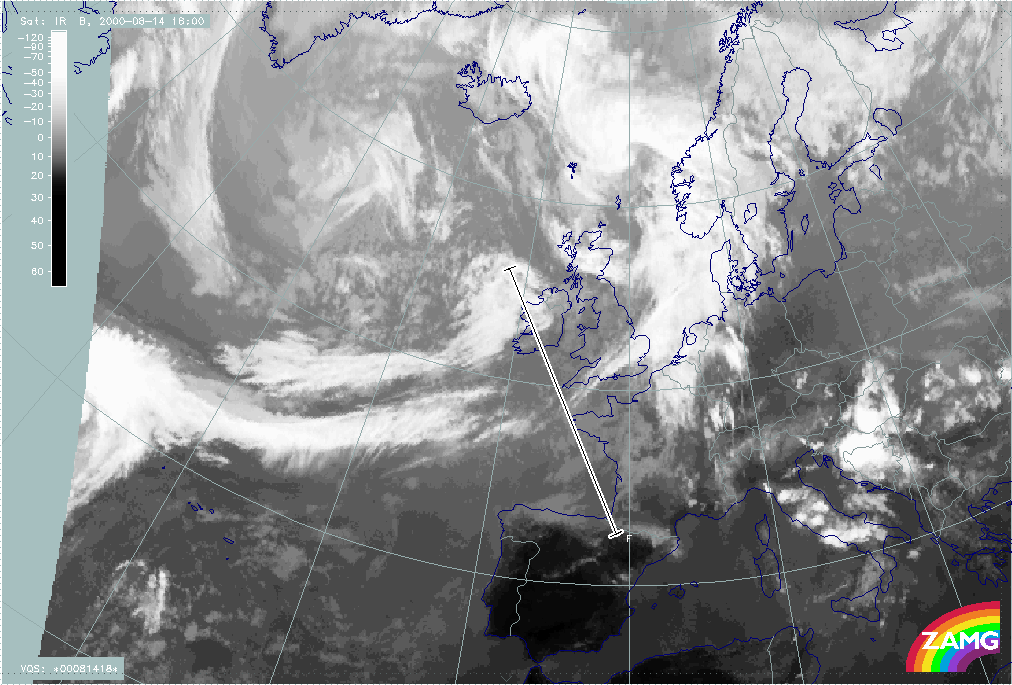
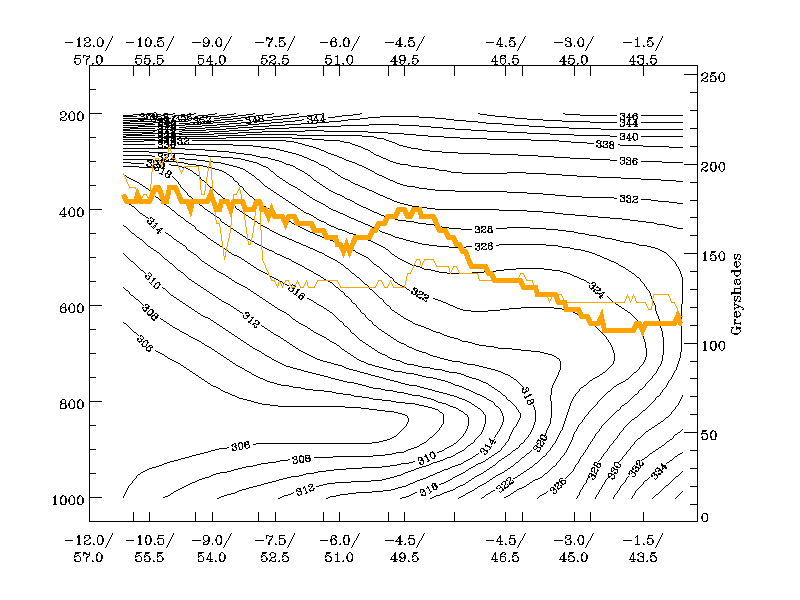
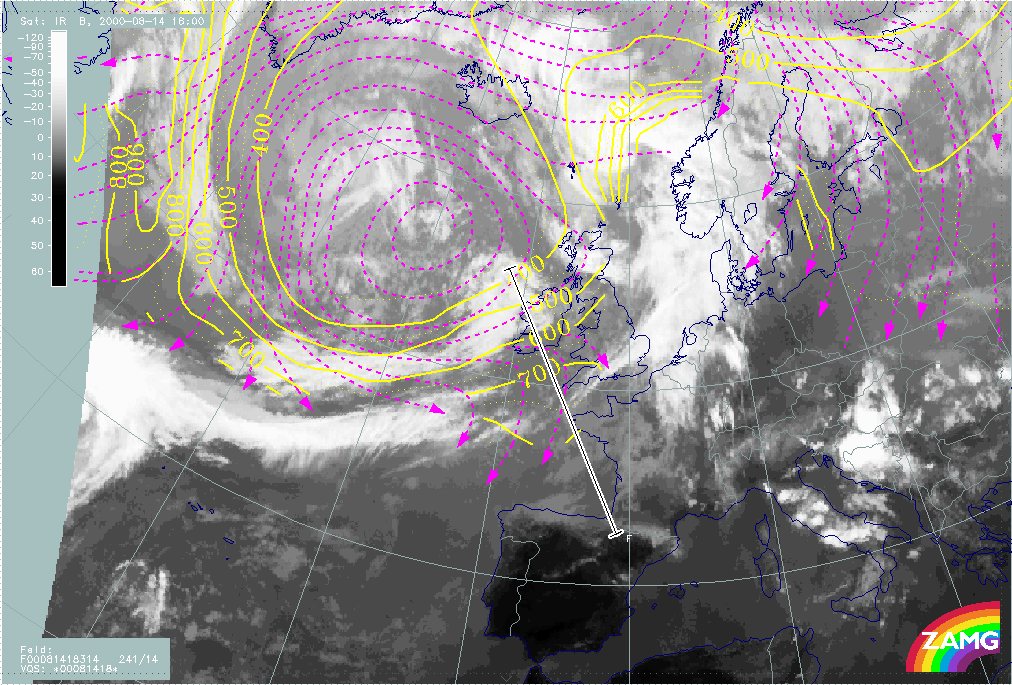
- Only a few cases (5%) of this type are available. There seems to be a particular characteristic behaviour in the relative stream. A thick sinking relative stream (probably a dry intrusion) can be observed, crossing the frontal cloud band at an acute angle at all levels. There is no warm conveyor belt configuration associated with this type of Front Decay.
|
|
14 August 2000/18.00 UTC - Meteosat IR image; position of vertical cross section indicated
|
14 August 2000/18.00 UTC - Vertical cross section; black: isentropes (ThetaE), orange thin: IR pixel values, orange thick: WV pixel
|
|
|
The left image shows the dissolution zone of the Cold Front south west of Great Britain. The vertical cross section is indicated by a white line and is presented in the right image. The selection of the isentropic surface at 314K represents the typical distribution of the relative streams at all levels.
|
14 August 2000/18.00 UTC - Meteosat IR image; magenta: relative streams 314K - system velocity: 241° 14m/s, yellow: isobars 314K, position of vertical cross section indicated vertical cross section indicated
|
|
The Front Decay case in the above image shows an approaching Comma cloud (cold air development) to the rear of the frontal cloud band. The relative streams at the isentropic surface of 314K indicate a strong downward motion from 600 hPa to 800 hPa across the zone of decay. Considering the low number of cases of this type, it can be assumed that about 50% of cases show a sinking upper relative stream at all levels and, therefore, correspond to this third conceptual sub model. The remaining 50% show various deviations: e.g. a sinking or rising warm conveyor belt at higher levels, or the influence of a second approaching Cold Front leading to a saddle pattern in the relative streams over the zone of decay.
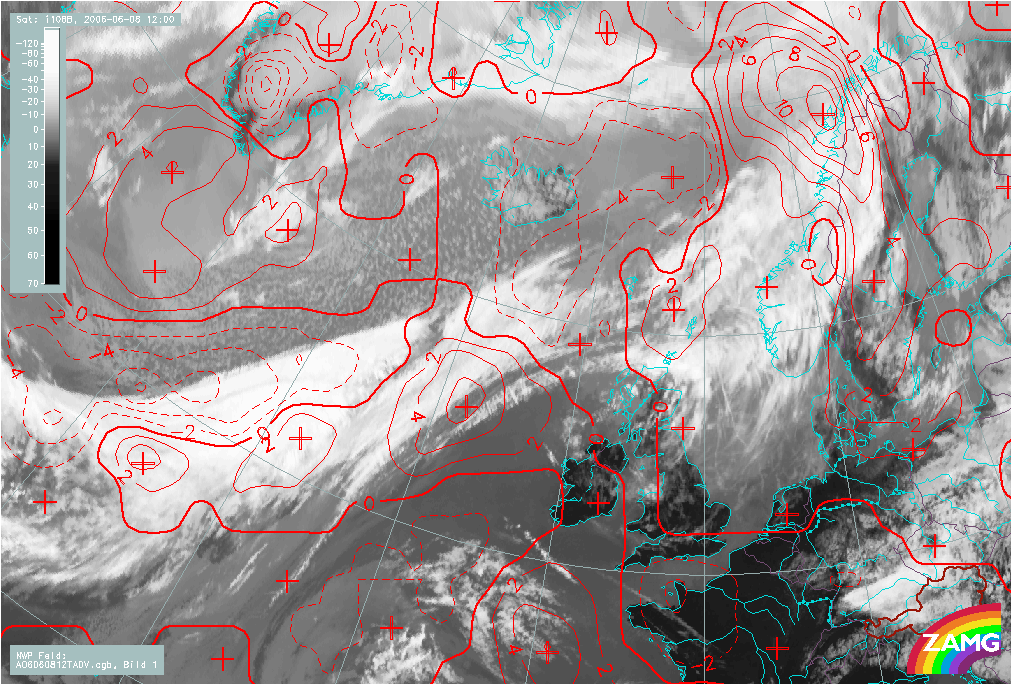
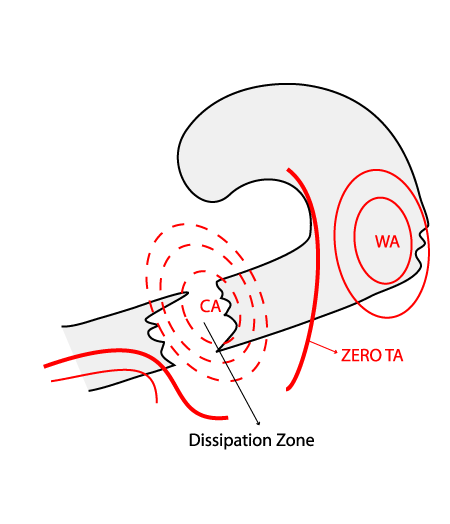
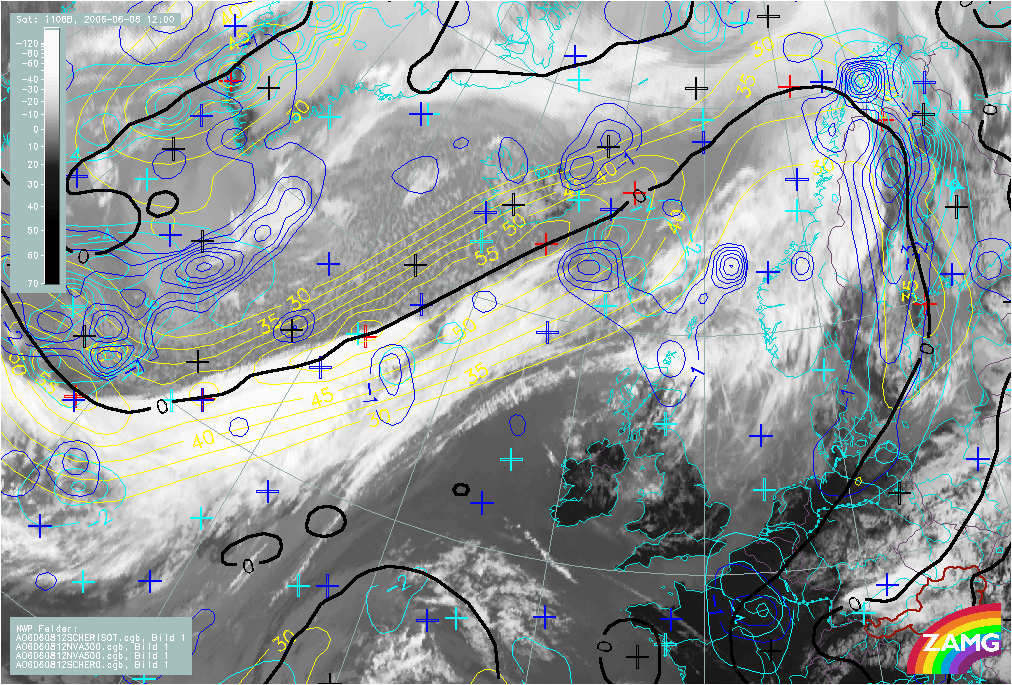
The sinking relative streams are well reflected in the temperature advection fields as distinct CA, which appears within as well as in front of the frontal cloud band. A sharp transition between WA and CA, crossing the frontal band perpendicularly, almost corresponds to the boundaries of the cloud gap.
|
08 June 2006/12.00 UTC - Meteosat 8 IR10.8 image; red dashed: temperature advection - CA 700 hPa, red solid: temperature advection - WA 700 hPa
|
|
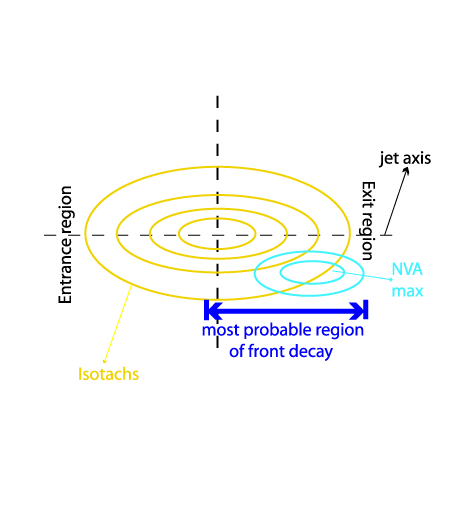
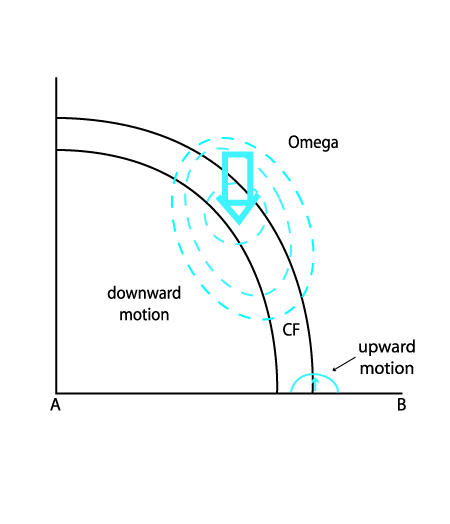
Another aspect of the physical meteorological background relates to the upper level jet streak, and is described in the chapter addressing the conceptual model "front intensification by jet". Regarding the position to the jet streak, it is well known that the right entrance region and the left exit region are areas of frontal intensification combined with positive vorticity advection at high levels, with convergence and distinct upward motion at low and mid levels. On the other hand the left entrance region and the right exit region should lead to frontolysis or at least cloud dissolution in connection with negative vorticity advection at high levels, divergence and downward motion in middle levels.
On this basis a Front Decay would be expected in the right exit region, of a jet in an area of distinct downward motion, especially if there is an acute angle between the jet and the frontal cloud band. In reality, this was only found in 30% of all investigated cases. In the diagrams below the most probable area of Front Decay lies along the anticyclonic side of the jet, between the exit region and the jet core. If the process of downward motion over the cloud gap is fully mature, there should also be a distinct maximum of negative vorticity advection.
|
Key Parameters
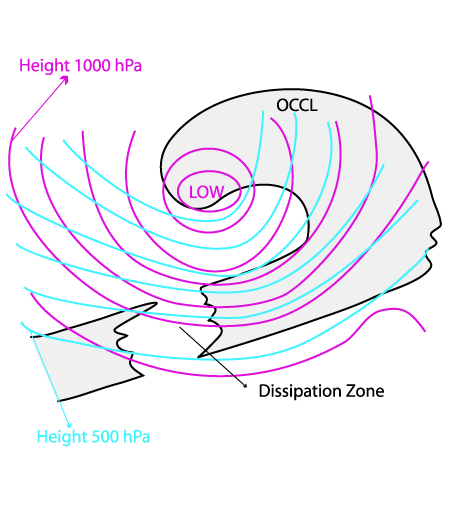
- Height contours at 1000 hPa and 500 hPa:
- Upper level and low level trough corresponding to the frontal system in all stages of life cycle of Front Decay
- Acute angle between isolines of surface low and Upper Level Low indicating cold advection
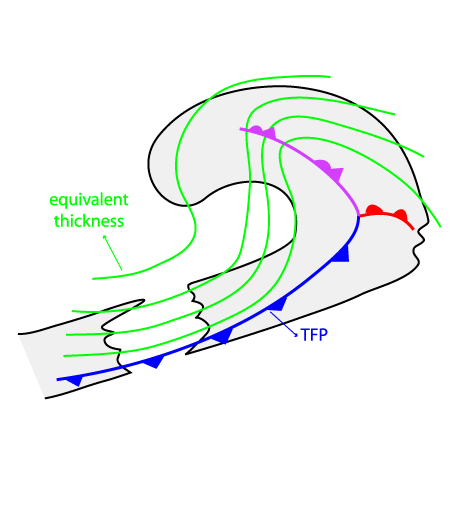
- Thermal front parameter (TFP) and equivalent thickness:
- Zone of high gradient of equivalent thickness to the rear of the cloud band
- Maximum of the TFP accompanies the cloud band
- Weakening of the thermal front parameter at the end of the life cycle of a Front Decay is possible
- Temperature advection (TA) at 700 hPa:
- Very distinct maximum of CA over the dissipation zone within the frontal cloud band
- Zero line of TA appears almost at right angles to the front line
- No difference between the 3 types of conceptual sub model
- CA remains mostly constant in the life cycle, although a few cases show some weakening at the mature stage of Front Decay
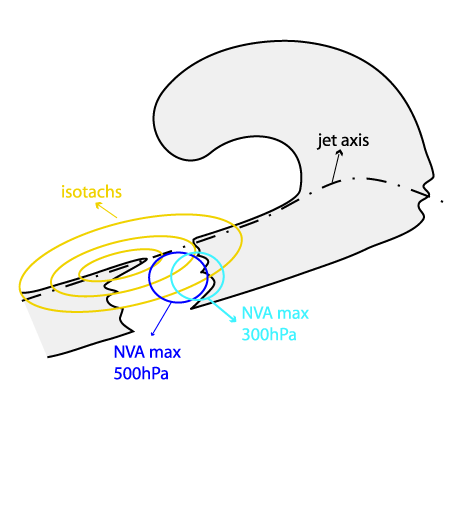
- Isotachs at 300 hPa:
- Isotachs at 300 hPa show a pronounced jet streak along the rear edge of the frontal cloud band
- Jet axis mostly parallel to the rear edge of frontal cloud band over the dissipation zone (only 30% of all cases show acute angle between jet axis and cloud band)
- The cloud gap of the Front Decay is always located on the anticyclonic side of the jet axis, near the centre and/or the right exit region of a jet streak
- Vorticity advection at 500 and 300 hPa (VA):
- Field of vorticity advection shows an NVA at 500 as well as at 300 hPa, maximum, mostly associated with the right exit region of the jet streak
- Maxima of NVA at 500 hPa and 300 hPa intensify at a more mature stage in the lifecycle of the Front Decay
- Higher coincidence between NVA maxima and the cloud gap, if the dissipation zone is situated in the right exit region of a jet streak
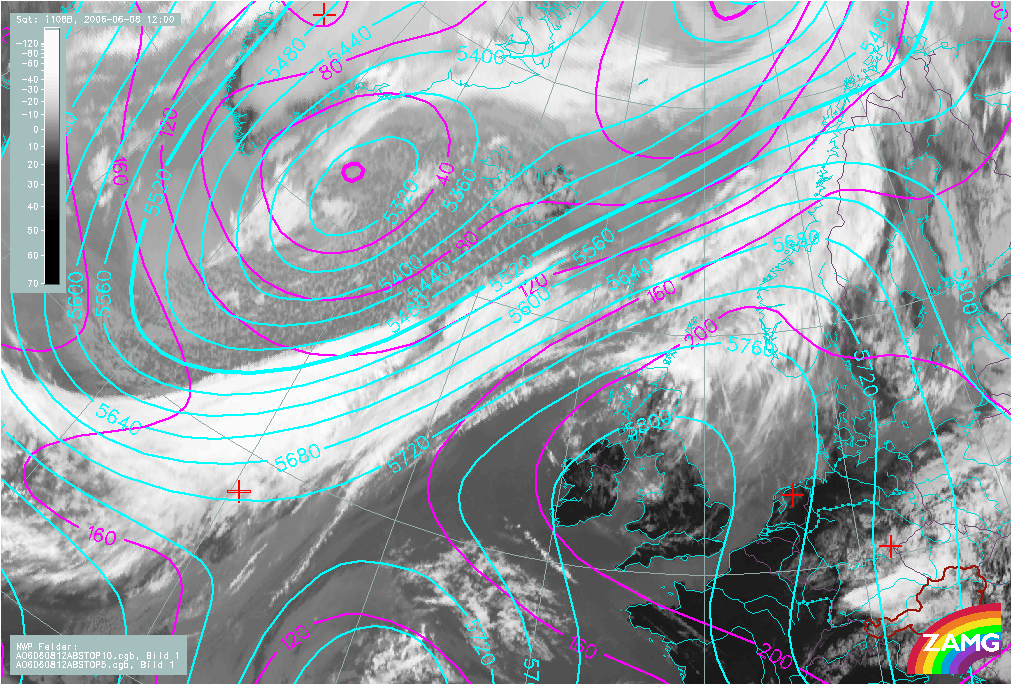
Height contours at 1000 and 500 hPa
|
08 June 2006/12.00 UTC - Meteosat 8 IR10.8 image; magenta: height contours 1000 hPa, cyan: height contours 500 hPa
|
|
|
|
Thermal front parameter (TFP) and equivalent thickness
|
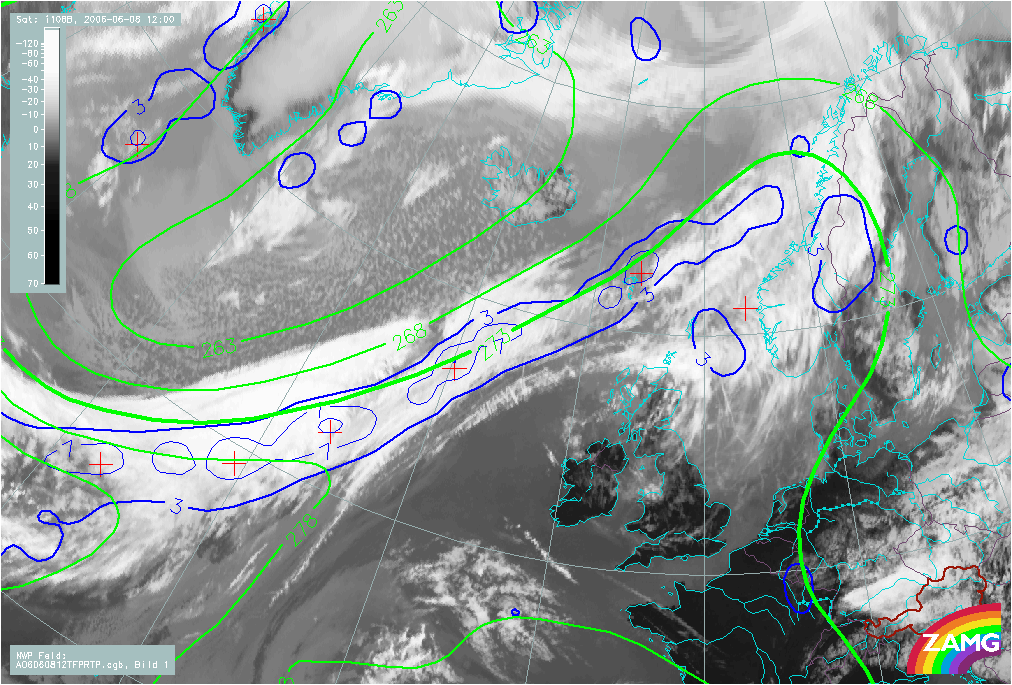
08 June 2006/12.00 UTC - Meteosat 8 IR10.8 image; blue: thermal front parameter 500/850 hPa, green: equivalent thickness 500/850 hPa
|
|
|
|
Temperature Advection at 700 hPa
|
08 June 2006/12.00 UTC - Meteosat 8 IR10.8 image; red dashed: temperature advection - CA 700 hPa, red solid: temperature advection - WA 700 hPa
|
|
|

|
Isotachs at 300 hPa and vorticity advection at 500 and 300 hPa (VA)
|
08 June 2006/12.00 UTC - Meteosat 8 IR10.8 image; blue: negative vorticity advection 500 hPa, cyan: negative vorticity advection 300 hPa, yellow: isotachs 300 hPa, black: zero line of shear vorticity 300 hPa
|
|
|
|
Typical Appearance In Vertical Cross Sections
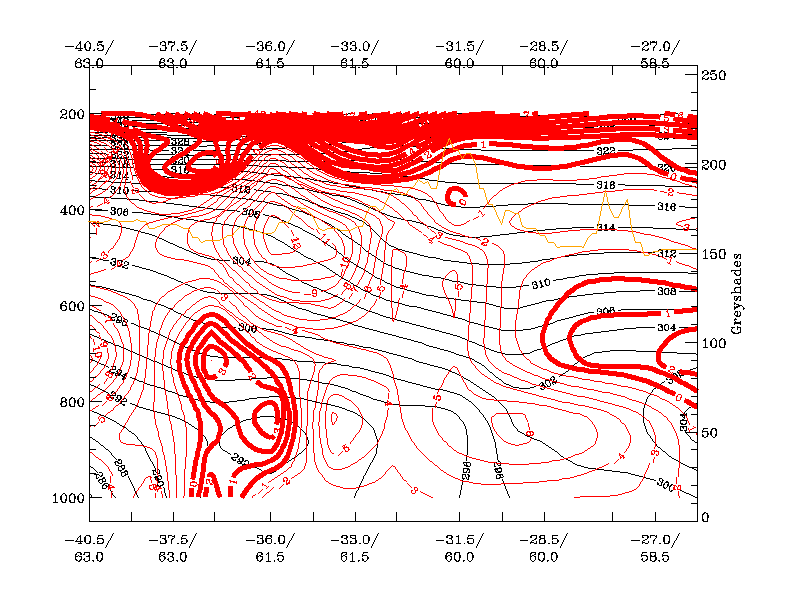
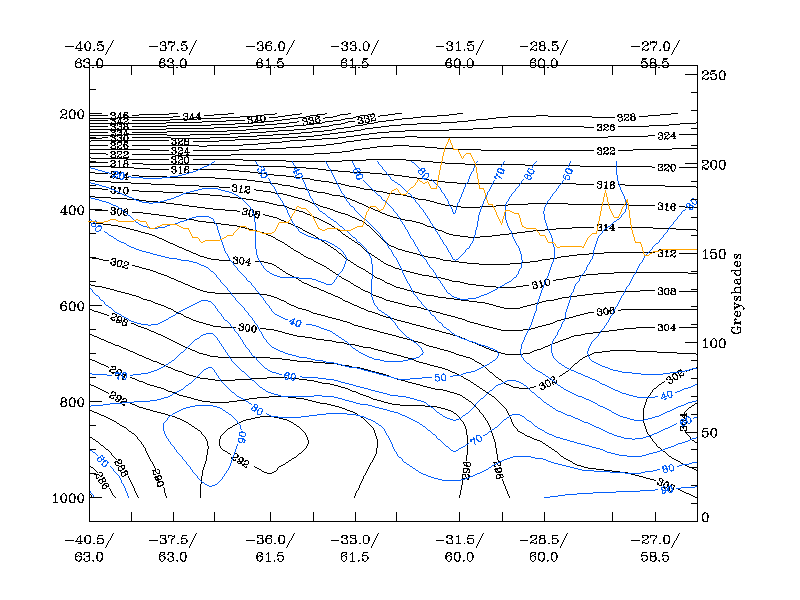
Though there is cloud dissipation in the area of Front Decay, vertical cross sections from the numerical model still show a downward inclined compact zone of moist isentropes (equivalent potential temperature). However, derived parameters of TA, vertical motion, humidity and divergence all indicate cloud dissipation.
- Temperature advection: The decaying part of the frontal cloud band is completely positioned in CA at all levels, or at least only at upper or lower levels.
- The relative humidity has a minimum at high and middle levels, which can be interpreted as dry (cold) descending air within the frontal zone
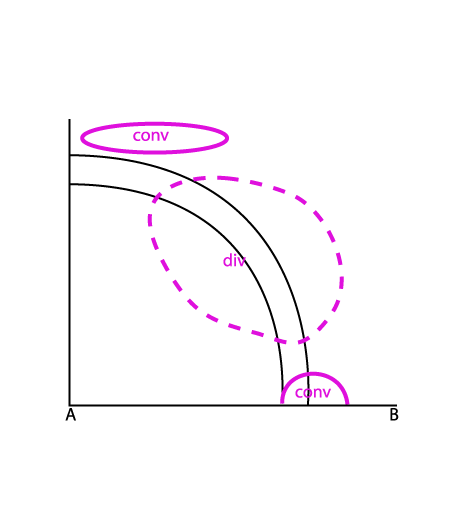
- There is a pronounced zone of divergence below and within the frontal surface and convergence above, which is in contrast to the classical CF.
- The field of vertical motion is characterised by positive values within the gradient zone indicating distinct descent. This is in contrast to the classical CF. Cases with remaining low level cloudiness show rising at low and middle levels in front of the gradient zone.
|
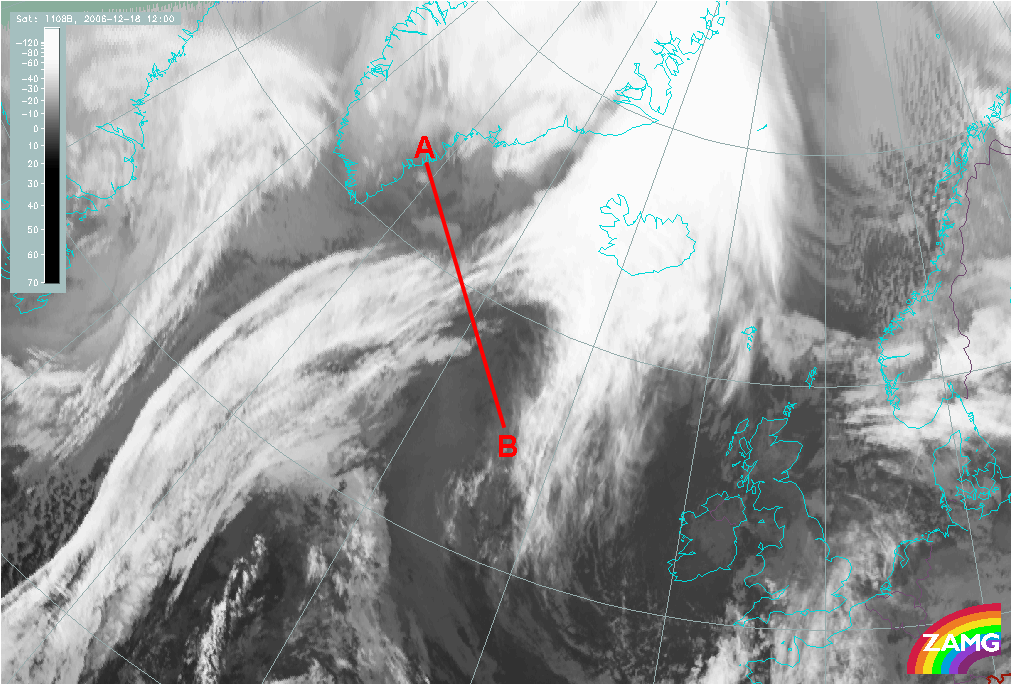
18 December 2006/12.00 UTC - Meteosat 8 IR10.8 image; position of vertical cross section indicated
|
|
|
|
Temperature advection: vertical cross sections from numerical model
|
18 December 2006/12.00 UTC - Vertical cross section; black: isentropes (ThetaE), red thick: temperature advection - WA, red thin: temperature advection - CA, orange thin: IR pixel values
|
|
|
|
Relative humidity: vertical cross sections from numerical model
|
18 December 2006/12.00 UTC - Vertical cross section; black: isentropes (ThetaE), blue: relative humidity, orange thin: IR pixel values
|
|
|
|
Divergence
|
18 December 2006/12.00 UTC - Vertical cross section; black: isentropes (ThetaE), magenta thin: divergence, magenta thick: convergence, orange thin: IR pixel values
|
|
|
|
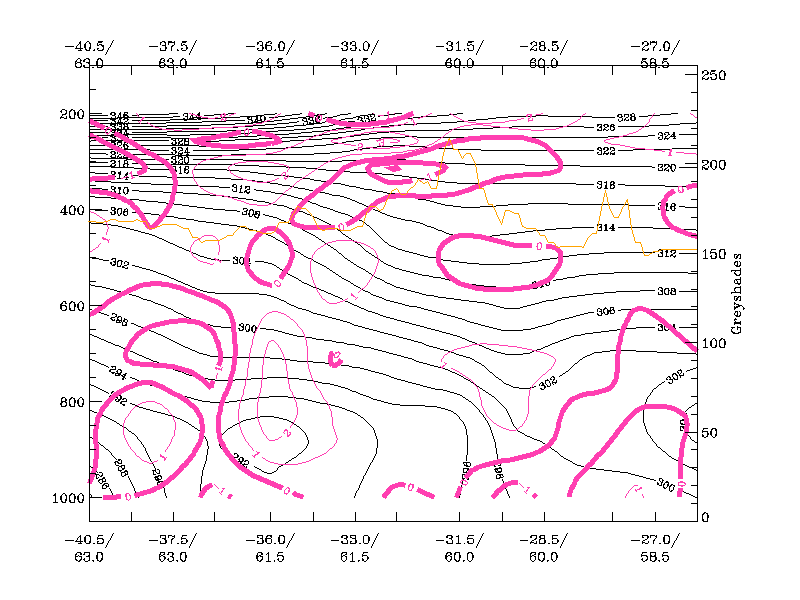
Vertical motion (Omega): vertical cross sections from numerical model
|
18 December 2006/12.00 UTC - Vertical cross section; black: isentropes (ThetaE), cyan thick: vertical motion (omega) - upward motion, cyan thin: vertical motion (omega) - downward motion, orange thin: IR pixel values
|
|
|
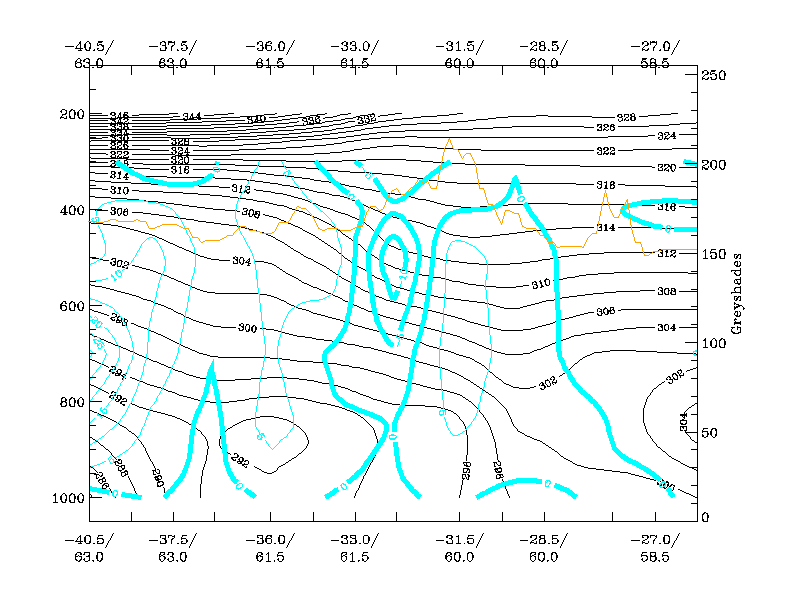
|
Weather Events
The CM of Front Decay represents a meso - scale modification of a Cold Front which leads to decay of weather events, especially of precipitation.
| Parameter | Description |
| Precipitation |
|
| Temperature |
|
| Wind |
|
| Cloud |
|
| Other relevant information | - |
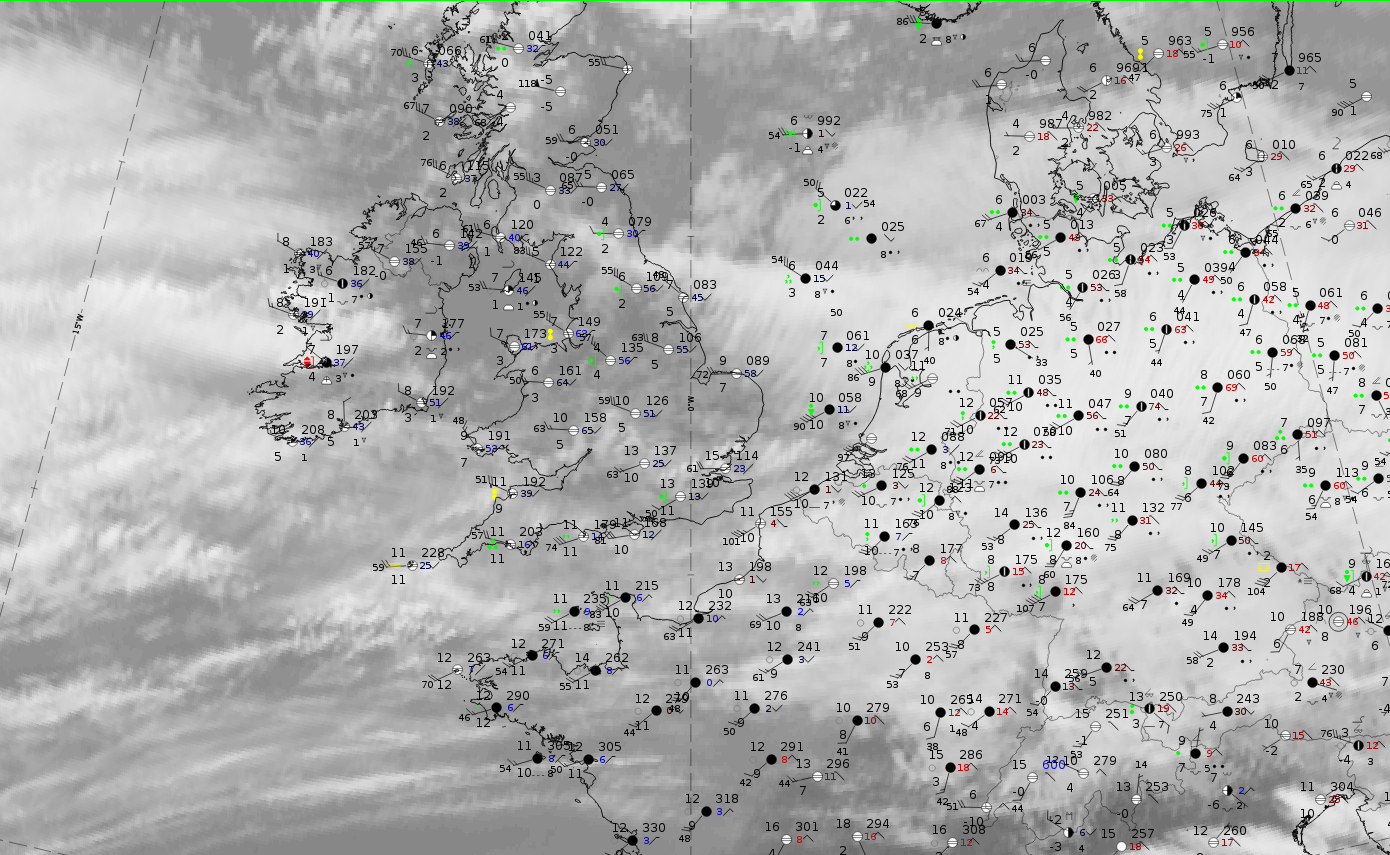
For illustrating the weather within and around an area of Front Decay, the case of 23 February 2020 at 12 UTC is chosen. In the area of Front Decay, cloud fraction over Southern England has nearly completely dissipated. The clouds associated with the cold front band consists mostly of high ice cloud, shown in a black colour.
Legend: 23 February 2020 at 12 UTC; Dust RGB
|
|
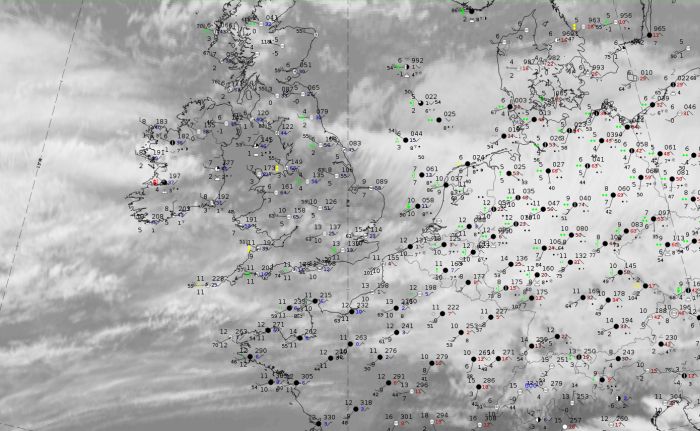
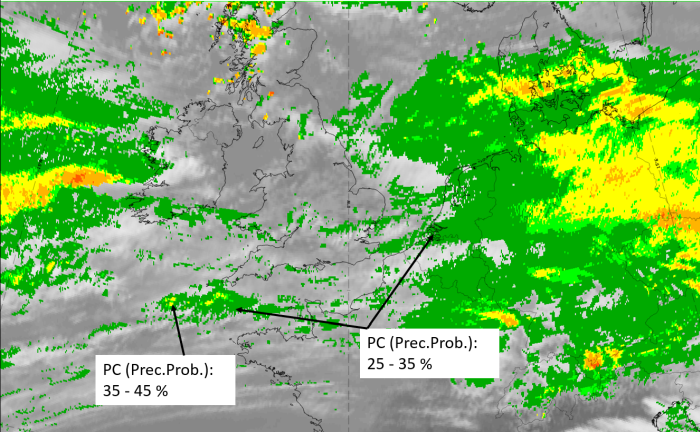
Legend: 23 February 2020 at 12UTC: IR + synoptic measurements (above) + probability of moderate rain (Precipitting clouds PC - NWCSAF).
Note: for a larger SYNOP image click this link.
Nearly all stations report heavy rain in the frontal cloud band to the east of the Frontal Decay area; here there are some reports of rain in the last 6 hours. The probability of moderate rain from NWCSAF is zero in the Front Decay area. On some cloud patches in the rest of the cold front band to the south, NWCSAF probabilities only reach 35 - 45 %.
|
|
|
|
Legend: 23 February 2020 at 12 UTC, IR ; superimposed:
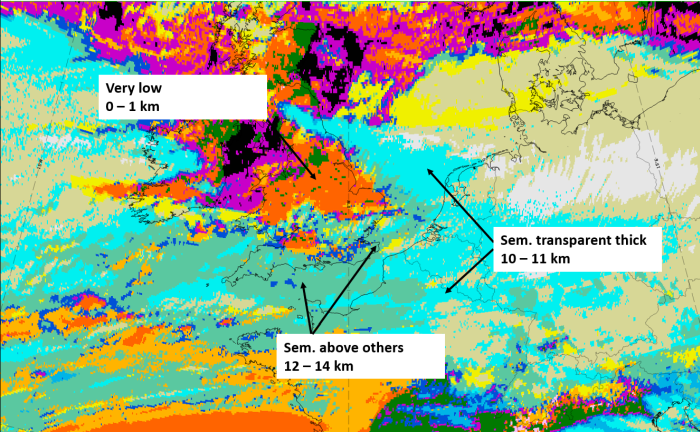
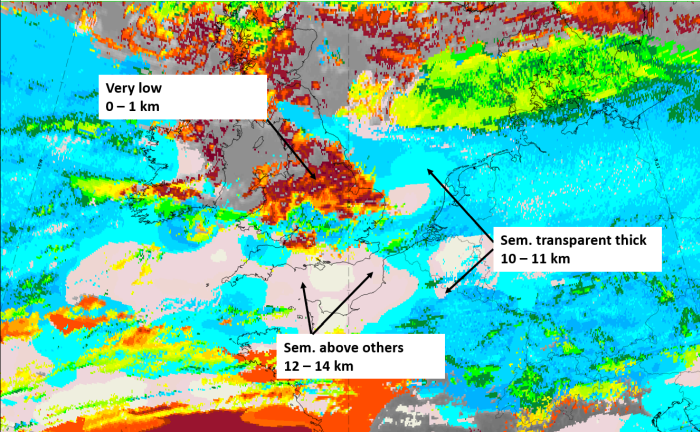
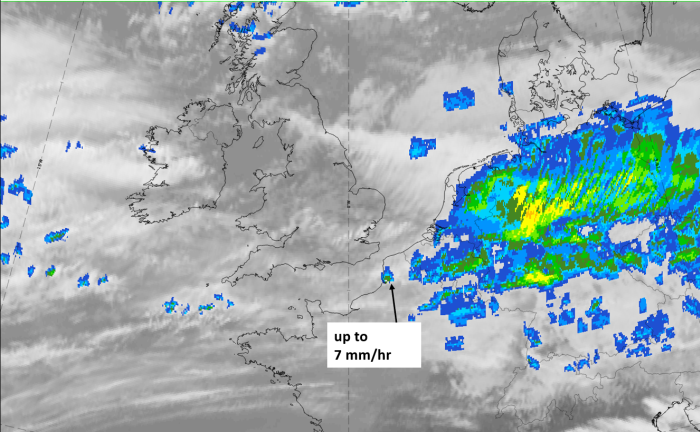
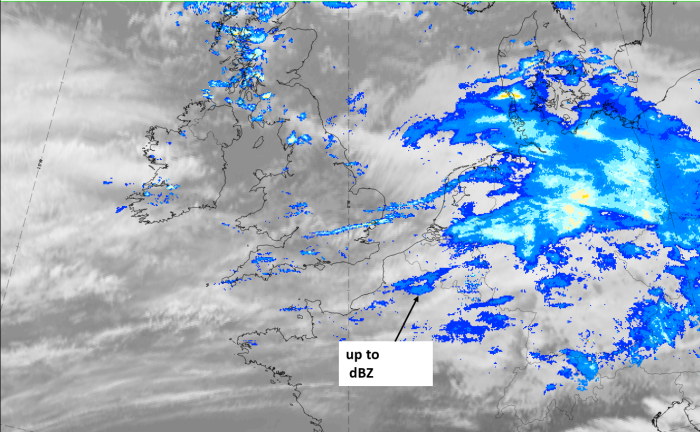
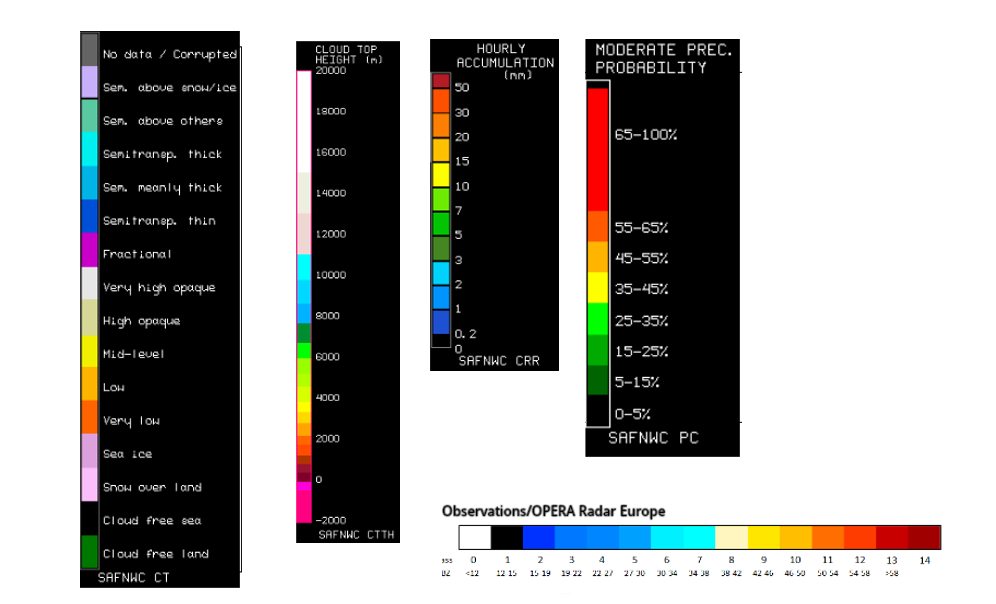
1st row: Cloud Type (CT NWCSAF) (above) + Cloud Top Height (CTTH - NWCSAF) (below); 2nd row: Convective Rainfall Rate (CRR NWCSAF) (above) + Radar intensities from Opera radar system (below).
For identifying values for Cloud type (CT), Cloud type height (CTTH), precipitating clouds (PC), and Opera radar for any pixel in the images look into the legends. (link).
References
General Meteorology and Basics
- BLUESTEIN, H.B., 1993: Synoptic Dynamic Meteorology in Midlatitudes, Volume II, Oxford Univ. Press
- BROWNING K. A. (1990): Organization of clouds and precipitation in extratropical cyclones; in: Extratropical Cyclones, The Erik Palmen Memorial Volume, Ed. Chester Newton and Eero O Holopainen, p. 129 - 153
- DAVIS C. A. and EMANUEL K. A. (1991): Potential vorticity diagnostic of cyclogenesis; Mon. Wea. Rev., Vol. 119, p. 1929 - 1953
- ELIASSEN, A., 1962: On the Vertical Circulation in Frontal Zones. Geophys. Publ. 24, pp147
- HOSKINS B. J., MCINTYRE M. E. and ROBERTSON A. L. W. (1985): On the use and significance of isentropic potential vorticity maps; Quart. J. R. Meteor. Soc., Vol. 111, p. 877 - 946
- HOSKINS, B.J., DRAGHICI, I., DAVIES, H.C., 1978: A New Look at the Omega Equation, Quart. J. R. Meteorol. Soc., pp31
- KURZ M. (1990): Synoptische Meteorologie - Leitfäden für die Ausbildung im Deutschen Wetterdienst; 2. Auflage, Selbstverlag des Deutschen Wetterdienstes
General Satellite Meteorology
- BADER M. J., FORBES G. S., GRANT J. R., LILLEY R. B. E. and WATERS A. J. (1995): Images in weather forecasting - A practical guide for interpreting satellite and radar imagery; Cambridge University Press
- ZWATZ-MEISE V. (1987): Satellitenmeteorologie; Springer Verlag, Berlin - Heidelberg - New York - London - Paris - Tokyo
- ZWATZ-MEISE V. and MAHRINGER G. (1990): SATMOD: An interactive system combining satellite images and model output parameters; Weather and Forecasting, Vol. 5, p. 233 - 246
Specific Satellite Meteorology
- BROWNING, K.A., HARROLD, T.W.: Air Motion and Precipitation Growth in a Wave Depression. Quart. J. R. Meteorolog. Soc. 95 (1969), pp288
- LEY, B.E., 1978: Wave Generation and Frontal Collapse. J. Atmos. Sci., 35, pp3
- MARTIN J. E., LOCATELLI J. D. and HOBBS P. V. (1992): The synoptic evolution of a deep tropospheric frontal circulation and attendant cyclogenesis; 5th Conference on Mesoscale Processes, Atlanta, Georgia, 5 - 10 January 1992
- SAWYER, J.S., 1956: The Vertical Circulation at Meteorological Fronts and its Relation to Frontogenesis, Proc. Roy. Soc. A. 234, pp246
- SHAPIRO M. A. (1981): Frontogenesis and geostropically forced secondary circulations in the vicinity of jet stream - frontal zone systems; J. Atmos. Sci., Vol. 38, p. 954 - 973
- ZWATZ-MEISE V. (1990): Use of satellite images for diagnosis and prognosis of certain jet streak phenomena; Proceedings of 8 th Meteosat Scientific Users' meeting, Norrköping, Sweden, 28 - 31 August 1990, p. 151 - 160