Cloud Structure In Satellite Images
Front Decay describes a substructure in Cold Front cloud bands. Satellite images show a temporary or complete meso- to subsynoptic scale dissipation of cloudiness within a frontal cloud band. The life cycle of this mechanism ranges from 6 to 24 hours. The investigation was based on 48 cases, where 27 cases were addressed in detail.
Appearance in the basic channels
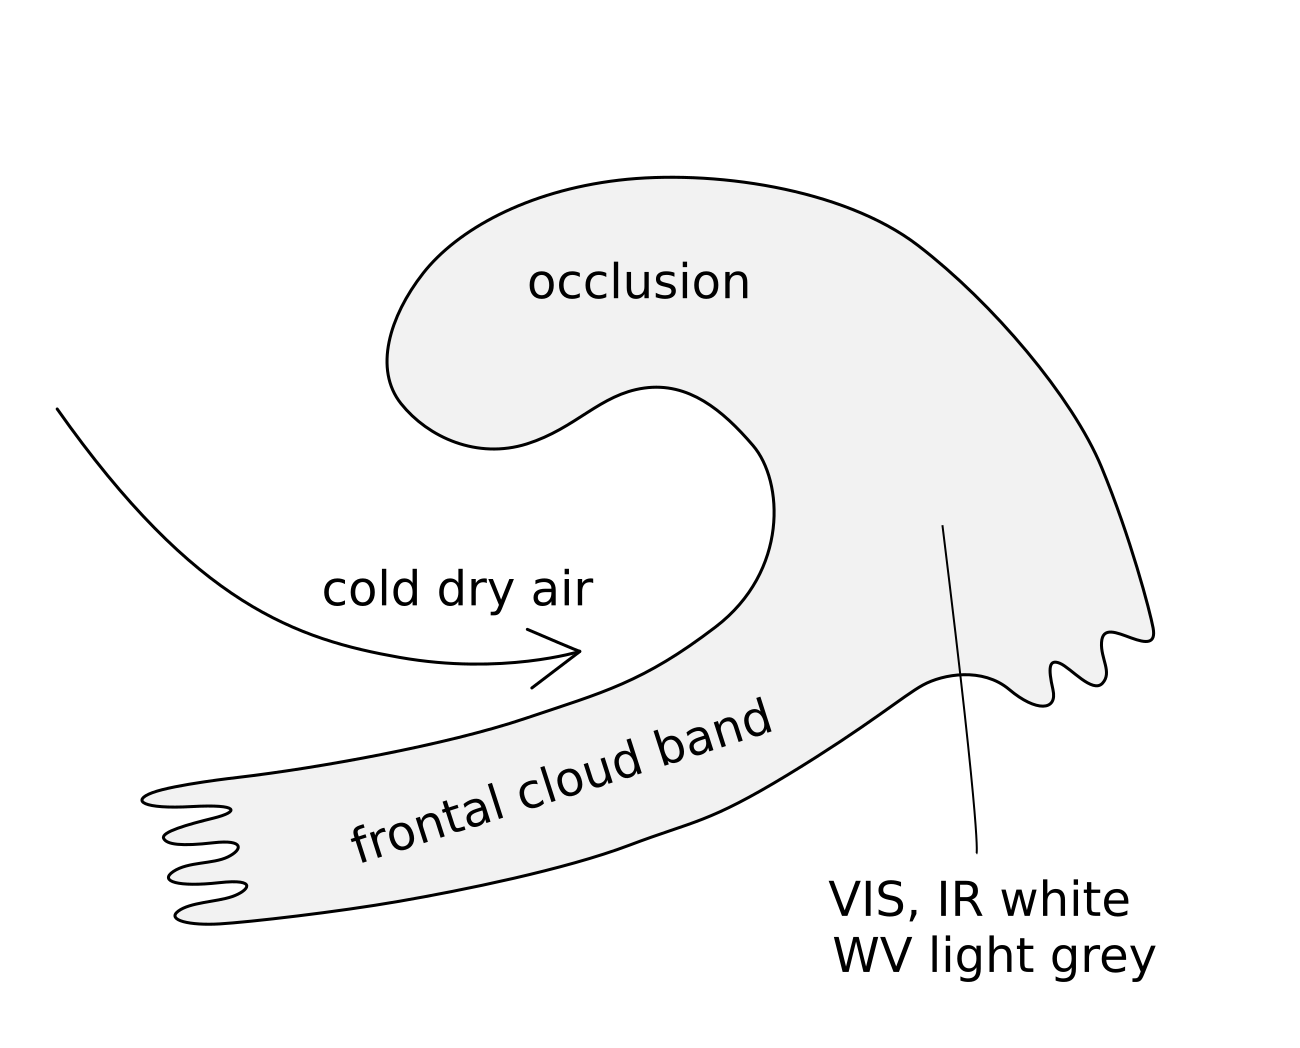
- IR imagery:
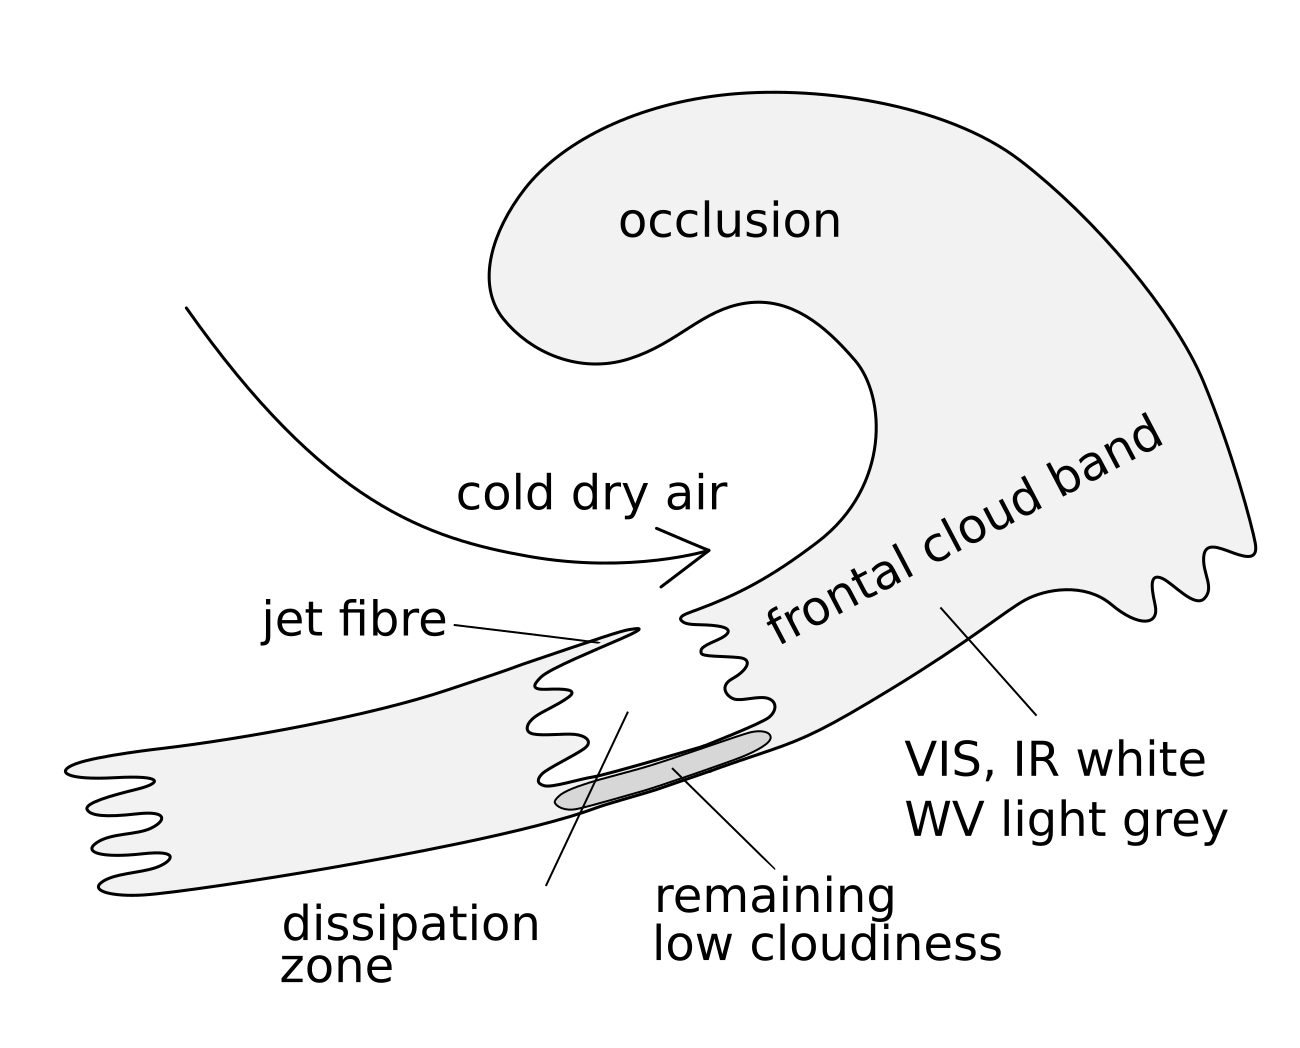
- The cloud decay generally starts from the colder, and dryer, rearward side of the frontal band, showing a dark or even black area in the IR image which increases over time.
- At an early stage dissipation takes place within high and middle-level clouds, leaving behind a dark grey stripe associated with lower cloud fraction.
- Sometimes a clear bright jet cloud fibre forms at the edge of the cloud gap. Physical processes, indicated by relative streams, lead to either the dissipation of the low clouds during the mature stage of the process, or the re-filling of the cloud gap again.
- WV imagery:
- The light grey WV band darkens from the rear edge.
- The grey shade of the dissolution zone in the WV differ depending on the characteristics of individual cases - but a weak WV band structure is present in all investigated cases.
- VIS imagery:
- In most cases the VIS image shows that low cloud fraction remains even in an advanced state of Front Decay.
- Complete dissipation in the later stage of the life cycle occurs only in 14% of the cases. The remaining 86% of the cases contain patches of thin clouds.
|
|
Appearance in the basic RGBs:
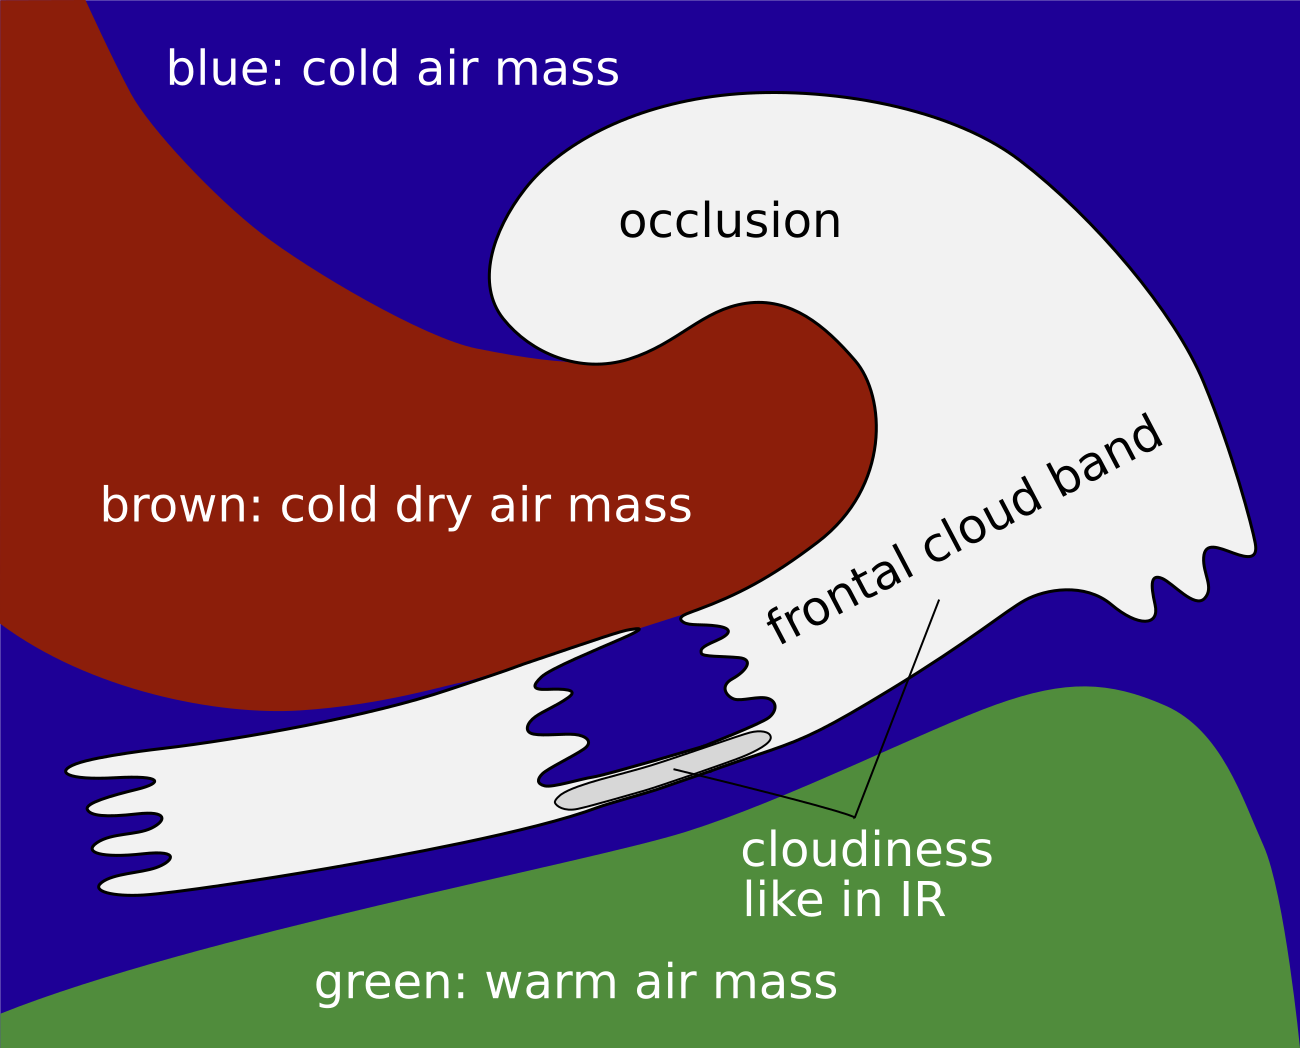
Airmass RGB
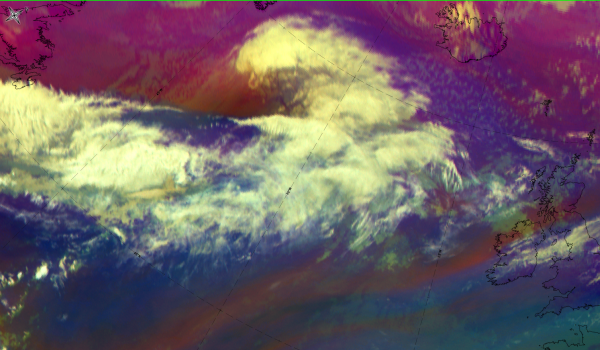
In the area of Front Decay (FD) clouds experience strong evaporation and the cloud free region shows the ground below. In this area, cold air masses have already protruded downstream, which can be seen in the blue colours. At the rear of the FD, dark brown represents the cold and dry airmasses.
As usual, the rest of the clouds associated with the cold front band is in the airmass RGB is very similar to that of the IR image.
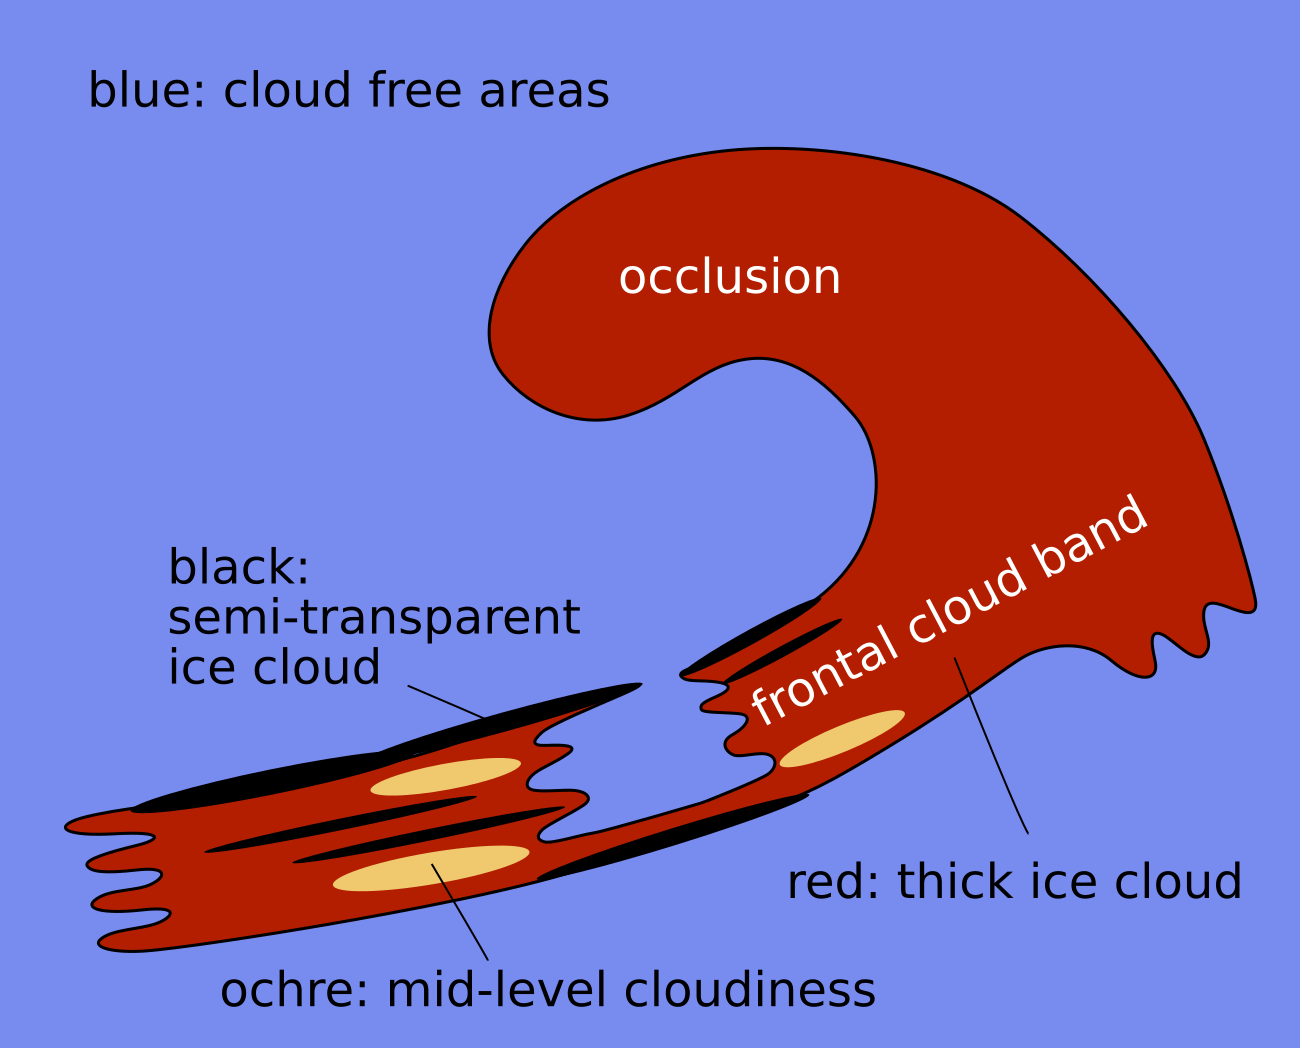
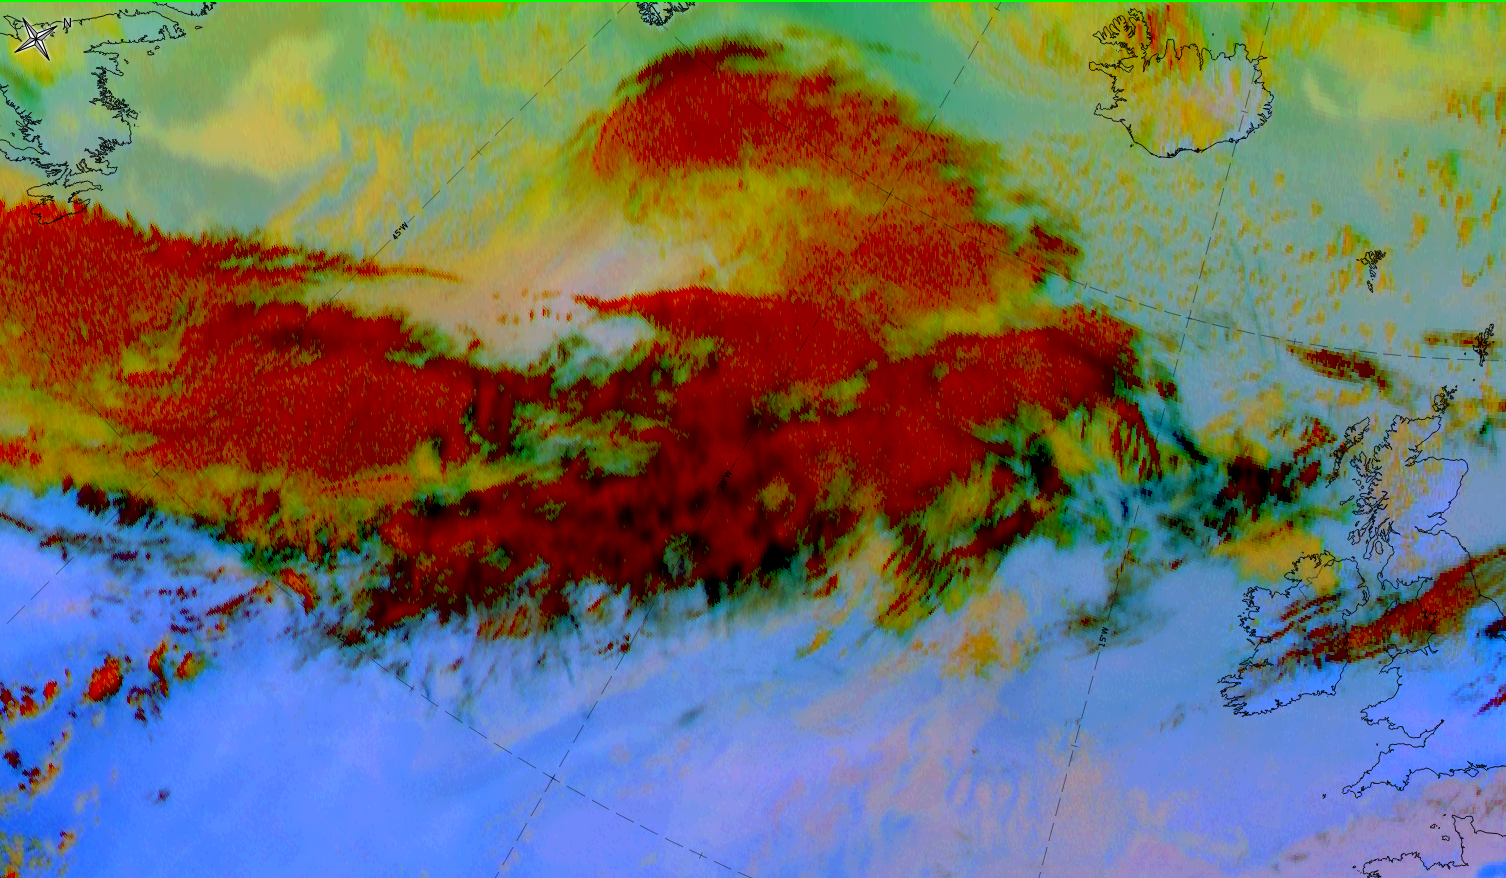
Dust RGB
In the area of the FD, where clouds are evaporated, the Dust RGB shows the Earth’s surface which is blue or pinkish blue. Sometimes greenish colours indicate that some thin medium level cloud exists.
In the surroundings, the rest of the frontal cloud band depends on the degree of evaporation of the black cloud fibres (representing high ice cloud). Some black cloud fibres can often be found at the rear of the frontal cloud band close to the jet axis. Note that in cases of reduced evaporation of the frontal clouds, dark red patches can exist, indicating thicker ice cloud.
 |
 |
Legend: Left: Airmass RGB; right: Dust RGB
The case from 13 September 2019 shows that at 12UTC in the NW-Atlantic, a frontal system consisting of a cold frontal cloud band exists. This cold front band extends from W to NE and an occlusion cloud spiral is positioned south of, and between, Greenland and Iceland. In the cold frontal cloud band immediately south of the two pieces of cloud fibres (at the rear side), there is an area where cloud has disappeared - the area of Front Decay.
|
|
|
|
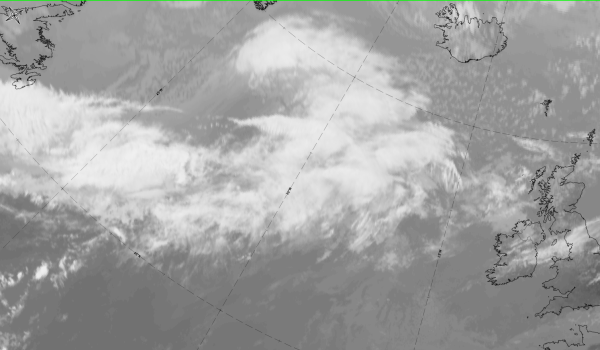
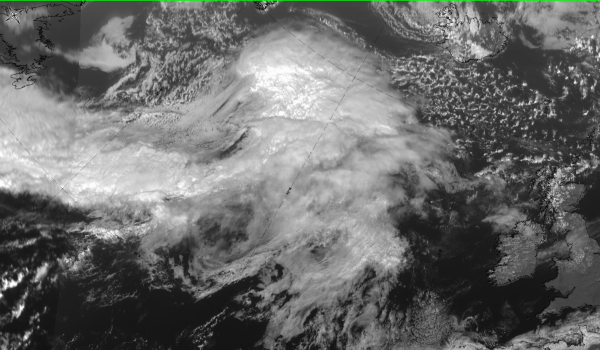
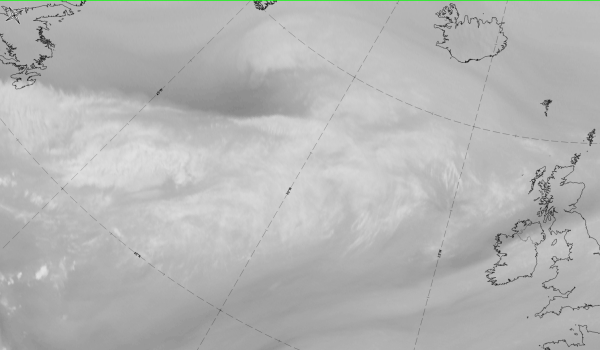
13 September 2019 at 12UTC: 1st row: IR (above) + HRV (below); 2nd row: WV (above) + Airmass RGB (below); 3rd row: Dust RGB + image gallery.
*Note: click on the Dust RGB image to access image gallery (navigate using arrows on keyboard)
| IR | Bright cold front cloud band; bright fibres at rear side at jet axis; dark area to the south of these fibres, representing an area of evaporation of high cloud. |
| HRV | Bright cold front cloud band; dark grey cloud in the area of the Front Decay, representing that the rest of the cloud is low and midlevel cloud. |
| WV | Bright or light grey band of high humidity in the upper layers; bright cloud fibres at the rear side; the area of Frontal Decay is slightly darker. |
| Airmass RGB | Clouds appear similar to those in the IR; around the cloud band and in the cloud free areas, bluish colours represent the cold air mass, similar to the area of Frontal Decay. At the rear, brownish colours represent the cold and dry sinking air behind the cold front. |
| Dust RGB | Frontal cloud band with ochre and dark red colours where the mid-level liquid and thick ice cloud are present. In the area of Frontal Decay, pinkish red and greenish dominate; towards the NW, mid-level cloud mid-level cloud is indicated by ochre. |
The 3-hourly sequence of images below from 13 September 2019 at 00UTC to 12 UTC shows - indicated by the white arrows - clearly the evaporation of cloudiness at the rear side of the frontal cloud band within these 12 hour period.
Legend: 13 September 2019: IR images: 00, 03, 06,09, 12 UTC.
*Note: click on the image to access the image gallery (navigate using arrows on keyboard)