Cloud Structure In Satellite Images

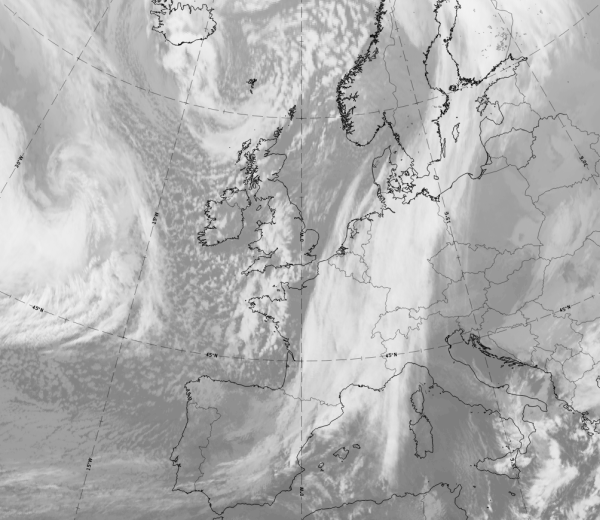
11 December 2019 at 12 UTC; Meteosat 10, IR 10.8 image
The image above shows a large cloud system over the North-Atlantic and the western and north western Europe, consisting of an Occlusion, Warm Front and Cold Front. There is a Wave at the front of the system, over France, and behind it, a large area containing differently shaped cellular cold air clouds can be observed. The enhanced cloud cells between the English Channel / Brittany and the bay of Biscay are the topic of this chapter: EC or Enhanced Cumulus. They are associated not only with enhanced instability but also with some other effects causing increased upward motion, which will be discussed in the following chapters (see Meteorological physical background and Key parameters).
In areas with EC (Enhanced Cumulus), the following satellite image features exist:
- ECs can usually be found in the cold air behind Cold fronts; therefore, the typical cloud configuration is a frontal cloud band with an area of enhanced cloud cells behind
- The satellite images show a meso-scale area of cellular, sharp-edged cloud clusters, with some variety in shape and size. Usually, these cloud clusters are surrounded by cloud cells with warmer tops, i.e. typical cellular Cold Air Cloudiness.
- Different development processes are associated with ECs:
- Under certain circumstances Cold Air Cloud (CAC) grows into EC
- EC can grow further into a Comma
- A Comma can grow into Cold Air Development (CAD).
The diagrams below show different kinds of convective cloud and demonstrate the difference between Cb Clusters and ECs.

|

|
Appearance in the basic channels:
In areas with EC, the following satellites features occur:
- The EC cells are usually white in the IR, VIS and WV images indicating thick, multi-level convective clouds.
- There are types of EC that are white in VIS but only light grey to white in IR and grey in WV indicating that the tops do not reach to high levels
- The greyer clusters are not normally surrounded by lower tops and the distance from the Cold Front is greater.
- In well-developed situations, the cirrus shields of single Cb cells merge, leading to a very cold smooth cloud shield in IR but a transparent appearance in the VIS image.
Appearance in the basic RGBs:
Airmass RGB
In the Airmass RGB the area around the EC cloud cells is blue, indicating that the EC cloud develops in cold air at the rear of a cold front. Sometimes dark brown areas, representing a dry air protrusion, can be found on the rear side.
The appearance of the EC cloud cells is similar to that in IR, but often with a light brownish shade representing the overrunning dry air.
Dust RGB
In the Dust RGB the area around the EC cloud cells is blue where there is no cloud; this is typical for cloud free sea or land.
The cells of the EC vary from ochre to orange for thinner cells, and further to dark red where the cells become thicker.
 |
 |
Legend: Basic RGB schematics.
Left: Airmass RGB; right: Dust RGB.
A case from 11 December 2019 at 12 UTC shows a large EC area from south-western England to Brittany.
|
|
|
|
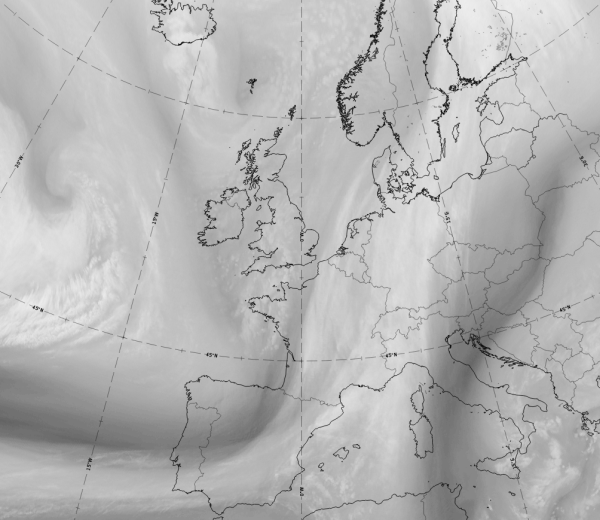
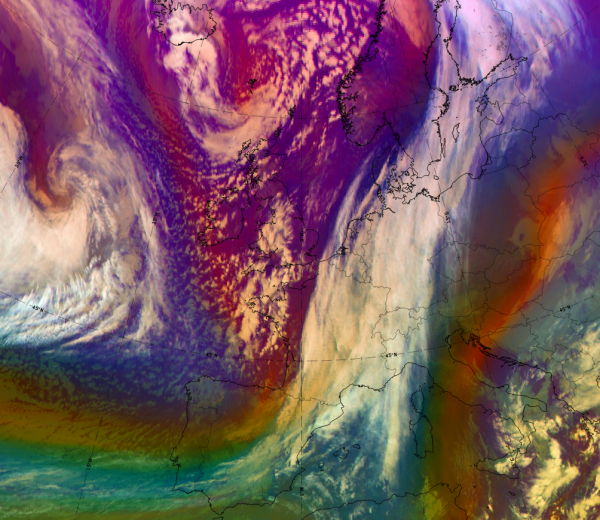

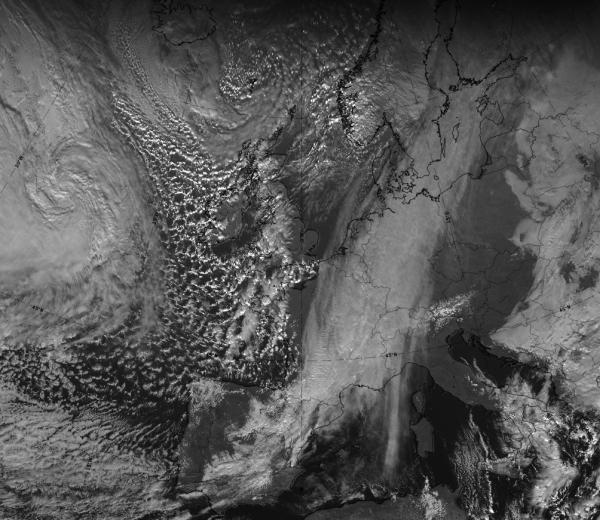
11 December 2019/12UTC: 1st row: IR (above) + HRV (below); 2nd row: WV (above) + Airmass RGB (below); 3rd row: Dust RGB + image gallery.
*Note: click on the image to access the image gallery (navigate using arrows on keyboard)
| IR | White cloud cells of different sizes. |
| HRV | White cloud cells; larger cells have fibrous cell edges for cirrus shields. |
| WV | Light grey area representing high humidity, with white spots representing higher-reaching EC cells. |
| Airmass RGB | EC cells within dark brown dry and cold air; further west south-eastward-ward protruding cold air in blue; EC cells are orange to ochre, indicating the overrunning dry air. |
| Dust RGB | EC cells are mostly dark red indicating thick ice cloud; ochre and much smaller cells to the west represent cold air cloud. |
In very convective cases, especially in summer and over land, other RGBs, which show more details over the convective cells, are important. This includes the "Convection RGB" and the "Sandwich product". Schematics for "Convection RGB" and the "Sandwich Product" can be found in the descriptions of the relevant conceptual models of Cb and MCS; they are presented below as a demonstration for a very convective EC case.
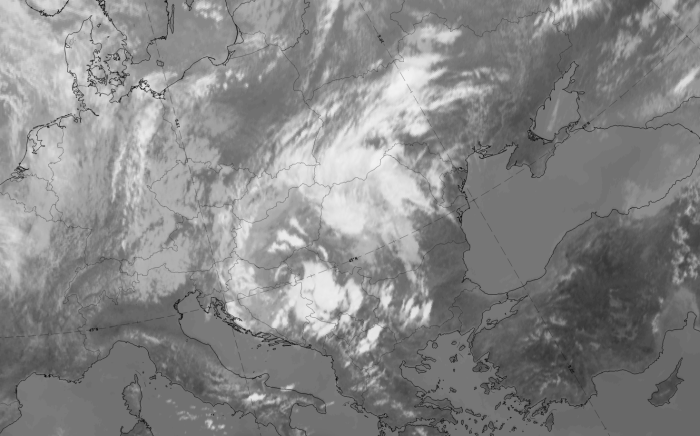
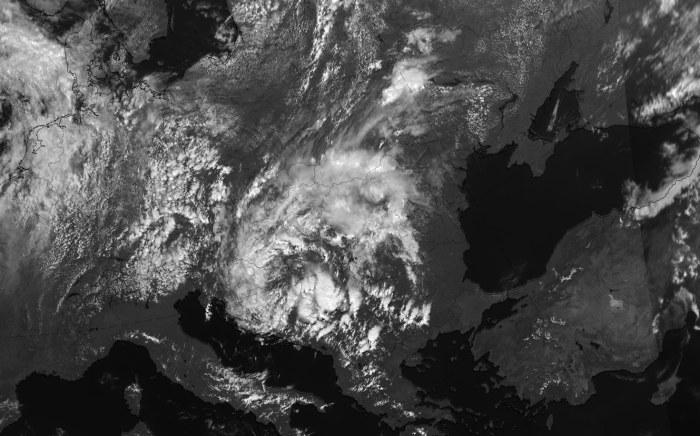
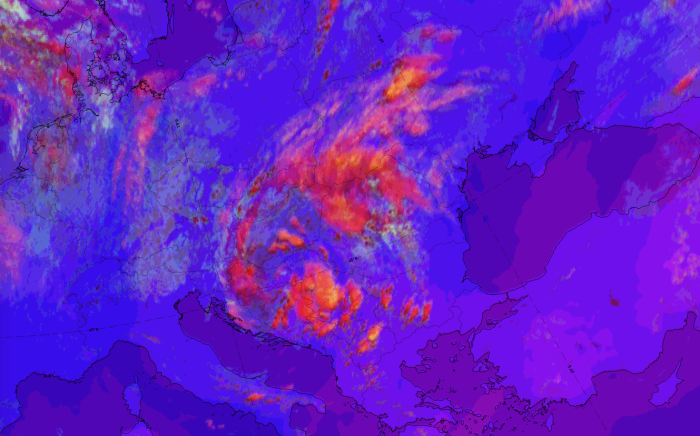
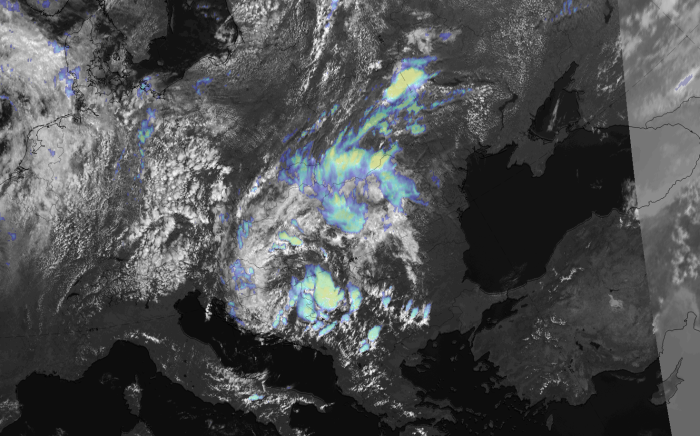
A case on 25 July at 12 UTC shows an EC area over Bosnia and Serbia, close to the centre of an occlusion spiral.
|
|
|
|
|
|
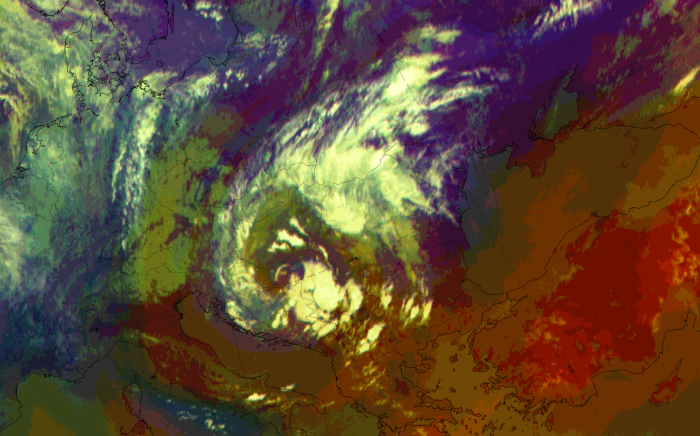
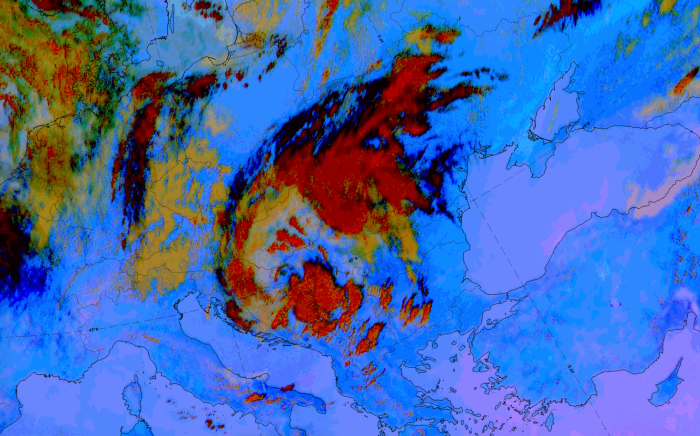
Legend: 25 July 2020 at 12 UTC.
1st row: IR (above) + HRV (below); 2nd row: Airmass RGB (above) + Dust RGB (below); 3rd row: Severe Storms RGB + Sandwich Product.
*Note: click on the image to access the image gallery (navigate using arrows on keyboard)
| IR | Very bright cloud cells, indicating cold convective cloud tops. |
| HRV | Very bright cloud cells, indicating thick cloud. Dark grey fibrous areas downstream, at the borders of the cells, represent cirrus anvils. |
| Airmass RGB | Dark brown colours indicate dry air. The EC cells only occur in one airmass. |
| Dust RGB | Dark red colours indicate thick ice cloud. Black colours at the borders of the cells indicate the cirrus anvils. |
| Convection RGB | Dark red colours indicate thick cloud with large ice particles; yellow areas indicate strong updrafts with thin ice particles. |
| Sandwich product | Colours indicate different temperatures as well as fine structures at the tops of the cells. |