Table of Contents
Cloud Structure In Satellite Images

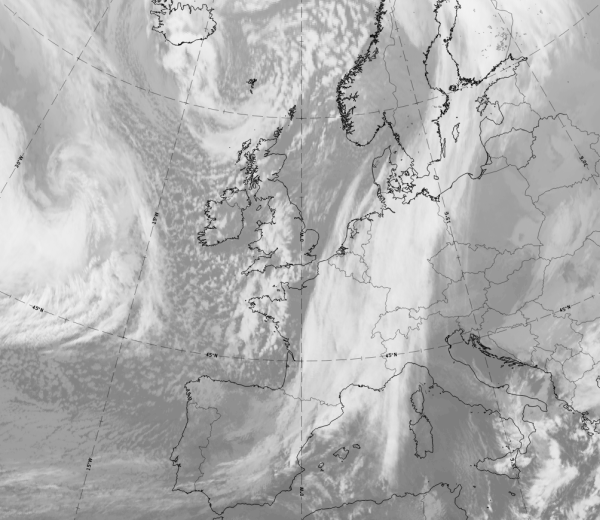
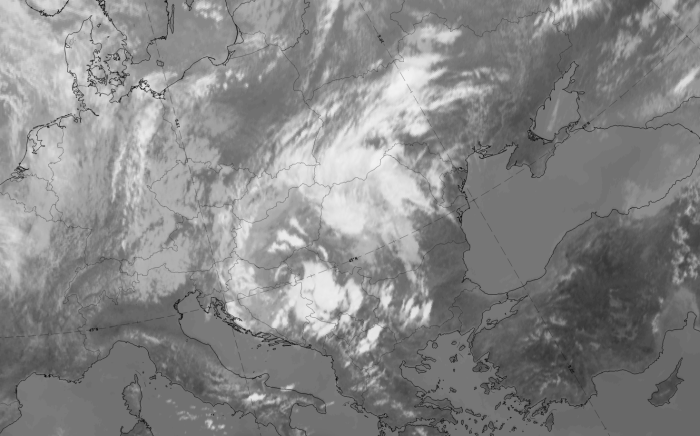
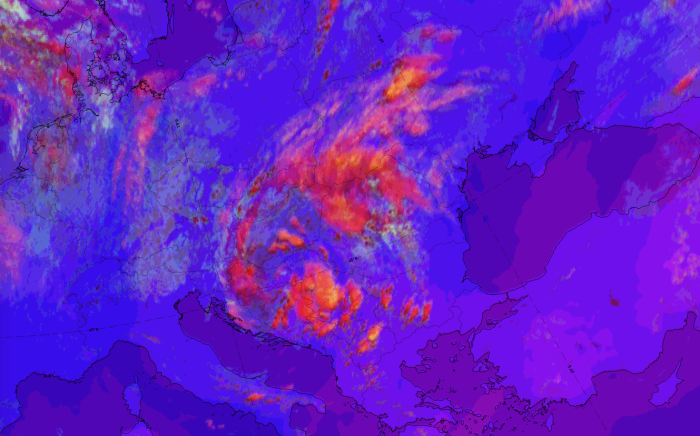
11 December 2019 at 12 UTC; Meteosat 10, IR 10.8 image
The image above shows a large cloud system over the North-Atlantic and the western and north western Europe, consisting of an Occlusion, Warm Front and Cold Front. There is a Wave at the front of the system, over France, and behind it, a large area containing differently shaped cellular cold air clouds can be observed. The enhanced cloud cells between the English Channel / Brittany and the bay of Biscay are the topic of this chapter: EC or Enhanced Cumulus. They are associated not only with enhanced instability but also with some other effects causing increased upward motion, which will be discussed in the following chapters (see Meteorological physical background and Key parameters).
In areas with EC (Enhanced Cumulus), the following satellite image features exist:
- ECs can usually be found in the cold air behind Cold fronts; therefore, the typical cloud configuration is a frontal cloud band with an area of enhanced cloud cells behind
- The satellite images show a meso-scale area of cellular, sharp-edged cloud clusters, with some variety in shape and size. Usually, these cloud clusters are surrounded by cloud cells with warmer tops, i.e. typical cellular Cold Air Cloudiness.
- Different development processes are associated with ECs:
- Under certain circumstances Cold Air Cloud (CAC) grows into EC
- EC can grow further into a Comma
- A Comma can grow into Cold Air Development (CAD).
The diagrams below show different kinds of convective cloud and demonstrate the difference between Cb Clusters and ECs.

|

|
Appearance in the basic channels:
In areas with EC, the following satellites features occur:
- The EC cells are usually white in the IR, VIS and WV images indicating thick, multi-level convective clouds.
- There are types of EC that are white in VIS but only light grey to white in IR and grey in WV indicating that the tops do not reach to high levels
- The greyer clusters are not normally surrounded by lower tops and the distance from the Cold Front is greater.
- In well-developed situations, the cirrus shields of single Cb cells merge, leading to a very cold smooth cloud shield in IR but a transparent appearance in the VIS image.
Appearance in the basic RGBs:
Airmass RGB
In the Airmass RGB the area around the EC cloud cells is blue, indicating that the EC cloud develops in cold air at the rear of a cold front. Sometimes dark brown areas, representing a dry air protrusion, can be found on the rear side.
The appearance of the EC cloud cells is similar to that in IR, but often with a light brownish shade representing the overrunning dry air.
Dust RGB
In the Dust RGB the area around the EC cloud cells is blue where there is no cloud; this is typical for cloud free sea or land.
The cells of the EC vary from ochre to orange for thinner cells, and further to dark red where the cells become thicker.
 |
 |
Legend: Basic RGB schematics.
Left: Airmass RGB; right: Dust RGB.
A case from 11 December 2019 at 12 UTC shows a large EC area from south-western England to Brittany.
|
|
|
|
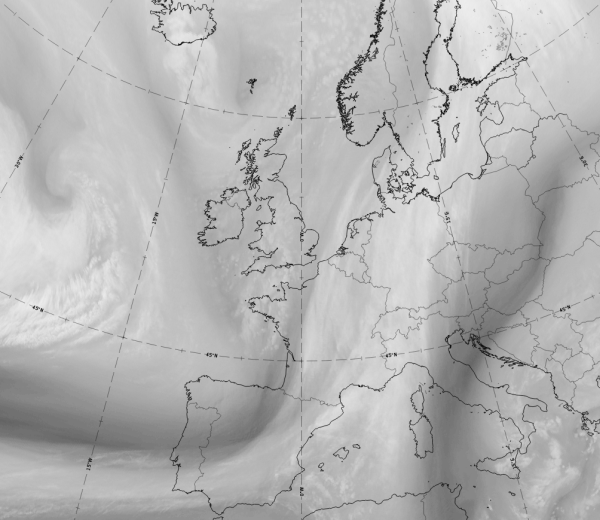
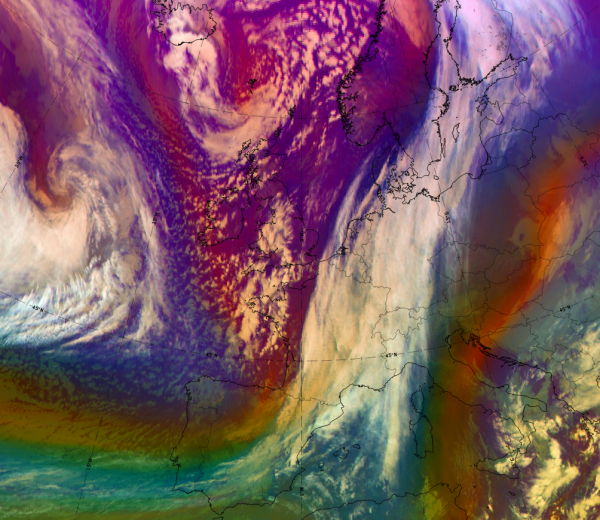

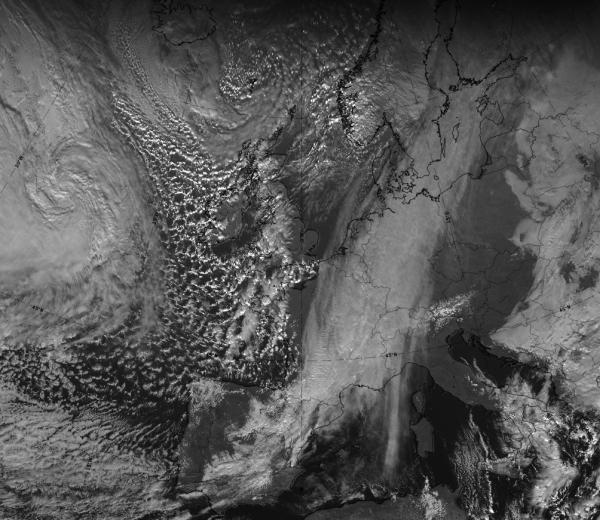
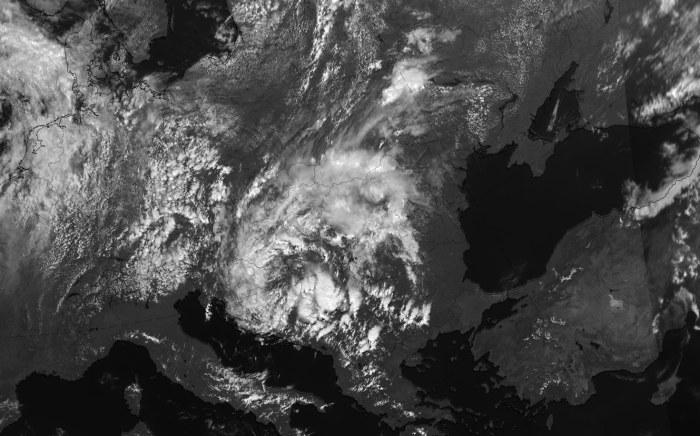
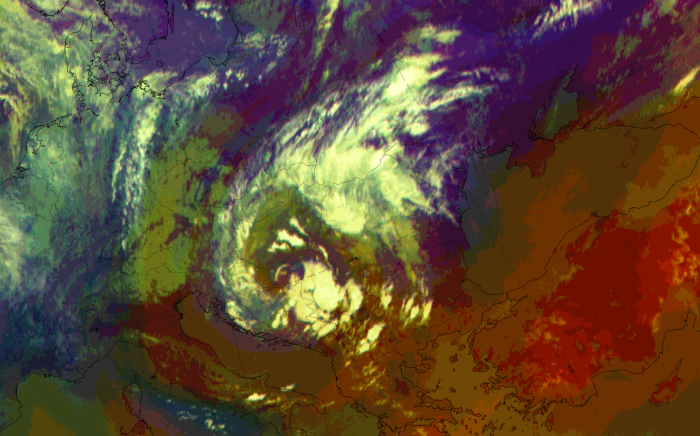
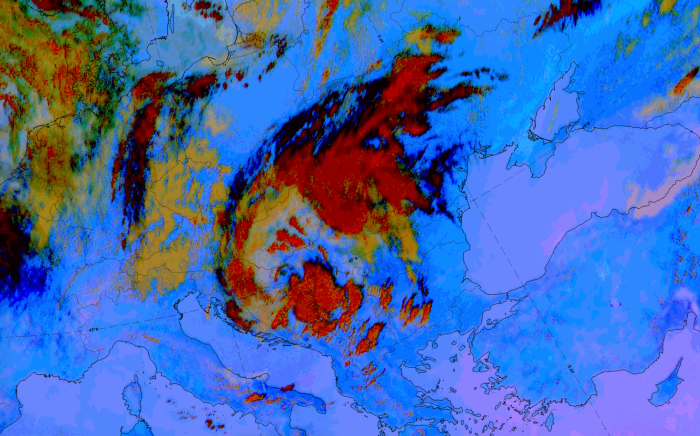
11 December 2019/12UTC: 1st row: IR (above) + HRV (below); 2nd row: WV (above) + Airmass RGB (below); 3rd row: Dust RGB + image gallery.
*Note: click on the image to access the image gallery (navigate using arrows on keyboard)
| IR | White cloud cells of different sizes. |
| HRV | White cloud cells; larger cells have fibrous cell edges for cirrus shields. |
| WV | Light grey area representing high humidity, with white spots representing higher-reaching EC cells. |
| Airmass RGB | EC cells within dark brown dry and cold air; further west south-eastward-ward protruding cold air in blue; EC cells are orange to ochre, indicating the overrunning dry air. |
| Dust RGB | EC cells are mostly dark red indicating thick ice cloud; ochre and much smaller cells to the west represent cold air cloud. |
In very convective cases, especially in summer and over land, other RGBs, which show more details over the convective cells, are important. This includes the "Convection RGB" and the "Sandwich product". Schematics for "Convection RGB" and the "Sandwich Product" can be found in the descriptions of the relevant conceptual models of Cb and MCS; they are presented below as a demonstration for a very convective EC case.
A case on 25 July at 12 UTC shows an EC area over Bosnia and Serbia, close to the centre of an occlusion spiral.
|
|
|
|
|
|
Legend: 25 July 2020 at 12 UTC.
1st row: IR (above) + HRV (below); 2nd row: Airmass RGB (above) + Dust RGB (below); 3rd row: Severe Storms RGB + Sandwich Product.
*Note: click on the image to access the image gallery (navigate using arrows on keyboard)
| IR | Very bright cloud cells, indicating cold convective cloud tops. |
| HRV | Very bright cloud cells, indicating thick cloud. Dark grey fibrous areas downstream, at the borders of the cells, represent cirrus anvils. |
| Airmass RGB | Dark brown colours indicate dry air. The EC cells only occur in one airmass. |
| Dust RGB | Dark red colours indicate thick ice cloud. Black colours at the borders of the cells indicate the cirrus anvils. |
| Convection RGB | Dark red colours indicate thick cloud with large ice particles; yellow areas indicate strong updrafts with thin ice particles. |
| Sandwich product | Colours indicate different temperatures as well as fine structures at the tops of the cells. |
Meteorological Physical Background
Enhanced Cumulus areas (ECs) are mesoscale cloud phenomena, which develop within the cold air mass behind a Cold Front in the area of an upper level trough. They do not develop at the boundary of two air masses like Cold or Warm Fronts. In some cases ECs are embedded within cellular cloudiness with tops reaching only up to the lower levels of the troposphere (see Cloud structure in satellite image). Although ECs develop in cold air, temperature advection is relatively small. The two main conditions for development of EC are:
- Increased vertical instability in the troposphere;
- PVA maxima
- either immediately in front of the upper level trough, where the air parcels are under the influence of strong cyclonic rotation and PVA indicates a moving trough
- or in the left exit region of a jet streak where PVA indicates the advection of more cyclonic shear

Instability is an important requirement for the formation of any type of Cold Air Cloudiness. EC can only develop with additional dynamical forcing.
Potential Instability
Instability can be generated in several different ways. Two possibilities are mentioned here:
Cold air streaming over warm sea water
This type mostly occurs in autumn and winter. The cold air streaming over the sea surfaces is heated from below, due to the relatively warm water temperatures in comparison to the air (diabatic heating). As a consequence of this heating the atmosphere becomes unstable and lifting, with additional condensation, takes place. This additional condensation leads to the release of latent heat. According to the omega equation, latent heat will force vertical motion. Therefore more condensation will take place, because of the cooling of the air by upward vertical motion.
On the other hand, the upper levels of the troposphere are characterised by sinking dry air, which may even originate from the stratosphere. Looking at the situation on isentropic surfaces, this sinking motion is caused by the relative stream of the dry intrusion. Therefore the upward motion in the convective cells is restricted from above and after some time an equilibrium between upward motion (represented by the cloud cells) and downward motion (indicated by the cloud-free areas in between) develops, resulting in large areas filled up with the so-called cellular Cold Air Cloudiness (see Cloud structure in satellite image).
Cold air streaming over warm land surface
This type mostly occurs in spring and summer, when cold air flows over a warmed land surface.
For the development of ECs within a cold air mass, additional dynamical forcings plays a significant role.
Vorticity Advection
Curvature Vorticity and its advection
ECs usually appear immediately in front of an upper level trough, but they can also appear immediately in front of the main upper level trough as well as behind it if there is a secondary small trough.
At the downstream side of the trough axis positive vorticity advection appears. In the area of the maxima of positive vorticity advection the development of Cold Air Cloudiness into EC is likely to occur. Usually those mesoscale PVA maxima are connected to secondary troughs within the synoptic scale upper level trough.
|
EC in the area of maximum positive vorticity advection at the leading edge of a small trough preceding a pronounced upper level
trough
|
EC in the area of maximum positive vorticity advection in front of a pronounced upper level trough
|

|

|
|
EC in the area of maximum positive vorticity advection at the leading edge of a small trough behind the main upper level trough
|
|

|
|
|
13 January 2008/12.00 UTC - Meteosat 9 IR10.8 image; cyan: height contours 500 hPa, green: vorticity advection 500 hPa
|
24 April 2008/12.00 UTC - Meteosat 9 IR10.8 image; cyan: height contours 500 hPa, green: vorticity advection 500 hPa
|

|

|
In both examples there is a huge synoptic scale upper level trough with PVA maxima indicating areas where cyclonic rotation is greater than in the surrounding region. In the example of the 13th of January it is more evident than in the one of the 24th of April. The correspondence of the ECs with the PVA maxima is evident.
Shear Vorticity
EC and Cb clusters often develop in the left exit of a jet streak. The left exit of the jet is on the cyclonic side of the jet. Upstream from the left exit there is a maximum of positive or cyclonic shear vorticity. As a consequence of the movement of the jet, a vorticity advection maximum will be found in the left exit of the jet. This maximum will lead to divergence in the upper levels of the troposphere, resulting in upward motion at middle levels (see Front Intensification by Jet Crossing ).

|
|
|
24 April 2008/12.00 UTC - Meteosat 9 IR10.8 image; cyan: height contours 500 hPa
|
24 April 2008/12.00 UTC - Meteosat 9 IR10.8 image; yellow: isotachs 500 hPa, green: Positive vorticity advection 500 hPa
|

|

|
|
24 April 2008/12.00 UTC - Meteosat 9 IR10.8 image; yellow: isotach 300 hPa, red: positive vorticity advection 300 hPa
|
13 January 2008/12.00 UTC - Meteosat 9 IR10.8 image; cyan: height contours 500 hPa
|

|

|
|
13 January 2008/12.00 UTC - Meteosat 9 IR10.8 image; yellow: isotachs 500 hPa, green: vorticity advection 500 hPa
|
13 January 2008/12.00 UTC - Meteosat 9 IR10.8 image; yellow: isotach 300 hPa, red: Positive vorticity advection 300 hPa
|

|

|
For shear vorticity the example of 24th of April is more appropriate because there is strong jet which is more visible at 300 hPa level. The ECs over Great Britain are placed very near to the left exit region of a jet streak but the other ones are also located in the region where the shear exists although there is no PVA maximum in the fields.
Looking at PVA maxima as additional driving factors for the development of EC cloud, the increase of PVA with height is the most important factor in the development of ECs. Most cases show a PVA maximum between 700 hPa and 300 hPa, and because of this it is more usually seen on 500 hPa than on 300 hPa. This differential vorticity advection causes divergence in the upper levels resulting in upward motion at mid levels of the troposphere. Most cases show a maximum vertical motion of -18 hPa/h. The average level of minimum vertical motion is around 600 hPa.
Mean vorticity advection of 30 investigated cases. P5 = vorticity advection at 500 hPa, P3 = vorticity advection at 300 hPa.

Key Parameters
- Equivalent thickness and temperature advection at 700 hPa:
In the area of EC the equivalent thickness is marked by a trough or a minimum, indicating cold air. This is an area of relatively low ThetaW values at 850 hPa. Usually this is also an area of synoptic scale CA; but there is no distinct relation between an EC and a CA maximum; ECs can also be in areas of smaller scale WA (for instance in connection with a following Warm Front system) - Height contours at 500 hPa:
EC and Cb Cluster features are connected to upper level troughs; many of them develop ahead of embedded smaller, rapidly moving upper level troughs. This happens usually at the leading edge of the trough. If ECs are at the rear side of troughs they are in an area of high shear and are connected to jet streaks. - Isotachs:
ECs and Cb Clusters often develop at the left exit region of a strong jet streak. This is often close to the rear of the upper level trough - Positive Vorticity Advection (PVA) at 500 and 300 hPa:
Vorticity advection shows maxima at 500 and 300 hPa; vorticity advection generally increases in the layer between 500 and 300 hPa. - Instability indices:
EC and Cb cluster appear in areas of instability characterised by the Boyden Index (>95) or the Showalter index (<3); but the values are typically less unstable than in the warm air ahead of fronts.
Equivalent thickness and temperature advection at 700 hPa
|
|
13 January 2008/12.00 UTC - Meteosat 9 IR10.8 image; green: equivalent thickness 500/850 hPa, blue: thermal front parameter 500/850
hPa, red: temperature advection 700 hPa
|

|

|

|
|
|
|
24 April 2008/12.00 UTC - Meteosat 9 IR10.8 image; green: equivalent thickness 500/850 hPa, blue: thermal front parameter 500/850
hPa, red: temperature advection 700 hPa
|
The example of 24th of April is better since the most of ECs are located within the cold air.
Height contours and Vorticity Advection at 500 and/or 300 hPa
|
|
13 January 2008/12.00 UTC - Meteosat 9 IR10.8 image; cyan: height contours 500 hPa, green: vorticity advection 500 hPa
|

|

|

|

|
|
|
24 April 2008/12.00 UTC - Meteosat 9 IR10.8 image; cyan: height contours 500 hPa, green: vorticity advection 500 hPa
|
Isotachs and PVA at 500 and/or 300 hPa
|
|
24 April 2008/12.00 UTC Meteosat 9 IR10.8 image; yellow: isotachs 500 hPa, green: vorticity advection 500 hPa
|

|

|
|
|
24 April 2008/12.00 UTC - Meteosat 9 IR10.8 image; yellow: isotachs 300 hPa, red: voriticity advection 300 hPa
|

|
|
|
|
13 January 2008/12.00 UTC Meteosat 9 IR10.8 image; yellow: isotachs 500 hPa, green: voriticity advection 500 hPa
|

|
|
|
|
13 January 2008/12.00 UTC - Meteosat 9 IR10.8 image; yellow: isotachs 300 hPa, red: voriticity advection 300 hPa
|

|
In both cases the PVA at 500 hPa is evident. The PVA at 300 hPa is not seen in this two examples. One of the reason is that this cases are winter cases when the tropopase is much lower then in the summer time. The PVA shows its maximum usually bethween 700 and 300 hPa, so it is more notable at 500 hPa then at 300 hPa.
Instability
|
|
24 April 2008/12.00 UTC - Meteosat 9 IR10.8 image; green: equivalent thickness 500/850 hPa, yellow: Showalter index
|

|

|

|
|
|
|
13 January 2008/12.00 UTC - Meteosat 9 IR10.8 image; green: equivalent thickness 500/850 hPa, yellow: Showalter index
|
Typical Appearance In Vertical Cross Sections
- Isentropes:
ECs and Cb clusters exist within an unstable airmass. This can be observed in the cross section by decreasing values of isentropes with height within lower and mid-levels of the troposphere (usually between surface and 700 hPa). - Relative humidity:
There are high values of relative humidity within the lower and mid-levels of the troposphere. In the layer between 1000 - 700 hPa, a humidity maximum can often be observed. The relative humidity isolines show a maximum (90-100%) near the surface, but also relative maxima higher in the atmosphere in the vicinity of the clusters. - Divergence:
The field of divergence shows convergence within lower and mid-levels in the area of the EC and divergence above. - Vorticity advection:
The field of vorticity advection is characterised by maxima generally at higher levels of the atmosphere. A maximum can often be observed between 500 and 300 hPa. - Vertical motion:
A maximum of vertical velocity is found in the layer between 700 and 600 hPa.
|
|
24 April 2008/12.00 UTC - Meteosat 9 IR10.8 image; position of vertical cross section indicated
|

|

|

|
|
|
|
13 January 2008/18.00 UTC - Meteosat 9 IR10.8 image; position of vertical cross section indicated
|
Isentropes
|
|
24 April 2008/12.00 UTC - Vertical cross section; black: isentropes (ThetaE)
|

|

|

|
|
|
|
13 January 2008/18.00 UTC - Vertical cross section; black: isentropes (ThetaE)
|
Relative Humidity
|
|
24 April 2008/12.00 UTC - Vertical cross section; black: isentropes (ThetaE), blue: relative humidity
|

|

|

|
|
|
|
13 January 2008/18.00 UTC - Vertical cross section; black: isentropes (ThetaE), blue: relative humidity
|
Divergence
|
|
24 April 2008/12.00 UTC - Vertical cross section; black: isentropes (ThetaE), magenta thin: divergence, magenta thick: convergence
|

|

|

|
|
|
|
13 January 2008/18.00 UTC - Vertical cross section; black: isentropes (ThetaE), magenta thin: divergence, magenta thick: convergence
|
Vorticity Advection
|
|
24 April 2008/12.00 UTC - Vertical cross section; black: isentropes (ThetaE), green: vorticity advection
|

|

|

|
|
|
|
13 January 2008/18 UTC - Vertical cross section; black: isentropes (ThetaE), green: vorticity advection
|
Vertical Motion
|
|
24 April 2008/12.00 UTC - Vertical cross section; black: isentropes (ThetaE), cyan thick: vertical motion (omega) - upward motion,
cyan thin: vertical motion (omega) - downward motion
|

|

|

|
|
|
|
13 January 2008/18.00 UTC - Vertical cross section; black: isentropes (ThetaE), cyan thick: vertical motion (omega) - upward motion,
cyan thin: vertical motion (omega) - downward motion
|
Weather Events
ECs are convective cells often associated with heavy precipitation.
| Parameter | Description |
| Precipitation |
|
| Temperature |
|
| Wind (incl. gusts) |
|
| Other relevant information |
|

|
|
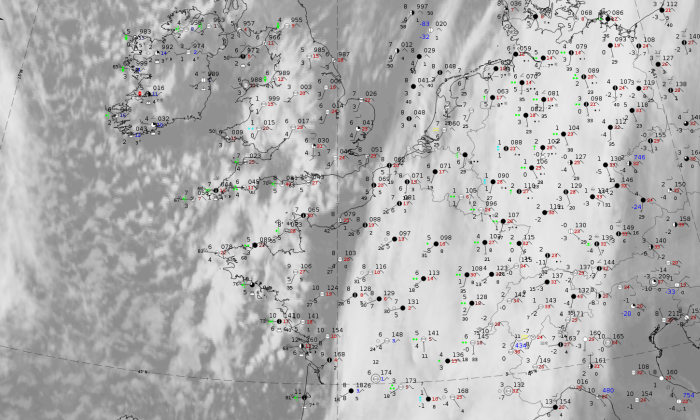
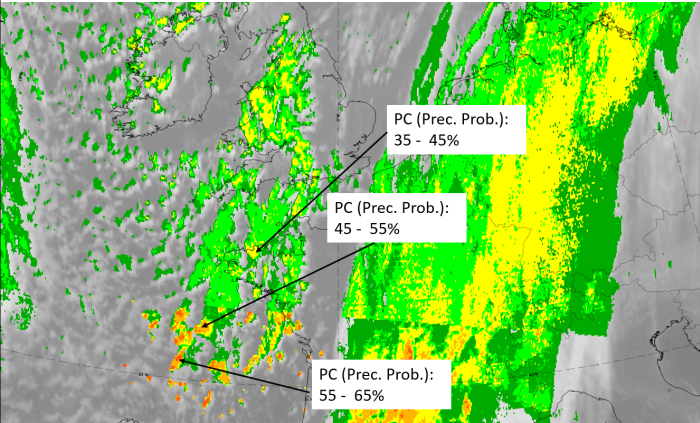
Legend:
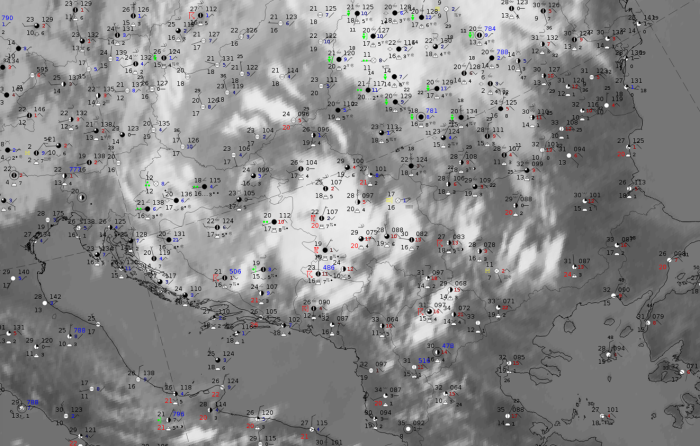
11 December 2019 at 12UTC.
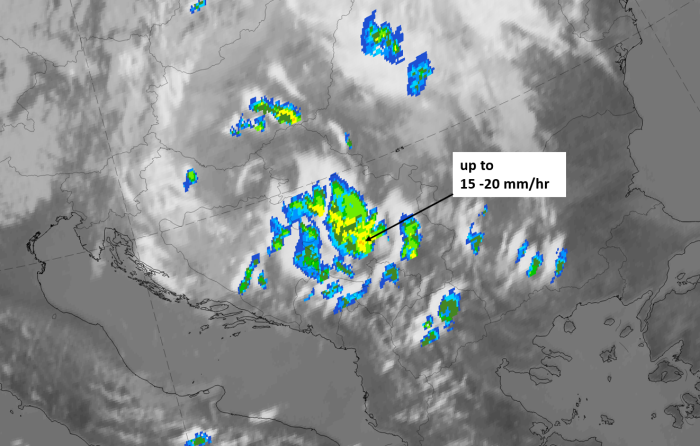
IR + synoptic measurements (above) + probability of moderate rain (Precipitting clouds PC - NWCSAF).
Note: for a larger SYNOP image click this link.
There are widespread reports of Cbs, showers and heavy rain; an area of maximum activity occurs from Cornwall to Brittany. In the southern part, cells occur with precipitation probabilities higher than 55%; however, some caution must be taken with the interpretation as a horizontal stripe over France separates different intensity groups, so a possibility of a computer problem here cannot be excluded.
|
|
|
|
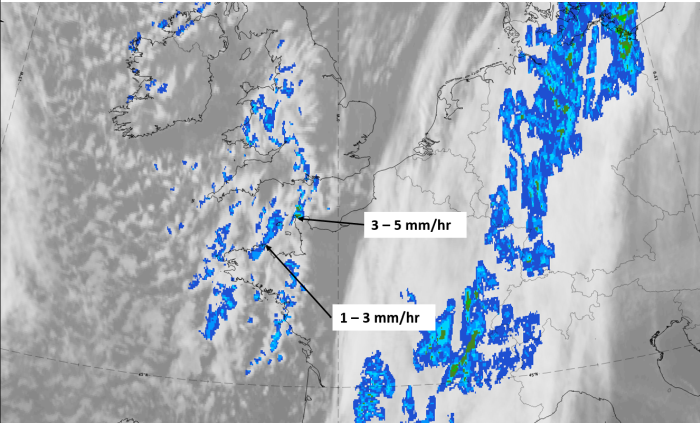
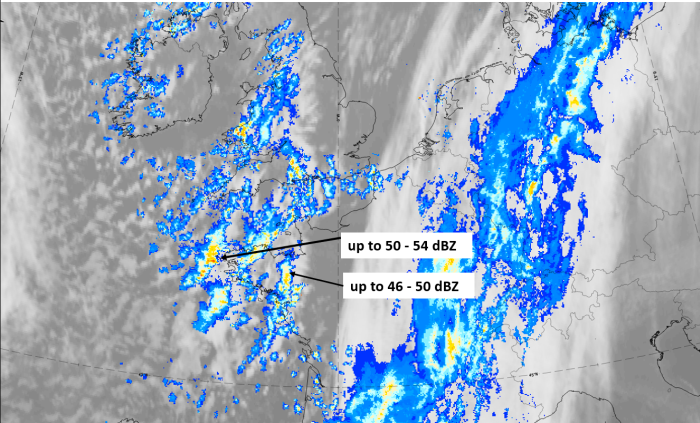
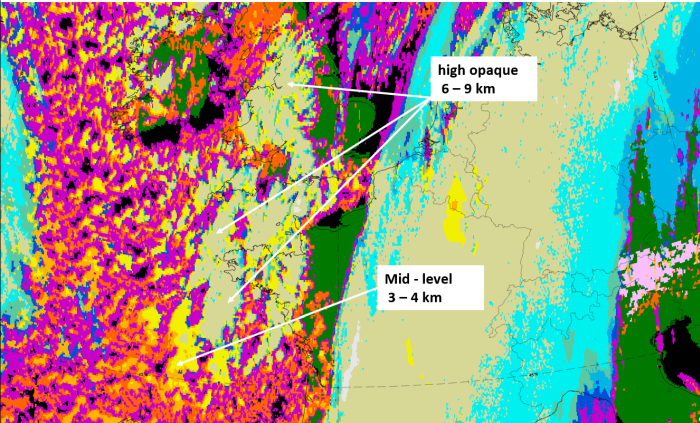
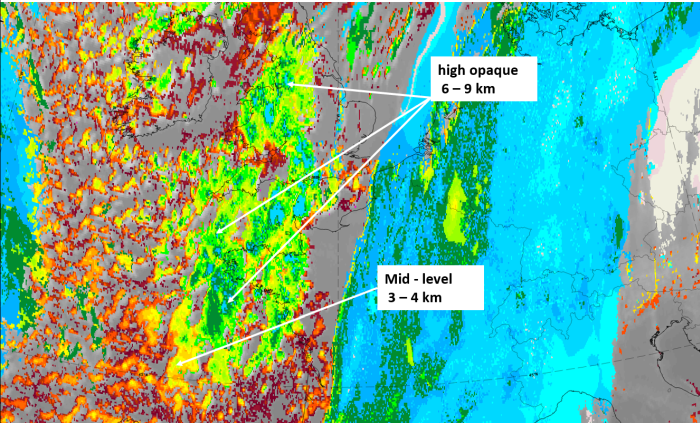
Legend:
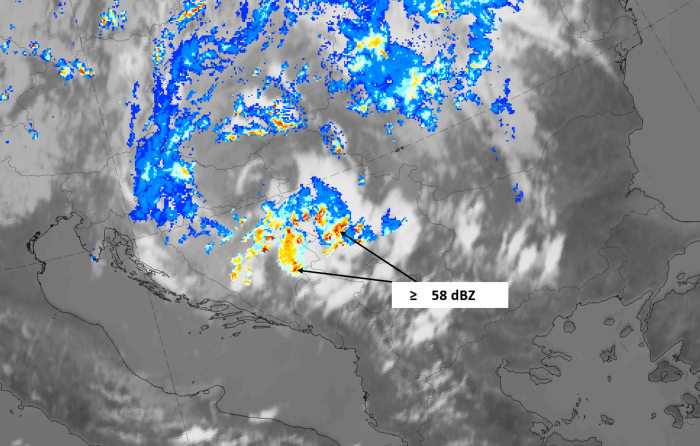
11 December 2019/12 UTC, IR ; with the following fields superimposed:
1st row: Cloud Type (CT NWCSAF) (above) + Cloud Top Height (CTTH - NWCSAF) (below); 2nd row: Convective Rainfall Rate (CRR NWCSAF) (above) + Radar intensities from Opera radar system (below).
For identifying values for Cloud type (CT), Cloud type height (CTTH), precipitating clouds (PC), and Opera radar for any pixel in the images look into the legends. (link).
A case from 25 July 2020 at 12 UTC is shown as a supplementary example of a very convective case over land in summer time.
|
|
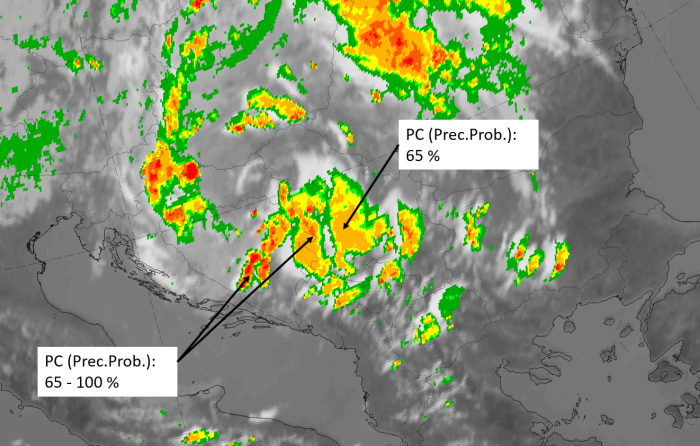
Note: for a larger SYNOP image click this link.
There are widespread heavy thunderstorm reports, and the probability of moderate precipitation is different between the single cloud cells and varies from 55% to 100 %. In this convective case this parameter is not as useful as the convective rainfall rate, which is shown below.
|
|
|
|
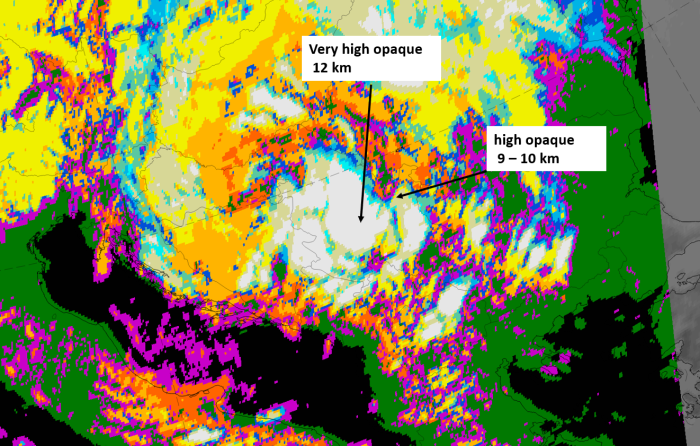
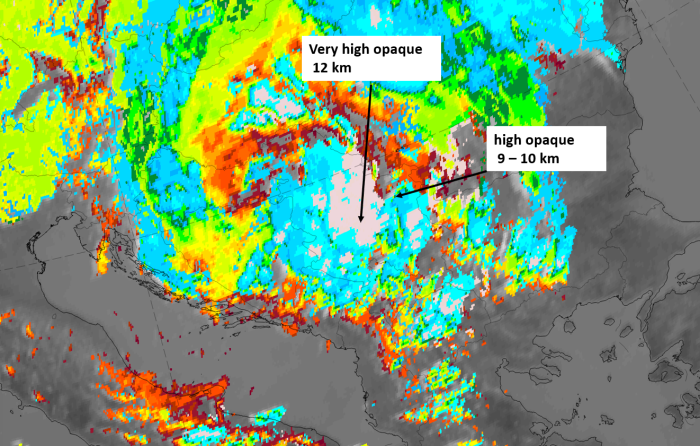
Legend:
25 july 2020 at 12 UTC, IR ; with the following fields superimposed:
u.l.: Cloud Type (CT NWCSAF); u.r.: Cloud Top Height (CTTH - NWCSAF); l.l.: Convective Rainfall Rate (CRR NWCSAF); l.r.: Radar intensities from the Opera radar system.
For identifying values for Cloud type (CT), Cloud type height (CTTH), precipitating clouds (PC), and Opera radar for any pixel in the images look into the legends. (link).
References
General Meteorology and Basics
- BLUESTEIN H.B. Synoptic Dynamic Meteorology in Midlatitudes - Volume I Principles of Kinematics and Dynamics; Oxford University Press.
- BLUESTEIN H.B. Synoptic Dynamic Meteorology in Midlatitudes - VolumeII Obeservations and Theory of Weather Systems; Oxford University Press.
- BROWNING K. A. (1986): Conceptual models of precipitation systems; Weather & Forecasting, Vol. 1, p. 23 - 41
- CONWAY B. J., GERARD L., LABROUSSE J., LILJAS E., SENESI S., SUNDE J. and ZWATZ-MEISE V. (1996): COST78 - Meteorology - Nowcasting, a survey of current knowledge, techniques and practice - Phase 1 report; Office for official publications of the European Communities
General Satellite Meteorology
- BADER M. J., FORBES G. S., GRANT J. R., LILLEY R. B. E. and WATERS A. J. (1995): Images in weather forecasting - A practical guide for interpreting satellite and radar imagery; Cambridge University Press
- ZWATZ-MEISE V. (1987): Satellitenmeteorologie; Springer Verlag, Berlin - Heidelberg - New York - London - Paris - Tokyo
Specific Satellite Meteorology
- DELDEN A. van (1997): The synoptic setting of a thundery low and associated prefrontal squall line in western Europe, Meteorol. Atmos. Phys. 65, 113-131 (1998)
- HONGNIAN D. A (1993): Synoptic climatology of convective weather in the Netherlands, KNMI, Scientific Reports; WR 93_04