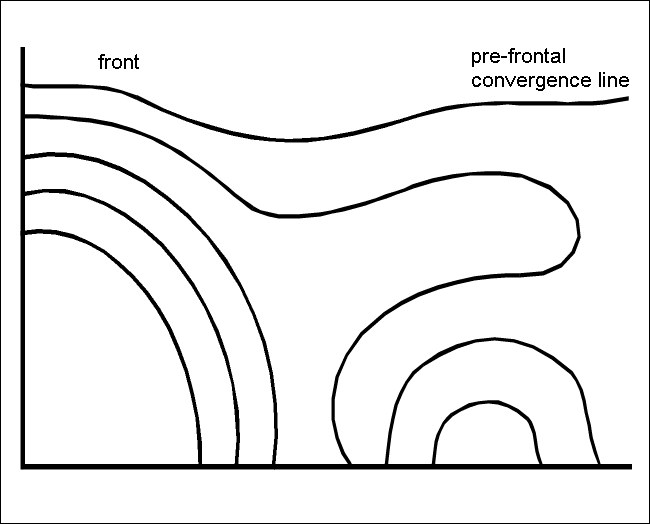
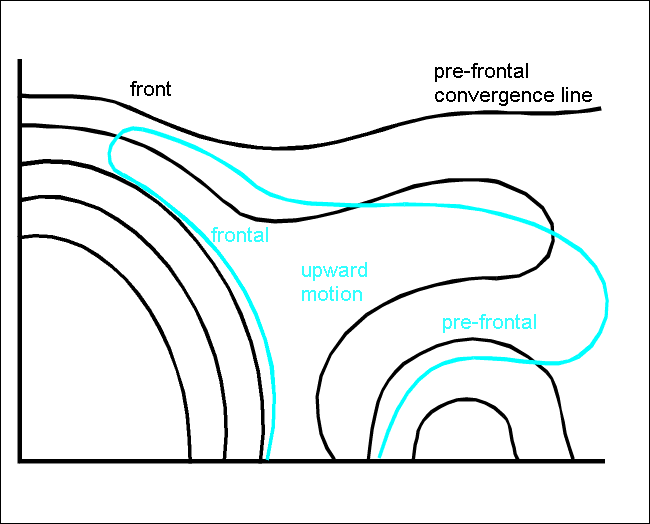
Typical Appearance In Vertical Cross Sections
There is diurnal variation of parameters corresponding to the development of convective convergence cloudiness; the parameters shown below are characteristic of the maximum rate of development around noon.
|
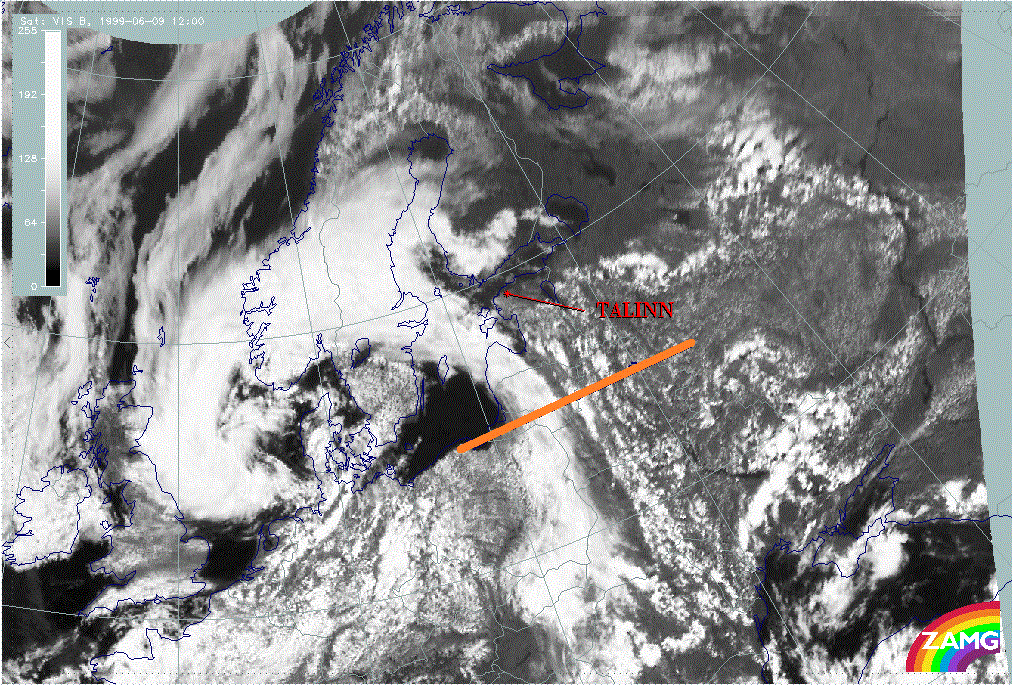
09 June 1999/12.00 UTC - Meteosat VIS image; position of vertical cross section indicated
|
|
|
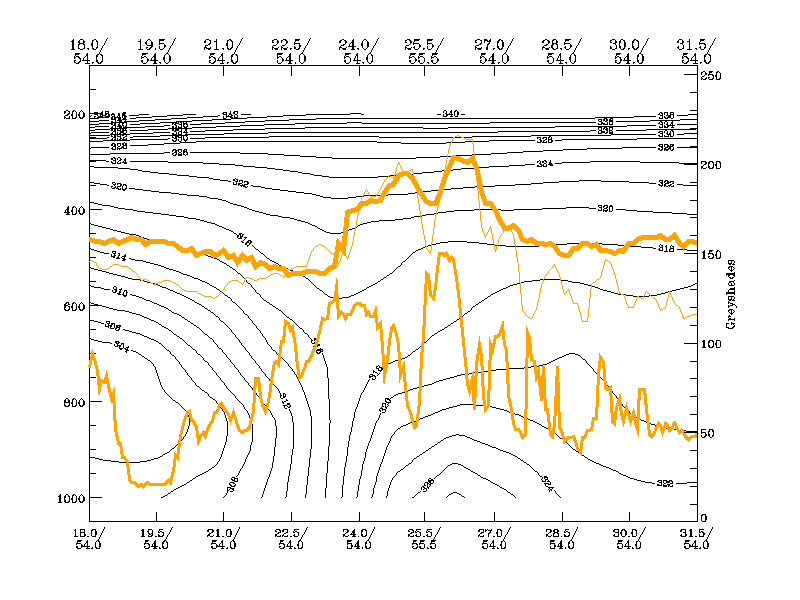
- Isentropes of equivalent potential temperature show a typical unstable stratification in low to middle levels depending on the intensity of the cloud systems. This can be seen as decreasing values of equivalent potential temperature with height.
|
|
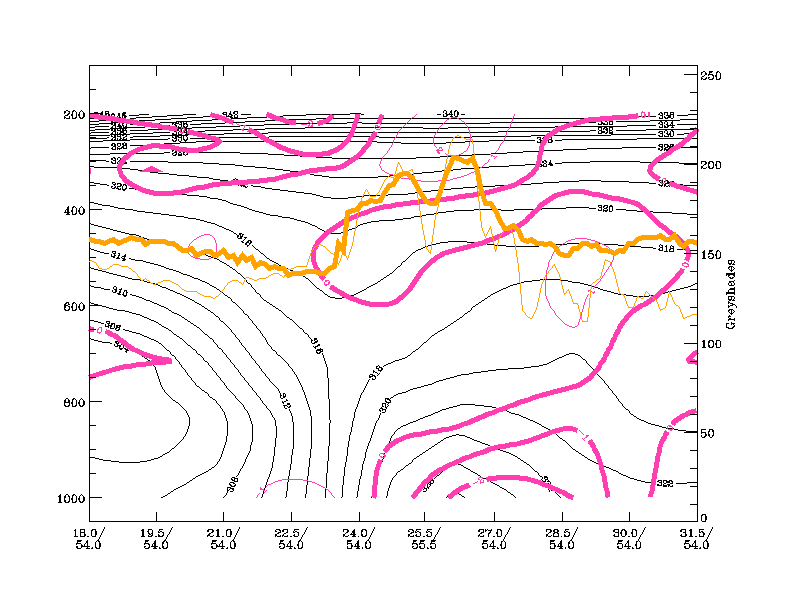
09 July 1999/12 UTC - Vertical cross section; black: isentropes (ThetaE), orange thin: IR pixel values, orange thick: VIS pixel
values
|
|
|
The Convergence Line is represented by the peak around 54N/26E. Tbe peak immedietely to the E (54N/23E) represents the frontal cloudiness.
- Convergence is found mainly in the lower levels, sometimes only at 925 hPa. However, it extends up to about 800 hPa in places. Upward motions can be observed reaching a slightly higher level.
|
|
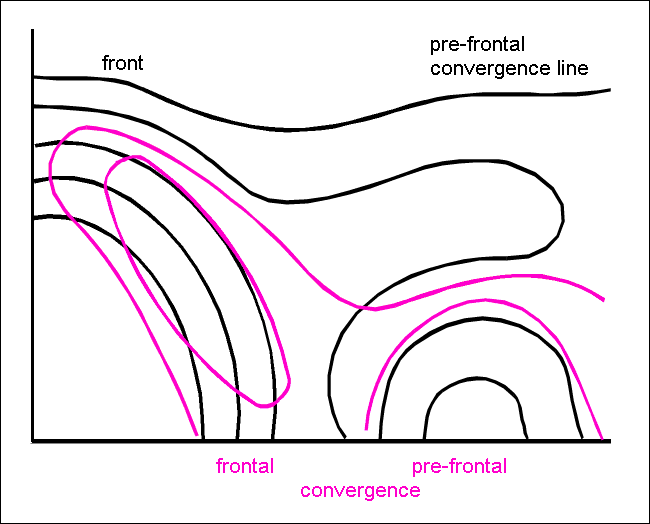
09 July 1999/12.00 UTC - Vertical cross section; black: isentropes (ThetaE), magenta thin: divergence, magenta thick: divergence,
orange thin: IR pixel values, orange thick: VIS pixel values
|
|
|
There is distinct convergence in lower layers up to 850 hPa in the area of the peak representing the convergence cloud band.
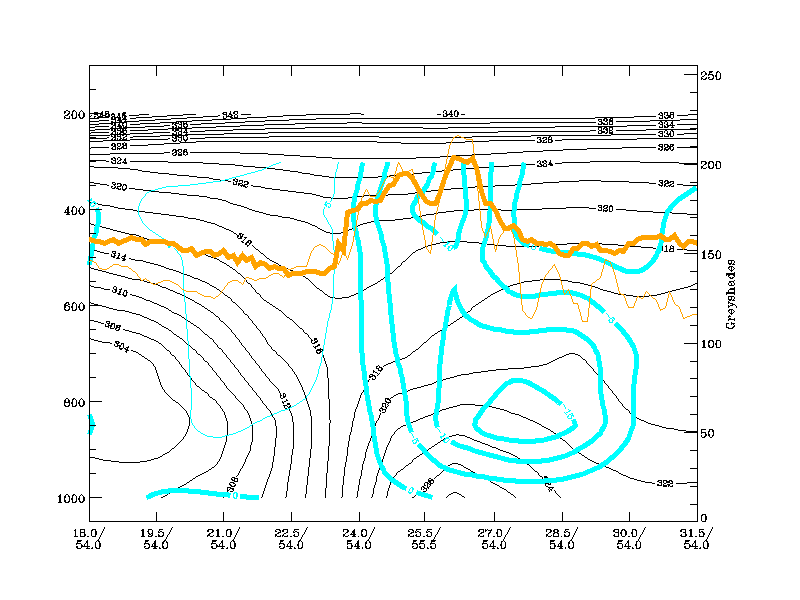
- Vertical motion is upward in lower and middle layers and downward at higher levels. Upward motion usually reaches a higher level than the convergence.
|
|
09 July 1999/12.00 UTC - Vertical cross section; black: isentropes (ThetaE), cyan thick: vertical motion (omega) - upward motion,
cyan thin: vertical motion (omega) - downward motion, orange thin: IR pixel values, orange thick: VIS pixel values
|
|
|
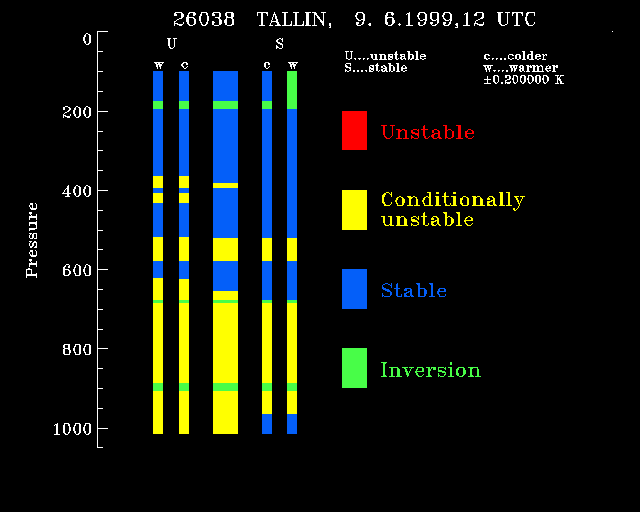
- Radiosondes within the convergence cloud bands show unstable or conditionally unstable layers up to 650 hPa separated by thin stable layers or even small inversions.
The thick central column represents the radiosounding (the thin columns represent fictious soundings as they would appear if the temperature changes by a small amount at various levels. Features appearing in both types of sounding indicate firm features of the sounding.). There is a thick, conditionally unstable, layer from the surface up to 650 hPa and some thinner layers above.
|
09 June 1999/12.00 UTC - radiosonde Tallin, stability analysis (blue: absolutely stable, yellow: conditionally unstable, red:
absolutely unstable, green: inversion)
|
|
|
Profile of stability derived from the radiosonde at Tallin at 9 June 1999, 12 UTC.