Table of Contents
Cloud Structure In Satellite Images
- The satellite image shows in the initial stage a cyclonically curved Comma feature (see Comma ) which is situated within the cold air mass behind a Cold Front (CF) in its initial stage; during the further development the Comma increases in size until in the mature stage when a synoptic scale spiral is reached.
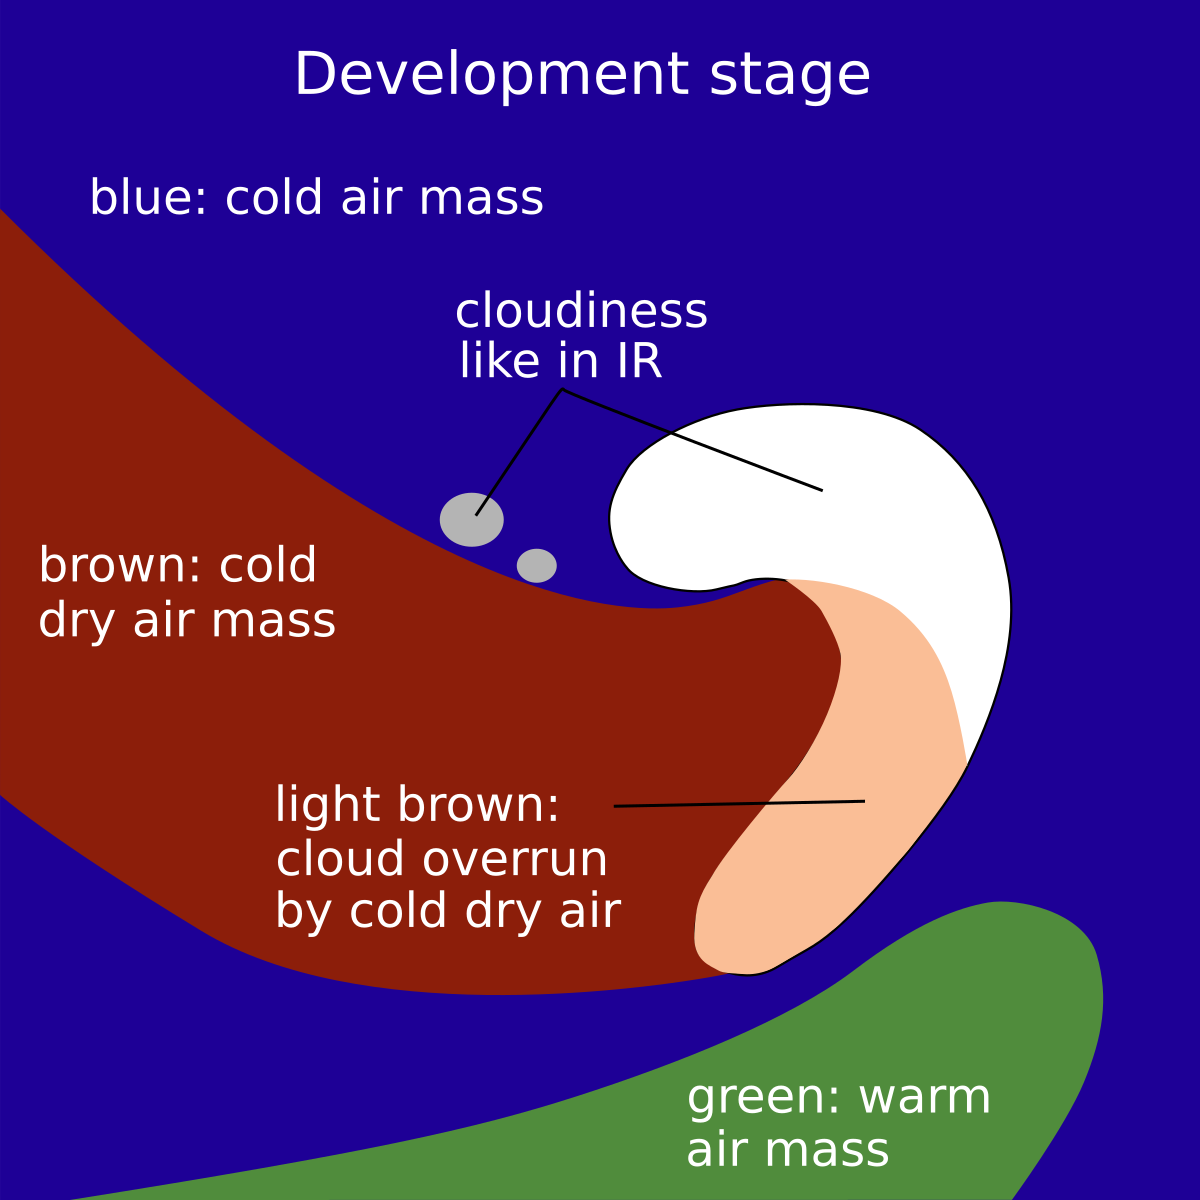
- During the development of a CAD the cloud configuration at the rear side of the previous CF, the approach of the system is often so fast that the mature stage (the “Comma front”) is rather close to the front, leading to a double structure of frontal cloud bands.
Appearance in the basic channels:
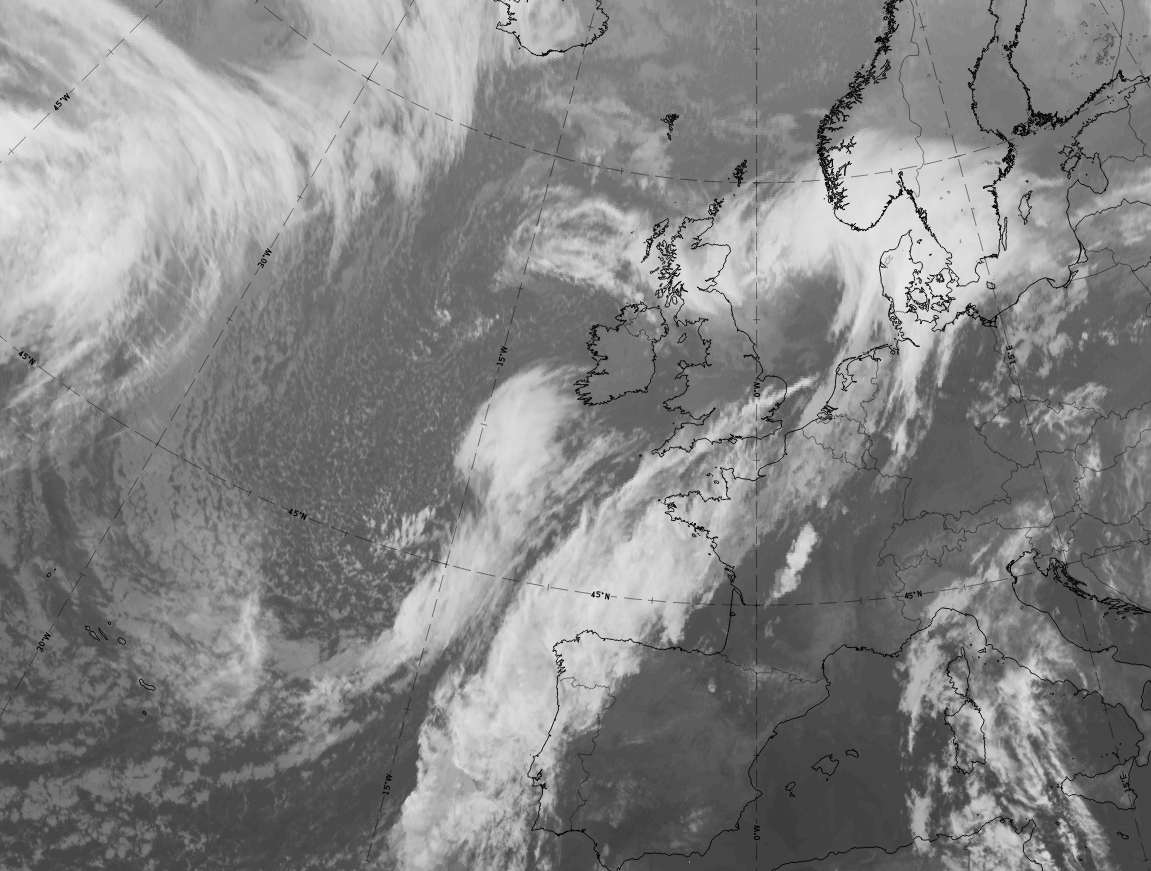
In general, the cloud spiral in the IR and VIS images has a white and structured appearance, indicating multi-level cloudiness with embedded Cbs (see Meteorological physical background and Weather events).
In the initial stage, a southward continuation of the Comma Tail can be observed in the form of more or less continuous cloud patches in the lower level cloud field.
The WV image is characterized by grey to white pixel values, which correspond to those in the IR image. On the rear side of the Comma structure the WV image is characterized by a sharp gradient and a black stripe indicating dry air.
Particularly in the initial stages, the brightest grey shades can be observed within the Comma tail, which is situated within the area of the left exit region of a jet streak (see Front Intensification By Jet Crossing).
|
Appearance in the basic RGBs:
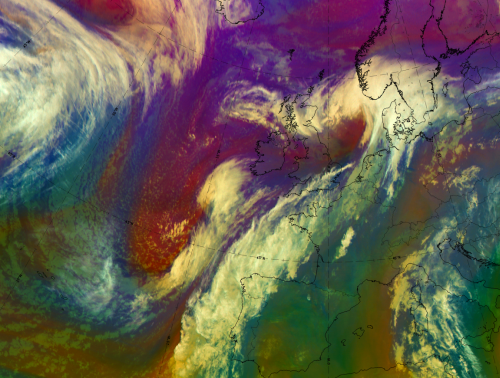
Airmass RGB:
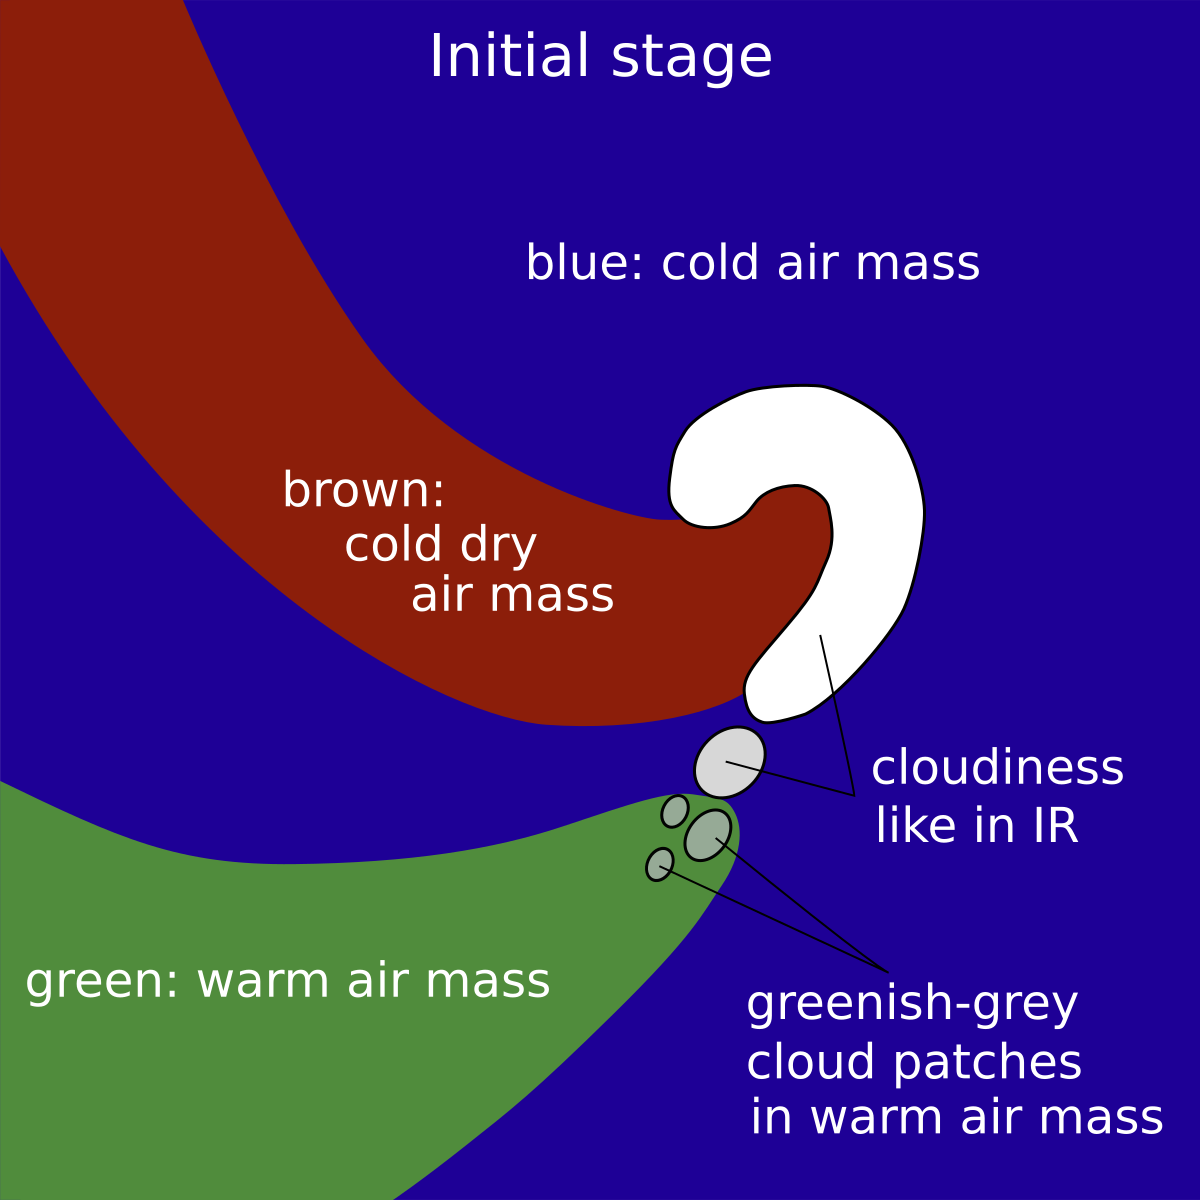
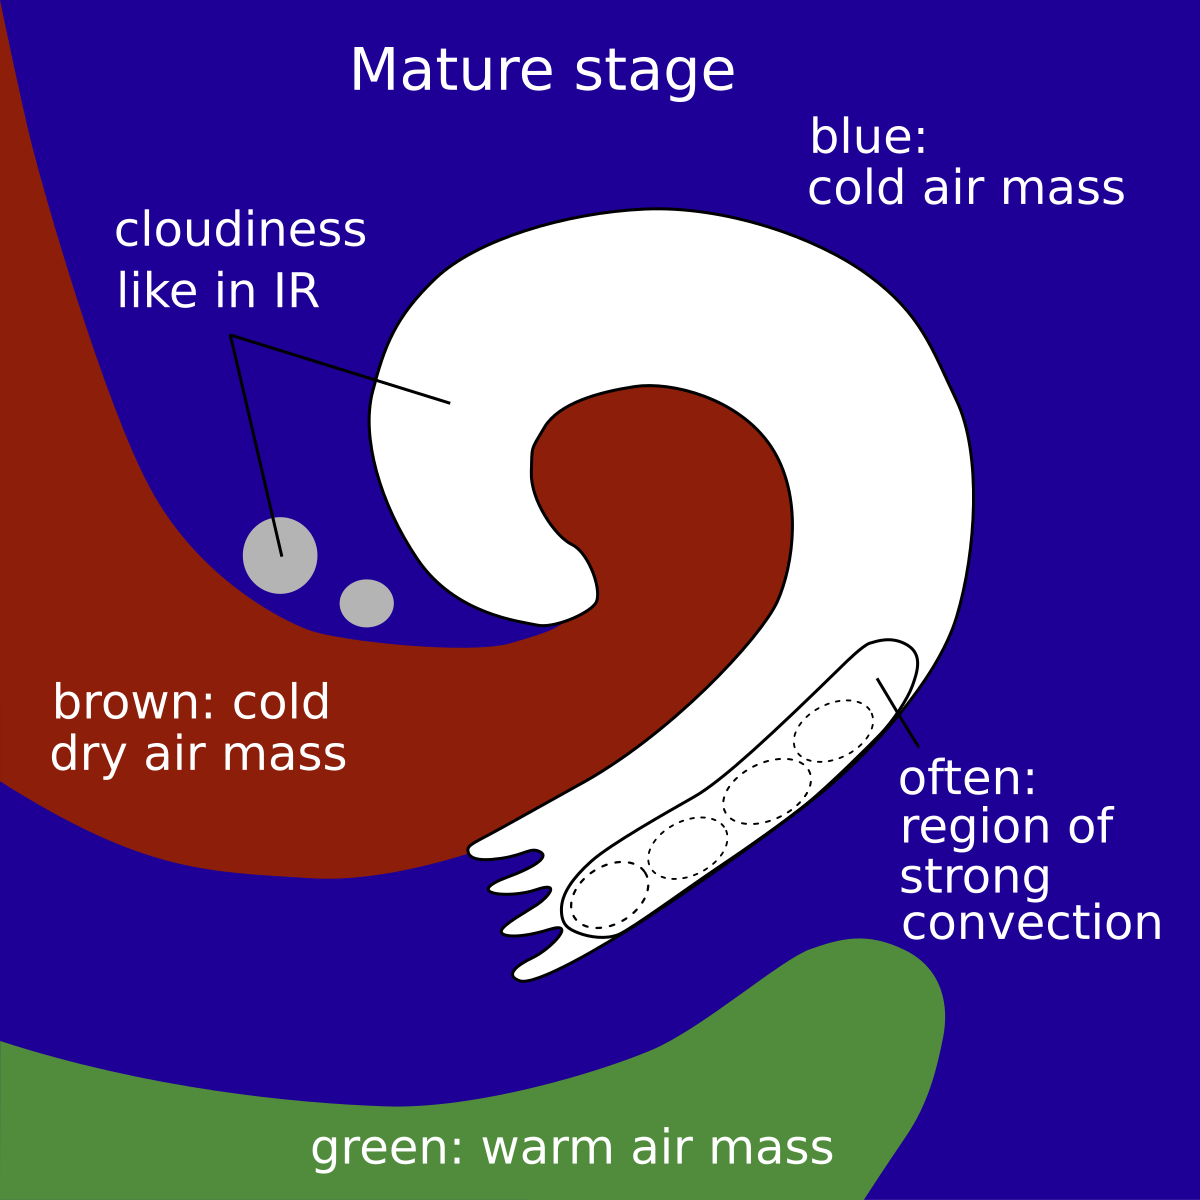
The Airmass RGB shows dark blue and brown colours at the rear side of the comma throughout its development, indicating that the whole CAD process takes place within cold and dry airmasses. The brownish colour is at the rear of the comma cloud feature and very often penetrates the cloud patches that form the continuation of the comma tail, as well as the developing cloud band, during the process. Sometimes, especially in the initial comma stages, these cloud patches have also some green colours ahead of them, representing rather warmer air masses.
The comma cloud looks very similar to the IR image in all stages, but os mostly overlaid by the brownish colour representing the penetrating dry air. This is especially true for the comma tail, which consists of low cloud.
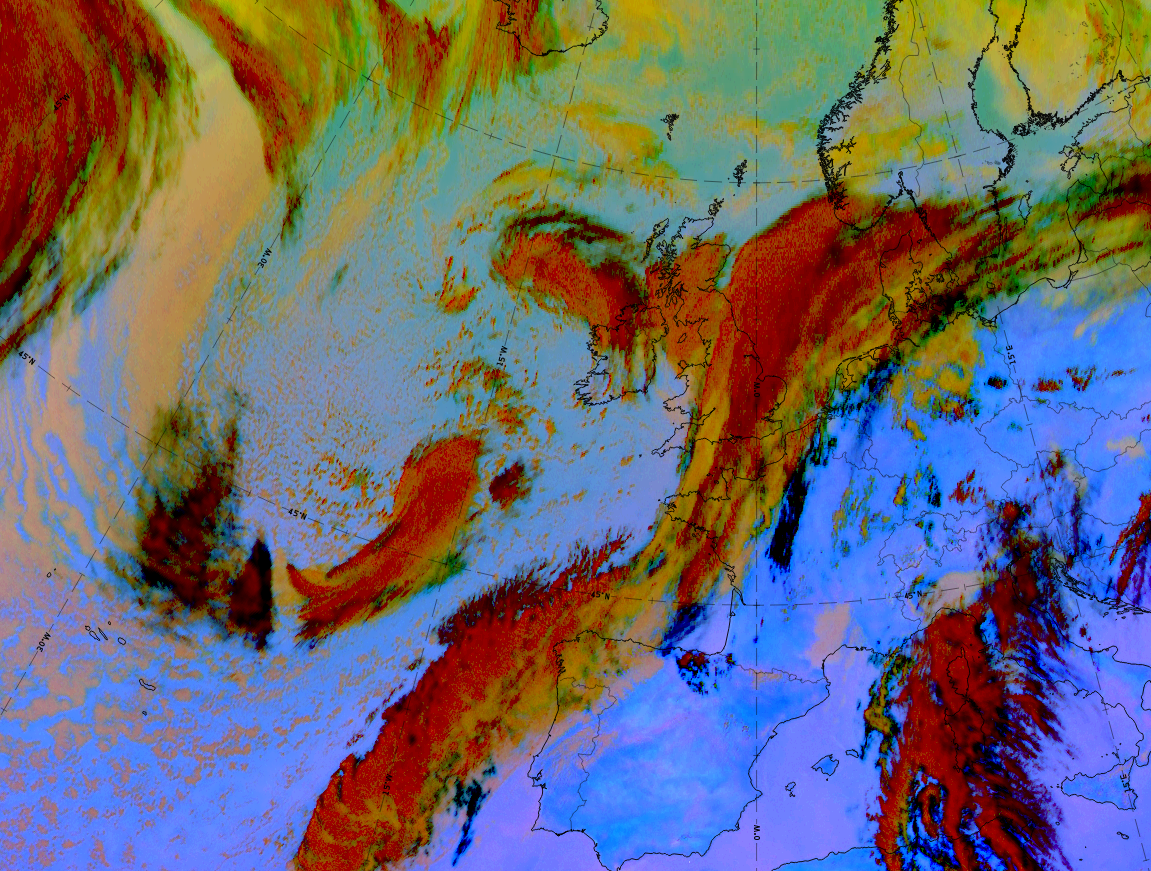
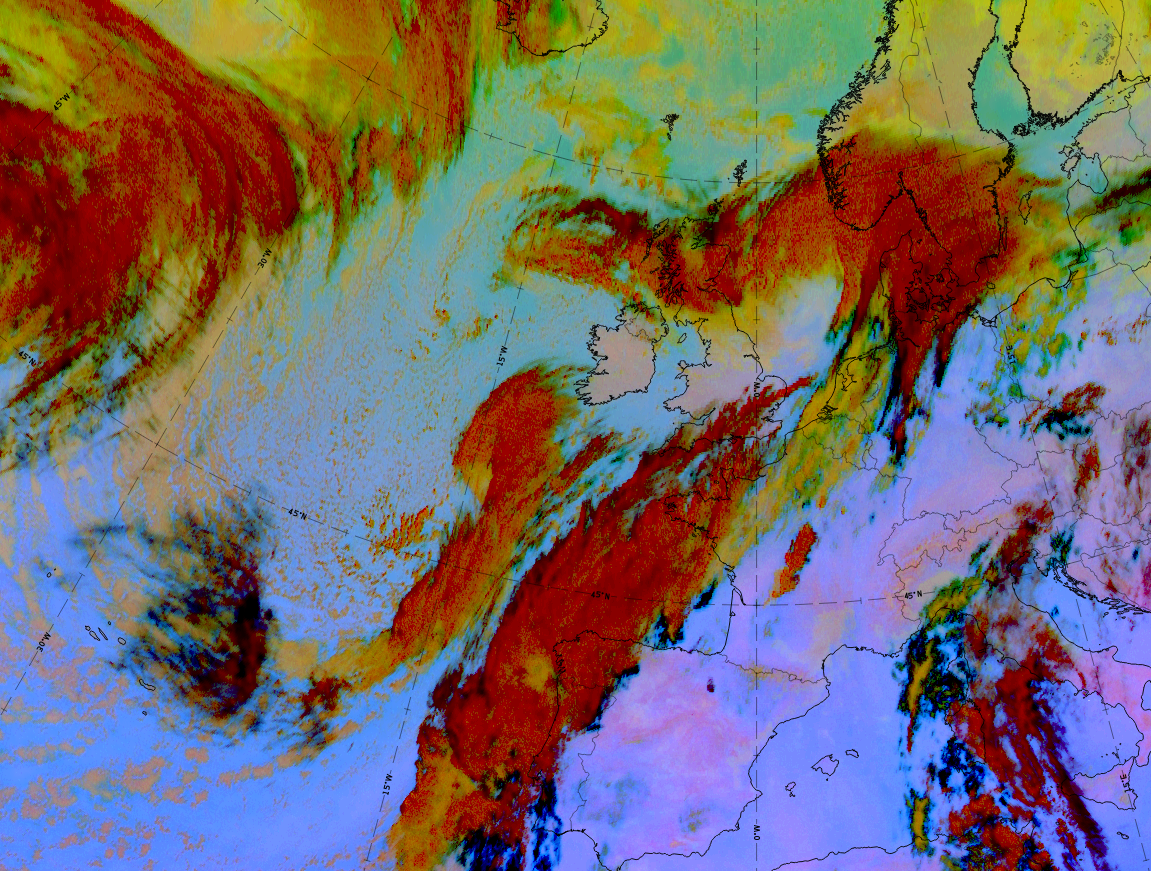
Dust RGB:
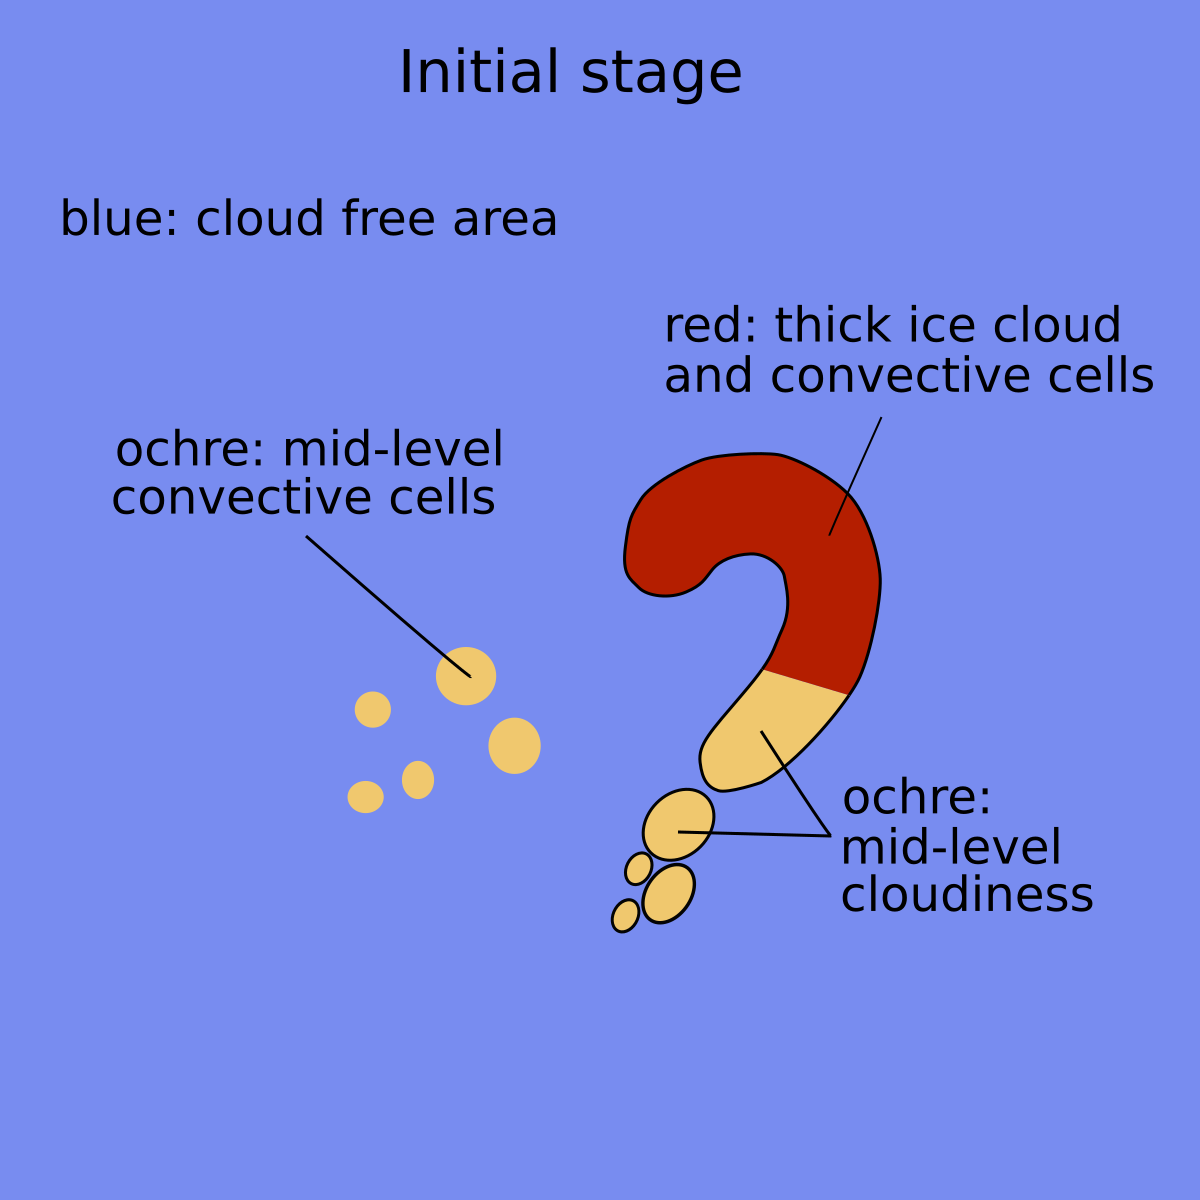
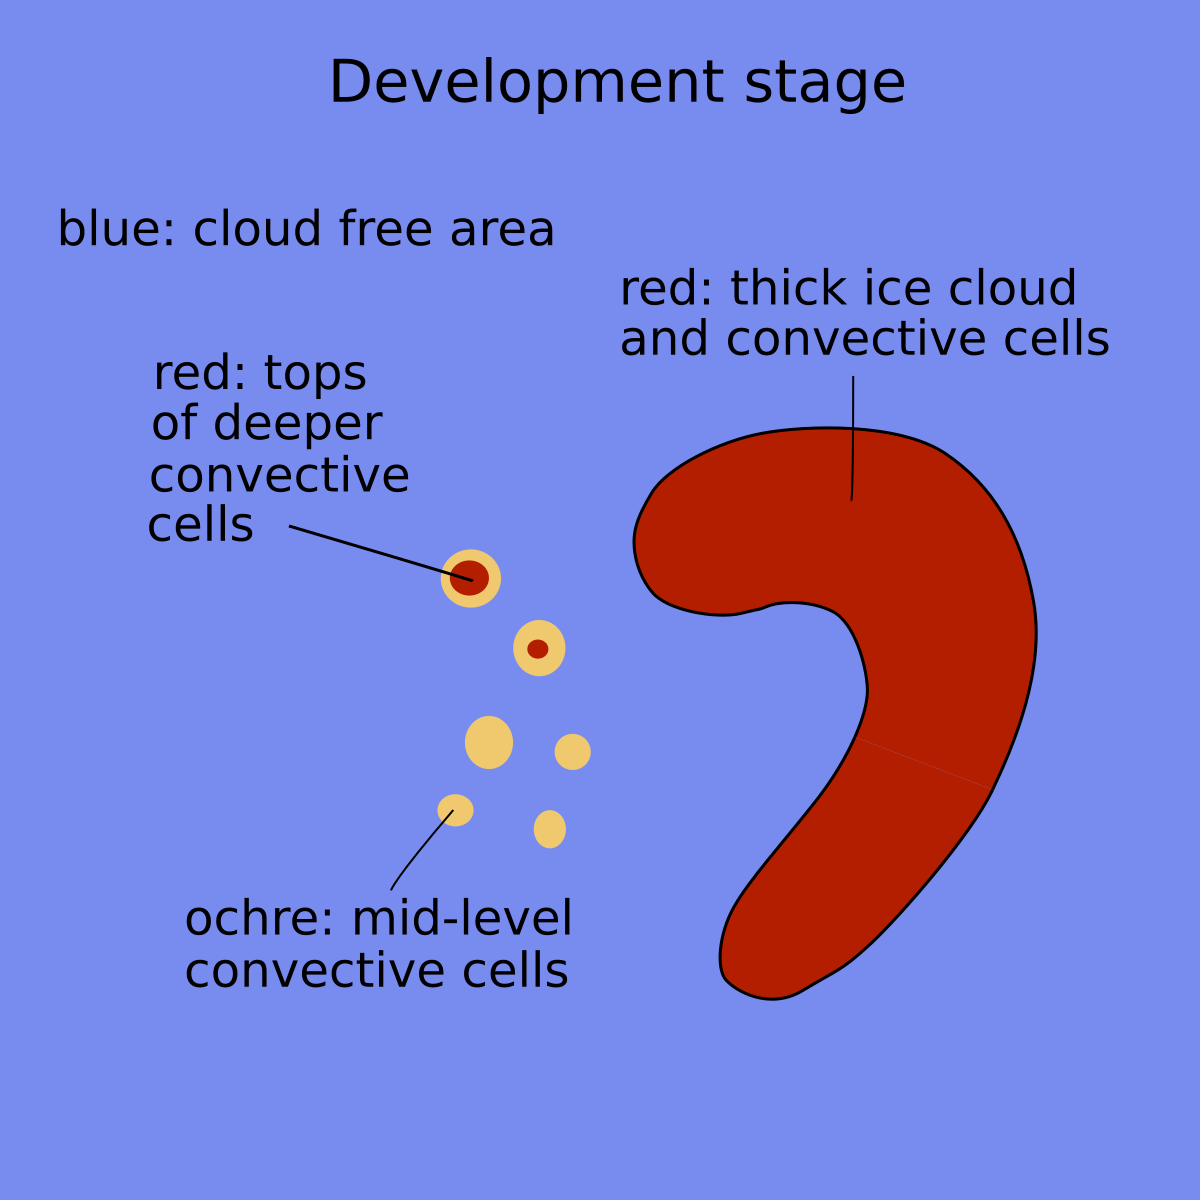
Unlike for other cloud configurations, the Dust RGB shows blue colours, representing a cloud-free surface, in the surroundings of the CAD cloud configurations. However, there are very often low cloud configurations too, which show up as ochre colours.
The comma cloud is dark red in every development stage, representing the thicker and the convective cloud parts, which are very often connected to the comma head, very often with and ochre areas, representing the lower cloud parts, in the comma tail. During the progress of a CAD development more red-brown colour can develop, especially in the tail area.
 |
 |
 |
 |
 |
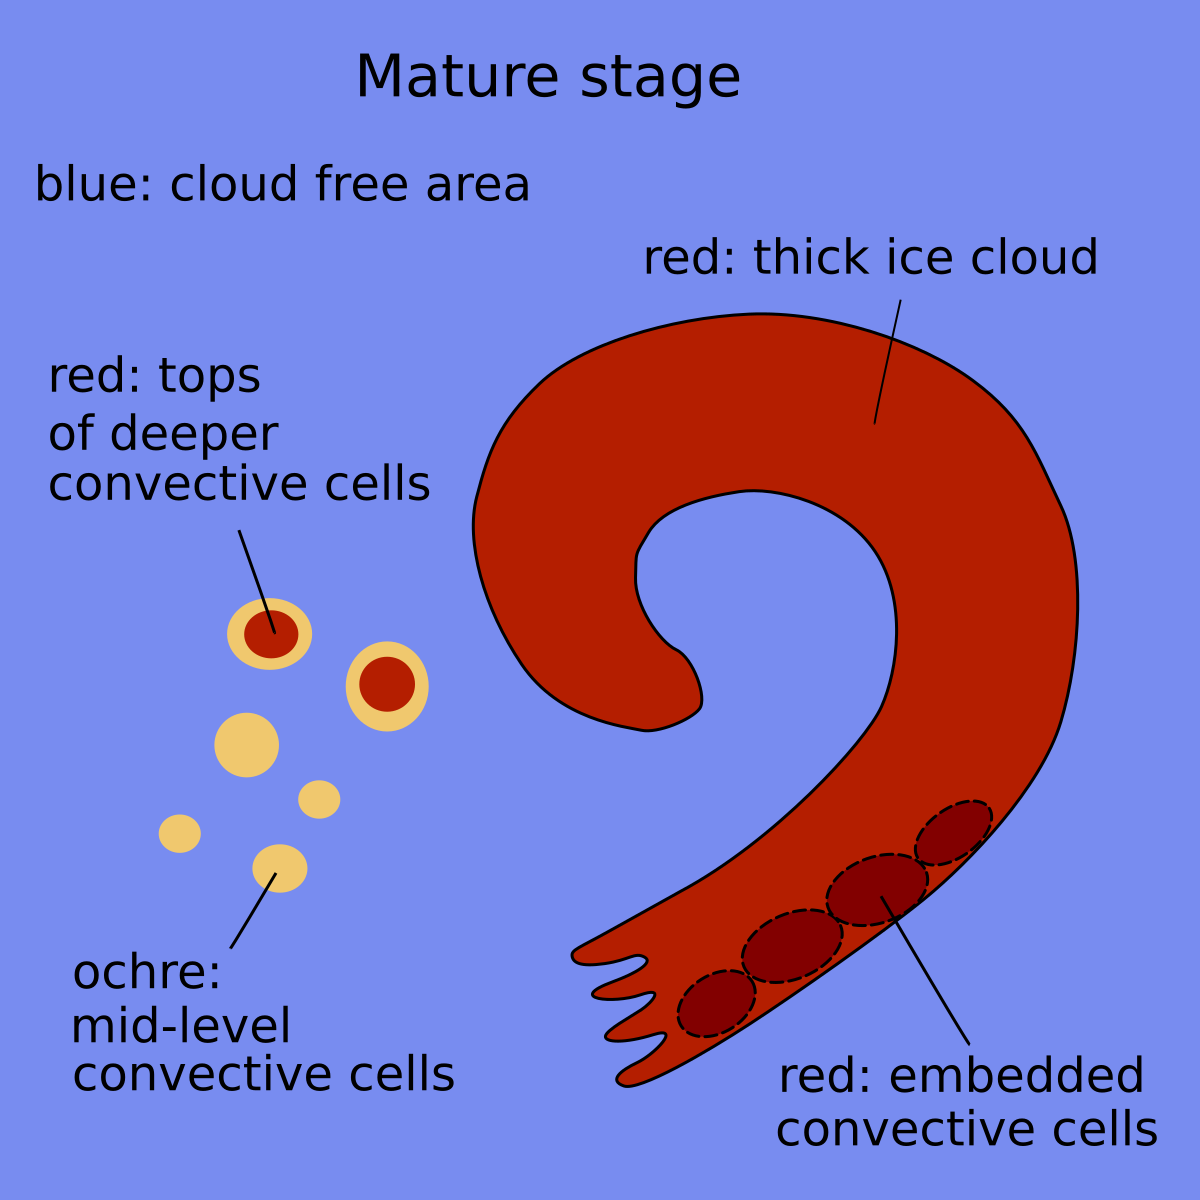 |
Schematics for basic RGBs for three stages of development.
Left: Airmass RGB; right: Dust RGB.
Example from 13 October 2019/ 06 - 18 UTC
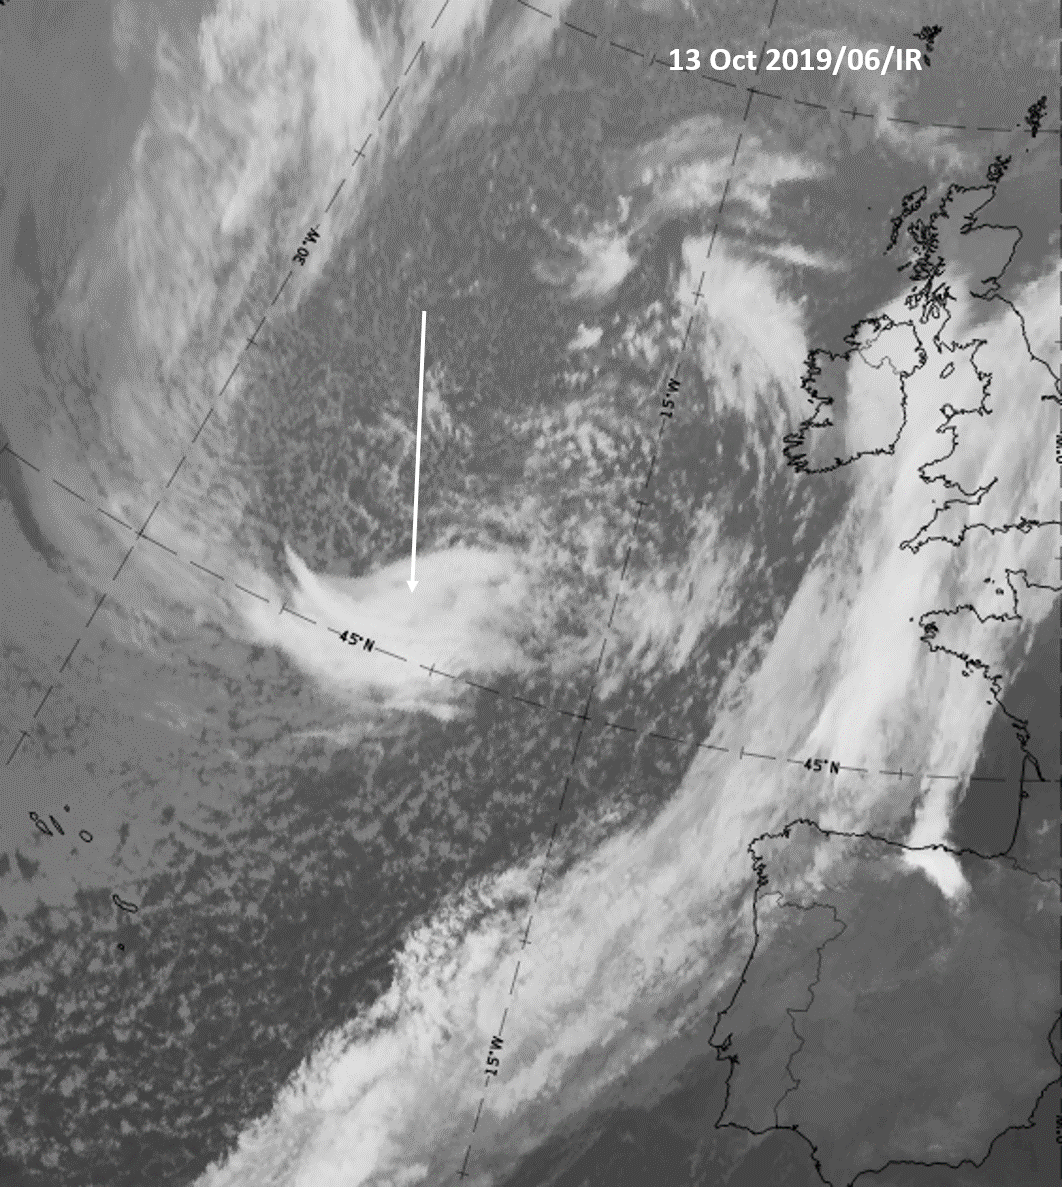
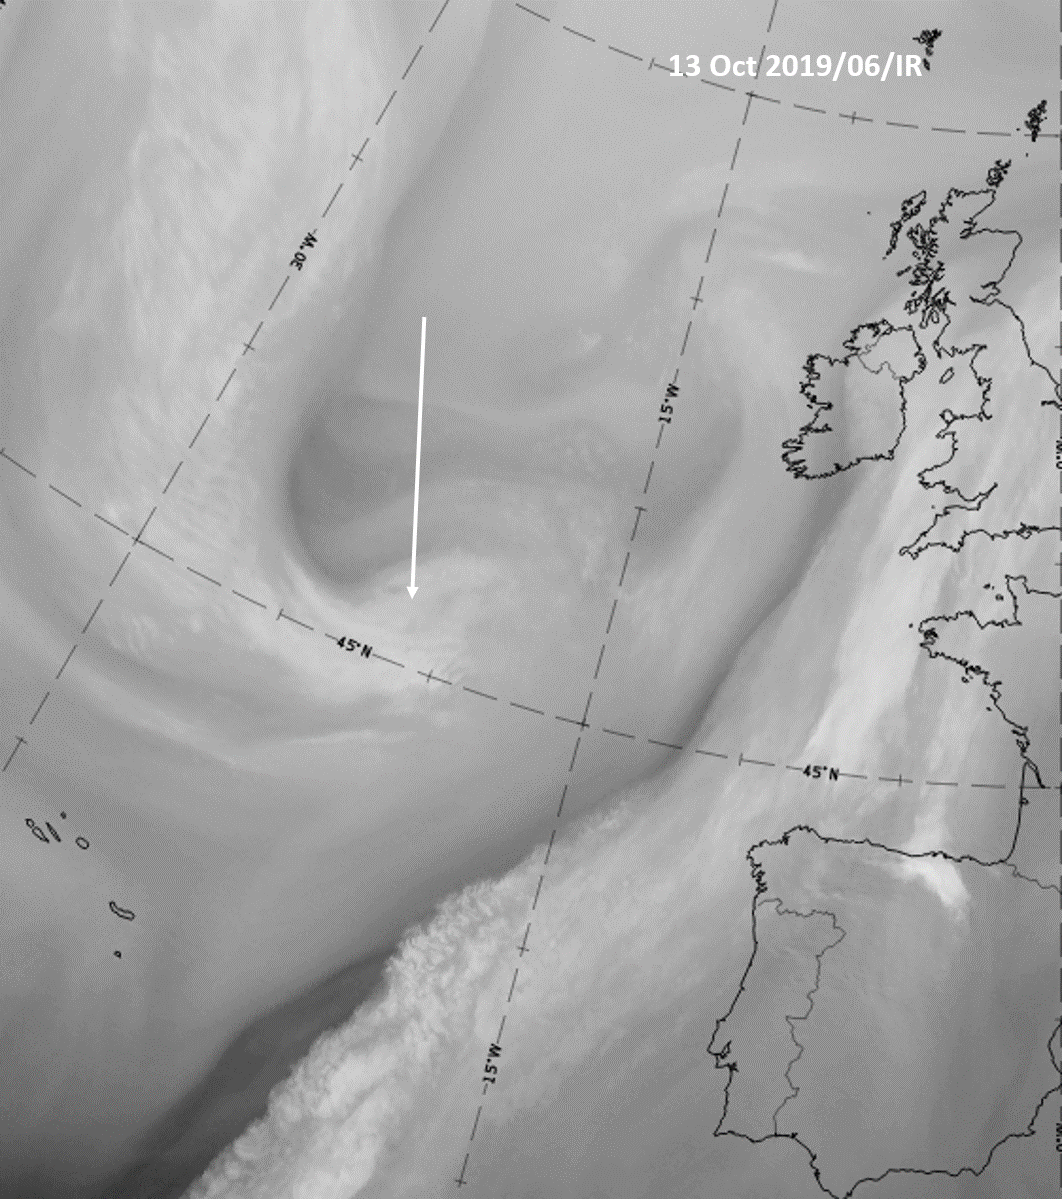
The Sequence of images below shows a CF cloud band extending from the southern parts of the Atlantic northward to the British Isles, which moves slowly eastward. In the trough of cold air at the rear, a comma configuration (indicated by the arrow) turns from east-west to north-south orientation, approaches the frontal cloud band and expands and intensifies distinctly.
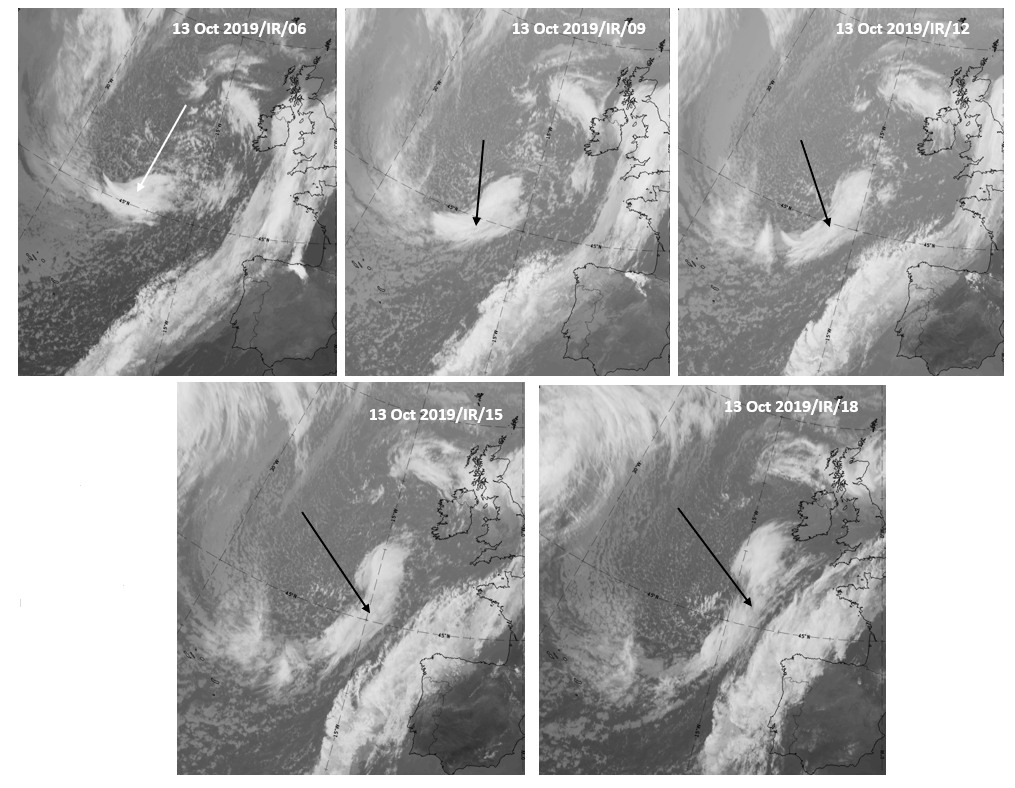
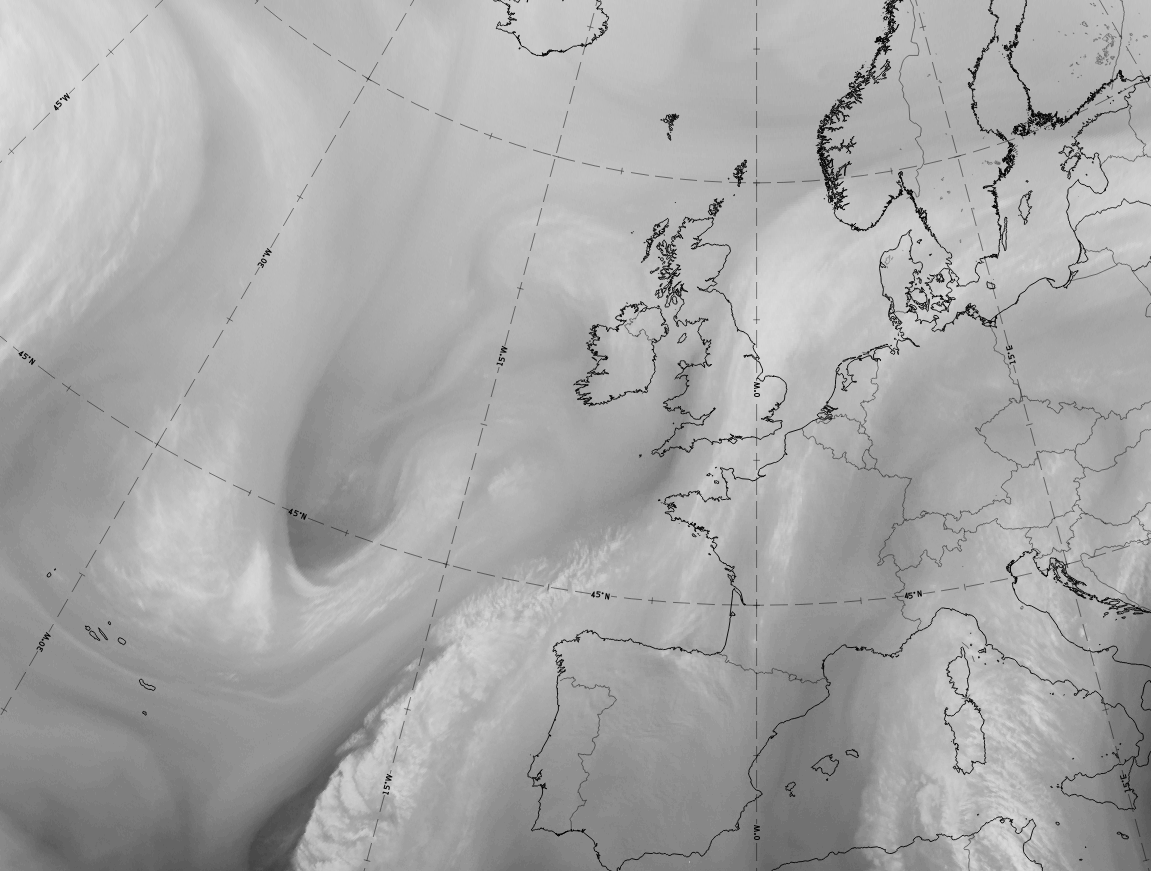
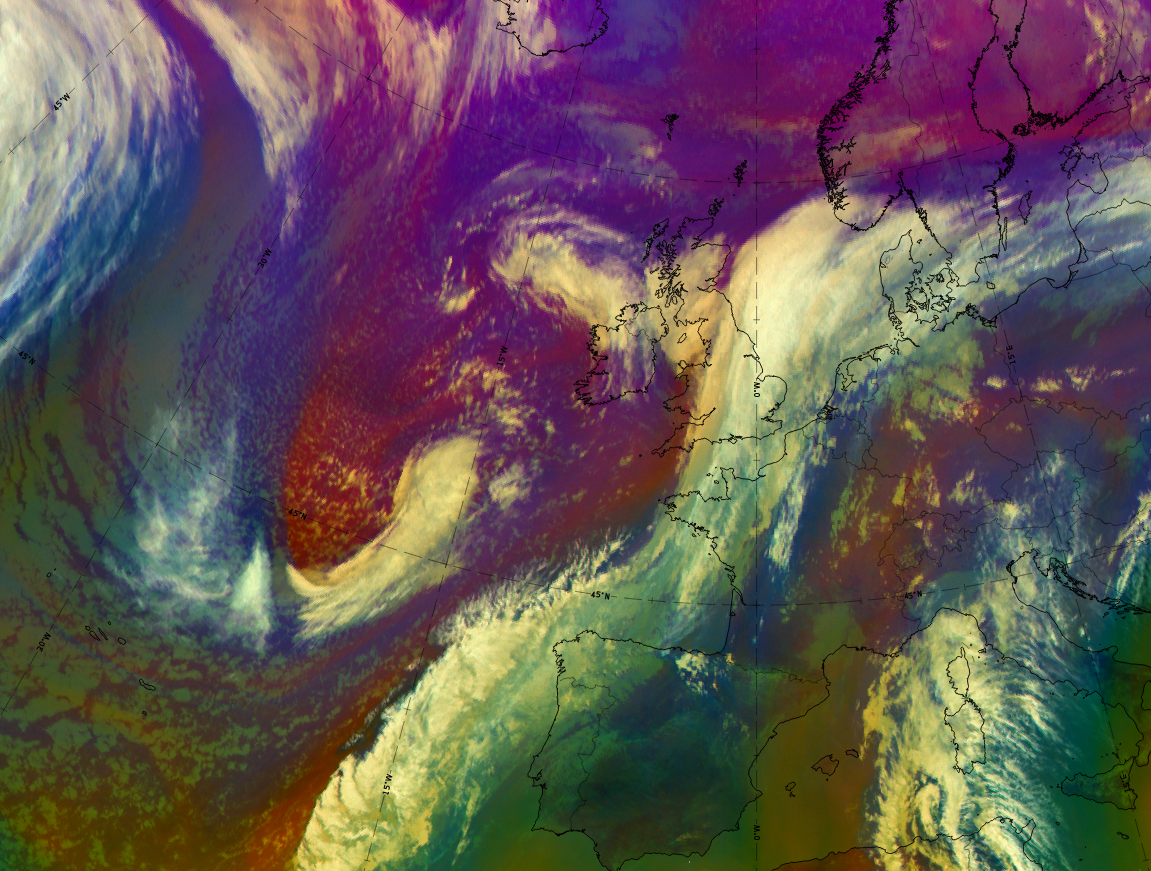
At 6 UTC on 13 October 2019 the basic satellite channels, the basic RGBs and the NWCSAF parameters show the initial stage of a CAD, the comma stage.
|
|

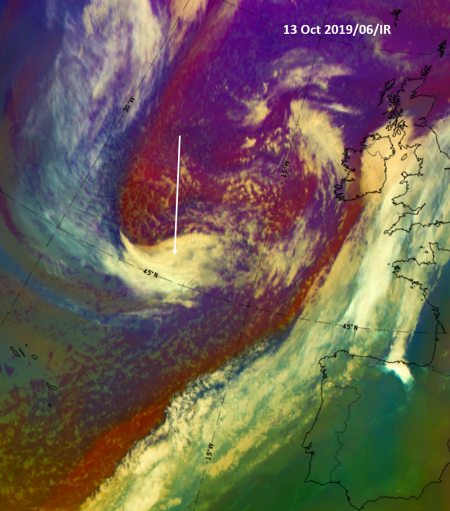
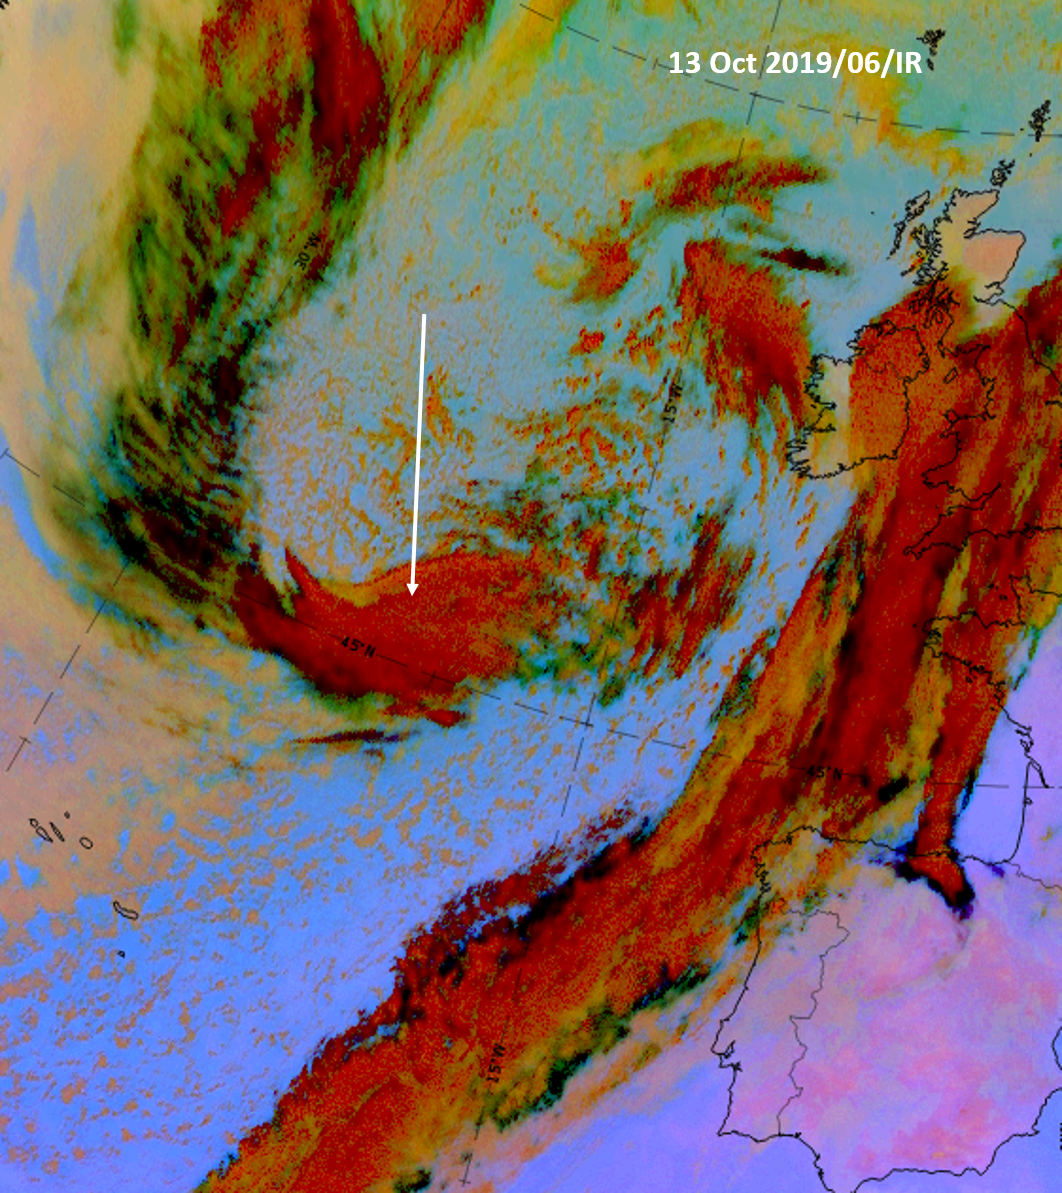
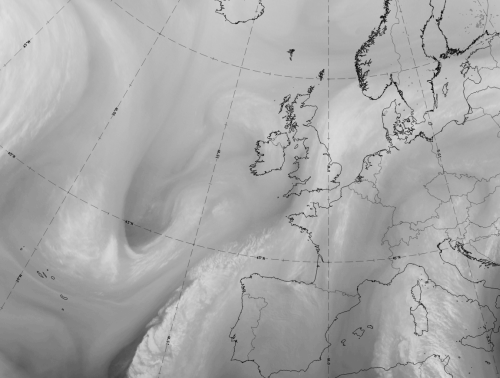
13 October 2019, 06UTC: 1st row: IR; 2nd row: WV (above) + Airmass RGB (below); 3rd row: Dust RGB + image gallery
*Note: click on the Dust RGB image to access image gallery (navigate using arrows on keyboard)
| IR | White and structured. |
| HRV | Not available at this time. |
| WV | Bright and structured with a distinct dark grey stripe along the rear edge approaching from the north. |
| Airmass RGB | Within blue and dark-brown airmasses indicating cold and cold -dry air; the dark grey stripe in the WV channel shows up as a brownish stripe from the north, bending along the rear side of the comma. The comma cloud is similar to that in the IR image but some structures are more distinct in this RGB: a brighter small stripe indicates the jet axis, there and the comma cloudiness to its north has a light brown shading which indicates penetrating dry air. |
| Dust RGB | Dark red and structured appearance indicating thick ice cloud. |
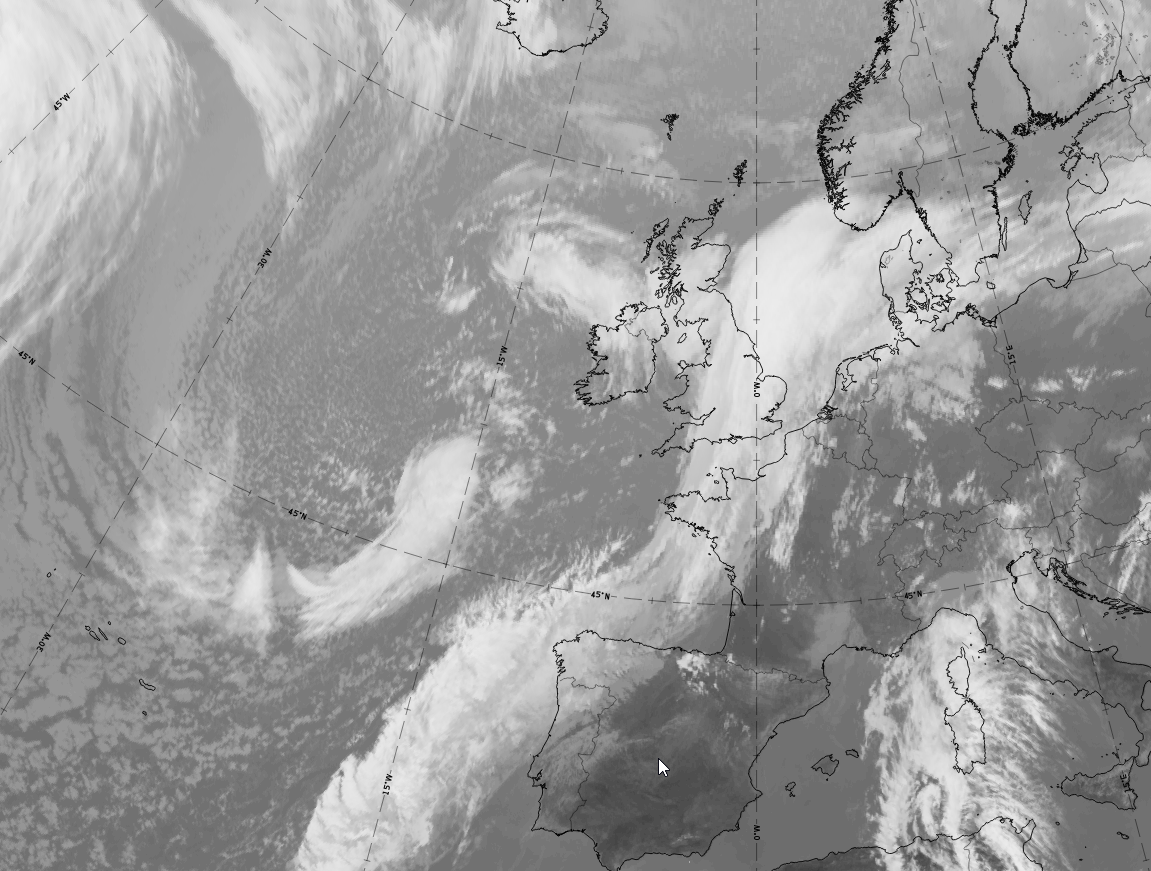
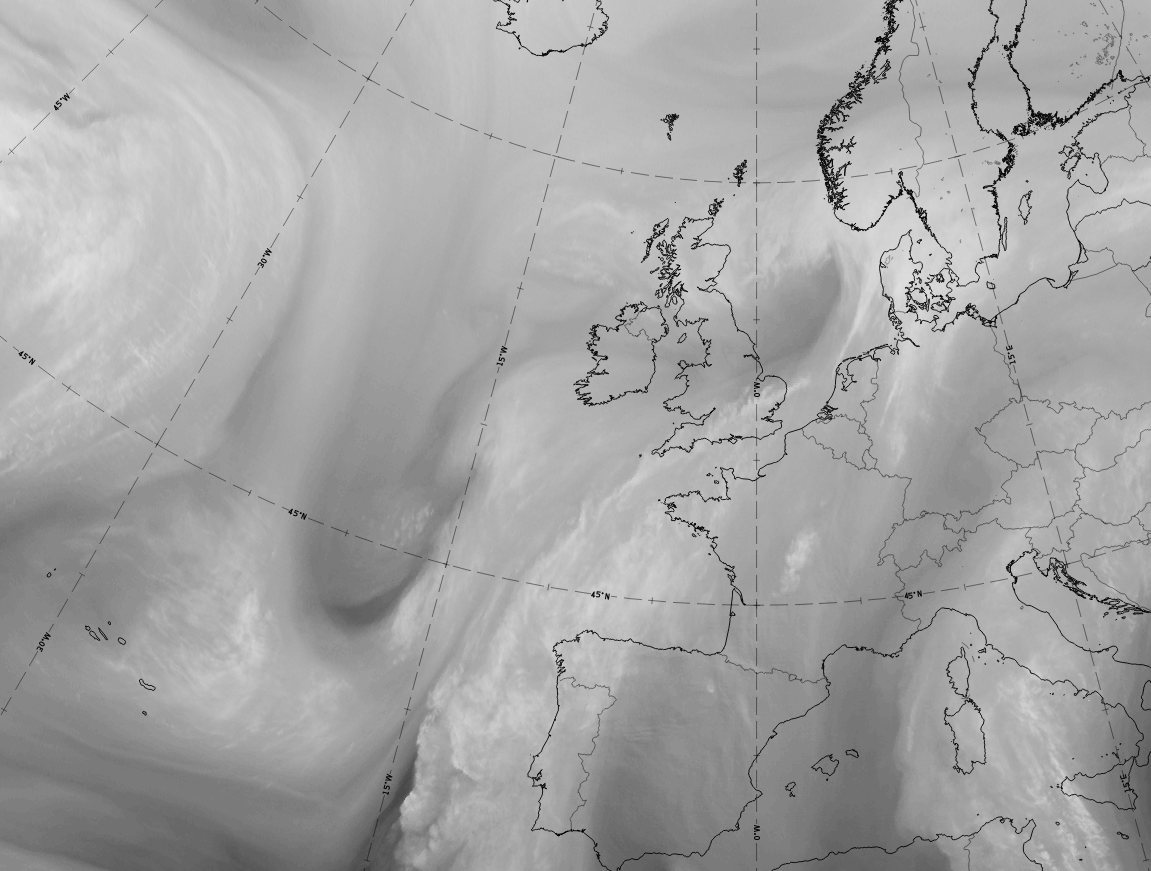
At 12 UTC on 13 October 2019 the comma has increased in size; this is an example of the Development stage.
|
|
|
|


13 October 2019, 12UTC: 1st row: IR (above) + HRV (below); 2nd row: WV (above) + Airmass RGB (below); 3rd row: Dust RGB + image gallery.
*Note: click on the Dust RGB image to access image gallery (navigate using arrows on keyboard)
| IR | White and structured; increased size; dark-grey continuation of the comma tail westward (better seen in HRV and Dust RGB). |
| HRV | Bright and structured; the continuation of comma tail westward is cellular. |
| WV | Bright and structured with a distinct dark grey stripe and area along the rear edge approaching from the north. |
| Airmass RGB | Within blue and dark-brown airmasses indicating cold and cold-dry air; the dark grey stripe in the WV channel shows up as a brownish stripe and area from the north, bending along the rear side of the comma. The comma cloud is similar to that in the IR image. |
| Dust RGB | Dark red and structured appearance indicating thick ice cloud in the comma head and tail; ochre colours at the leading edge of the comma and in the westward continuation of the comma tail; black stripes and fibrous areas indicate high translucent cloud. |
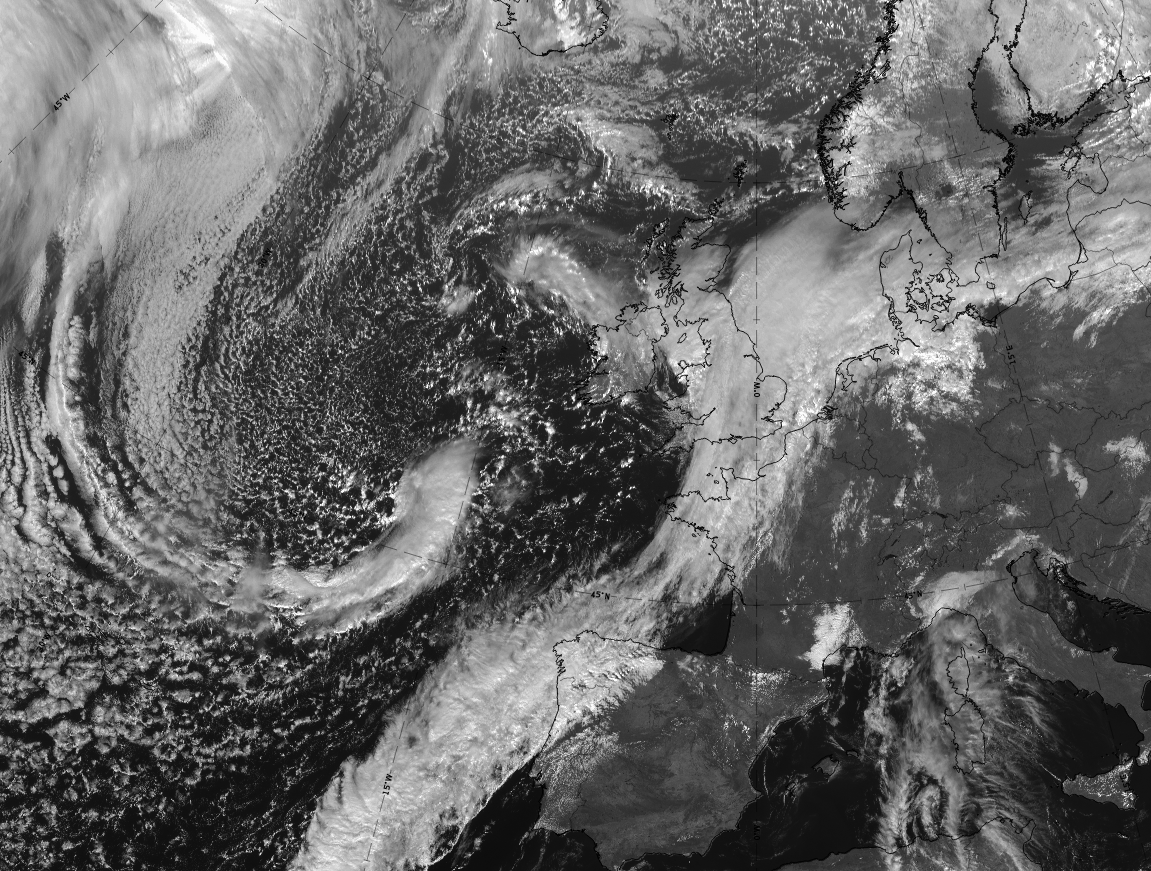
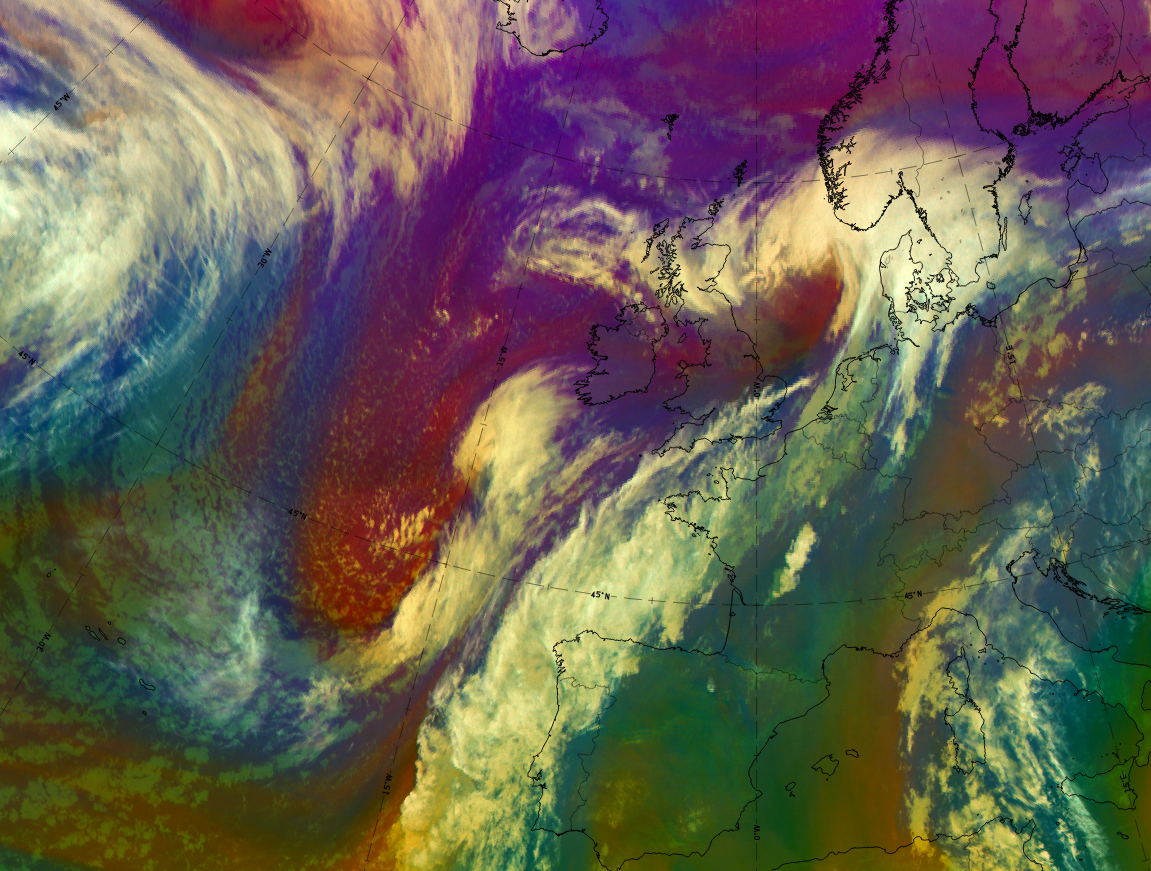
At 18 UTC on 13 October 2019 the comma has strongly expanded and intensified and is close to the eastern frontal cloud band. Because of its size and frontal characteristics, this is the mature stage of a CAD, the Comma front.
|
|

13 October 2019, 18UTC: 1st row: IR (above); 2nd row: WV (above) + Airmass RGB (below); 3rd row: Dust RGB + image gallery
*Note: click on the Dust RGB image to access image gallery (navigate using arrows on keyboard)
| IR | Strongly increased size; bright and structured; dark-grey continuation of the comma tail south- westward (better seen in HRV and Dust RGB). |
| HRV (from 15 UTC) | Bright and structured; the continuation of the comma tail westward is cellular. |
| WV | Bright and structured with a distinct dark grey stripe along the rear edge. |
| Airmass RGB | The dark-brown colours indicate cold/dry airmasses at the rear side; blue stripes indicating cold air to the west and southwest of the dry area. The comma cloud is similar to that in the IR image. |
| Dust RGB | Dark red and structured appearance indicating thick ice cloud in the comma head and tail; ochre colours at the leading edge of the comma and in the westward continuation of the comma tail, indicating mid-level cloud. |
Meteorological Physical Background
Based on literature and the experience of case studies from one year made at ZAMG, the following aspects of the physical background can be summarized:
- Upper level forcing represented by PVA maxima in connection with both:
- a propagating and deepening upper level trough
- a left exit region of a moving jet streak
- Considerable unstable conditions in the middle troposphere below the Comma.
- Pre-existing baroclinicity within the cold air close to and south of the Comma tail.
PVA maxima are an important feature for Comma development (see Comma ). As has been described in the relevant chapters, Commas may develop in front of upper level troughs with curvature vorticty dominating the process, as well as within the left exit region with shear vorticity dominating. In the case of a Cold Air Development both processes are relevant, but in any case the jet streak component of the physical background is very important. In literature very often the Commas are traced backward to the rear side of the upper level trough where they form in the left exit region of a following jet streak. The curvature vorticity maximum can be found more in the northern part of the Comma, in accordance with the spiral structure there. The shear vorticity maximum is more in the southern part of the Comma leading to the PVA maximum superimposed on the Comma tail. The jet axis crosses the Comma in the southern part, dividing regions of deeper convection in the north from those with more shallow convection in the south. The latter is connected with growing baroclinicity and will be discussed below. This situation stays nearly the same during all stages of the Cold Air Development. The intensive moving PVA maxima are regarded as the reason for cyclogenesis taking place within the cold air mass.
|
|
|
06 March 2009/06.00 UTC - Meteosat 8 IR 10.8 image; cyan: height contours 500 hPa
|
06 March 2009/06.00 UTC - Meteosat 8 IR 10.8 image; yellow: isotachs 300 hPa, red: vorticity advection 300 hPa
|
|
|
|
|
|
06 March 2009/06.00 UTC - Meteosat IR image; blue: shear vorticity 300 hPa, brown: curvature vorticity 300 hPa
|
As has been described in the Comma chapter (see Comma ) two main processes may lead to the development of a Comma: CISK - which describes an interaction between large and small scale convection and/or a baroclinic state of the troposphere. Although both processes act together, one of the processes dominates the other in different developments. In the case of a Cold Air Development baroclinicity plays a crucial role.
As described in the previous chapter (see Cloud structure in satellite image ) in the initial stage mostly an organized southward continuation of the Comma tail in the low cloud area can be observed. This seems to represent the baroclinic zone which is confirmed by the existence of a weak surface trough with a front-like wind shift, a weak TFP and in some cases a zero line of temperature advection. The latter does not indicate strong temperature differences. In contrast to Cold Fronts these parameters do not mark a change to a different air mass, but only small drops in temperature and dew point.
During the Cold Air Development the baroclinic zone intensifies, which can be seen as increasing cloud as well as in a strengthening of all parameters mentioned before.
|
|
|
|
|
06 March 2009/00.00 UTC - Meteosat 9 IR10.8; magenta: height contours 1000 hPa, red: temperature advection 500/1000 hPa, blue: thermal front parameter 500/850 hPa
|
06 March 2009/00.00 UTC - Meteosat 9 IR10.8; blue: thermal front parameter 500/850 hPa, green: thickness 500/1000 hPa
|
To get a deeper insight into the Cold Air Development the conveyor belt theory will be used. The following points can be summarized:
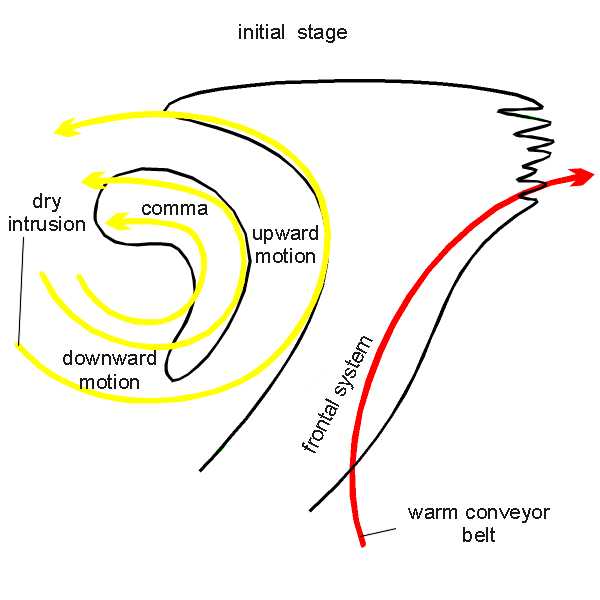
- In the initial stage, the Comma stage, a vortex structure can be identified within the huge area of the dry intrusion. This vortex shows strong rising in the area of the Comma cloudiness within the middle and upper troposphere as well as strong sinking behind. In most cases there are very unstable conditions in the low and middle troposphere below the Comma feature. Consequently both the convection and the rising relative streams contribute to the Comma cloudiness.
- As long as the prime frontal system is close to the Comma the typical frontal relative streams can be observed within the frontal cloud system.
|
- In the development stage of the Cold Air Development, which is mainly charcterized by a strengthening of the Baroclinic Boundary in the southern part, the vortex structure of the Comma head can still be identified. A relative stream from a northern to south-eastern direction (the dry intrusion) crosses the area of the low cloud top Baroclinic Boundary in a sinking manner. This is in accordance with the low cloud tops there, but contradicts the fact that at this stage of development an intensification of the cloudiness has already taken place. It might be possible that in the lowest layers frontal conditions in the relative streams exist as well, but this is difficult to compute.
|
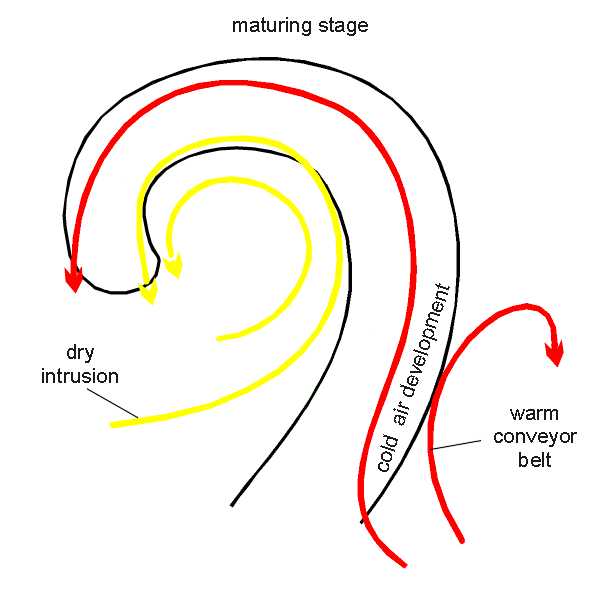
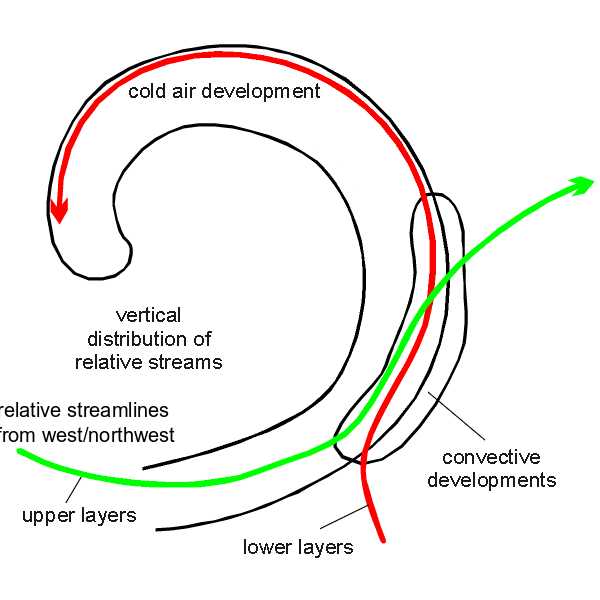
- In the mature stage the vortex pattern still exists but a warm conveyor belt, or at least a Warm Conveyor Belt - like relative stream, develops within the increased Baroclinic Boundary. Within this area front or front-like conditions of the relative streams support the Cold Air Development.
- One main difference to classical frontal conditions can be found in the orientation of the stream lines of the warm conveyor celt which turn into the direction of the Comma head instead of indicating the Warm Front. This can be regarded as a sign that no Warm Front development has taken place or is going on, which is a main difference between the classical polar front developments and Cold Air Developments (see Warm Front Band , Warm Front Shield and Detached Warm Front ).
- At this stage a situation often develops in the area of the Cold Air Development of the rising warm conveyor belt in the leading part of the Baroclinic Boundary, which is overrun by a relative stream from behind (probably the dry intrusion). Consequently a typical vertical stratification of different air masses develops, leading to conditional unstable conditions and convective developments (see Cloud structure in satellite image and Weather events ).
|
|
|
17 January 1997/00.00 UTC - Meteosat IR image; position of vertical cross sections indicated
|
17 January 1997/00.00 UTC - Vertical cross section R; black: isentropes (ThetaE), orange thin: IR pixel values, orange thick: WV pixel values
|
|
|
|
|
|
17 January 1997/00.00 UTC - Vertical cross section S; black: isentropes (ThetaE), orange thin: IR pixel values, orange thick: WV pixel values
|
The cross section R crosses the Comma head. The IR and WV lines in the cross section show highest values between approximately 45N/27W to 47N/24W. There is an unstable layer from the surface up to approximately 650 hPa below the Comma.
The cross section S crosses the Baroclinic Boundary, at about 41N/26W, consisting of low cloud top cells which show up in the sequence of small peaks in the IR pixel line. The unstable layer can also be identified in this area.
|
17 January 1997/00.00 UTC - Meteosat IR image; magenta: relative streams 294K - system velocity: 230° 11 m/s, yellow: isobars 294K
|
17 January 1997/00.00 UTC - Meteosat IR image; magenta: relative streams 300K - system velocity: 230° 11 m/s, yellow: isobars 300K
|
|
|
This isentropic surface of 294K is characteristic of the Comma part and shows the cyclonic circulation in the relative streams with intensive rising in the comma cloudiness. This is the typical situation for a Comma with an unstable layer up to 650 hPa and rising motion from above approximately 700 hPa.
The 300K isentropic surface is more relevant for the Baroclinic Boundary. The biggest part of the Comma vortex is now higher than 400 hPa, but relative streams in the south of the spiral cross the Baroclinic Boundary mostly in a sinking manner. This is the area with low cloud tops which is accompanied by an unstable layer within the low troposphere, but in contrast to the Comma cloudiness the relative streams have descending components.
|
17 January 1997/06.00 UTC - Meteosat IR image; position of vertical cross sections indicated
|
17 January 1997/06.00 UTC - Vertical cross section R; black: isentropes (ThetaE), orange thin: IR pixel values, orange thick: WV pixel values
|
|
|
|
|
|
17 January 1997/06.00 UTC - Vertical cross section S; black: isentropes (ThetaE), orange thin: IR pixel values, orange thick: WV pixel values
|
The cross section R crosses the Comma head between approximately 48N/24W and 50N/24W.
The cross section S crosses the Baroclinic Boundary between approximately 42N/24W and 41N/22W. Both cross sections contain an unstable layer up to about 650 hPa. The isentropic surfaces of 298K and 306K represent both cloud configurations.
|
17 January 1997/06.00 UTC - Meteosat IR image; magenta: relative streams 298K - system velocity: 255° 18 m/s, yellow: isobars 298K
|
17 January 1997/06.00 UTC - Meteosat IR image; magenta: relative streams 306K - system velocity: 255° 18 m/s, yellow: isobars 306K
|
|
|
For 06.00 UTC the Cold Air Development is already extensive and the cloudiness in the Baroclinic Boundary has increased.
On the isentropic surface of 298K a warm conveyor belt-like relative stream can be seen in the Baroclinic Boundary rising from 700 hPa up to 400 hPa, a limiting stream line to a relative stream with northern directions accompanies the rearward edge of the Baroclinic Boundary.
On the isentropic surface of 306K a relative stream from behind crosses the Baroclinic Boundary area without any important vertical motion. In this area air masses with different origins and qualities are on top of each other, which leads to convective activity and higher cloud tops there.
The case of 13 February 1997 shows similarities but also differences from the above described case.
|
13 February 1997/06.00 UTC - Vertical cross section; black: isentropes (ThetaE), orange thin: IR pixel values, orange thick: WV pixel values
|
13 February 1997/06.00 UTC - Meteosat IR image; magenta: relative streams 298K - system velocity: 244° 8 m/s, yellow: isobars 298K, position of vertical cross secton indicated
|
|
|
The isentropic surface which is used for the relative streams is 298K which represents the situation of the Cold Air Development.
The Comma stage at 06.00 UTC does not contain a closed cyclonic vortex within the relative streams, but only a trough. At this point of time the Baroclinic Boundary area over France is accompanied by sinking relative streams.
|
13 February 1997/18.00 UTC - Vertical cross section; black: isentropes (ThetaE), orange thin: IR pixel values, orange thick: WV pixel values
|
13 February 1997/18.00 UTC - Meteosat IR image; magenta: relative streams 300K - system velocity: 273° 12 m/s, yellow: isobars 300K, position of vertical cross secton indicated
|
|
|
|
|
|
13 February 1997/18.00 UTC - Meteosat IR image; magenta: relative streams 300K - system velocity: 273° 12 m/s, yellow: isobars 300K
|
At 18.00 UTC the Cold Air Development has already reached the mature stage.
The isentropic surfaces which are used for the relative streams are 300K, which represents the lower levels of the troposphere, and 302K which is characteristic for the upper levels.
On the 300K surface the typical situation of relative streams accompanying fronts has developed. The limiting stream line is in the centre of the cloud band.
On the higher, 302K, layer the whole cloud band is within a relative stream from behind, which again represents a conditional unstable situation. The result of this situation was the development of numerous thunderstorms, which is represented in the chapter of weather events.
Key Parameters
- Absolute topography at 500 and 1000 hPa:
The absolute topography shows in the inital stage two upper level troughs: a synoptic scale trough which can be found at the rear of the cloud band of a Cold Front, and a secondary weaker trough where Comma - like cloudiness develops. During the stages of development this trough becomes more and more pronounced. In the maturing stage of the Cold Air Development often a low can be found in the centre of the cloud spiral.
The surface trough is rather weak in the initial stage and can be found at the leading edge of the Baroclinic Boundary. During development the trough intensifies, depending on the strength of the development. - Thermal front parameter:
In some cases a thermal front parameter has developed which accompanies the head of the Comma. This branch of the front parameter is not the relevant feature in the Cold Air Development, but a branch of the thermal front parameter accompanying the intensifying Baroclinic Boundary. Very often a small indication of the thermal front parameter in this area can already be seen in the initial stage which then extends northward during the development. The existence of such a thermal front parameter in the initial stage confirms the existence of some baroclinicity, and its growth confirms the strengthening of this baroclinicity. - Equivalent thickness:
The equivalent thickness is characterized by a trough behind the cloud spiral indicating cold air.
The existence of a thermal front parameter, mentioned before, marks the biggest change of the thickness gradient, but isolines of thickness never show such pronounced gradients as observed with classical fronts. This is another indication that there is no big difference between the air masses in front of and behind the Cold Air Development (compare Meteorological physical background ). - Temperature advection:
The main feature in the field of temperature advection is the pronounced CA maximum behind the cloud structure. There is some variability from case to case:- In some cases the whole cloud system is within CA during the whole development.
- In some cases very weak warm advection can be observed in front of the cloud system. The latter gives some indications for a Cold Air Development going on.
- Vorticity advection at 500 hPa and 300 hPa:
The vorticity advection shows at 500 as well as at 300 hPa a strong pronounced PVA maximum. Both trough and jet contribute to PVA, but especially at 300 hPa the PVA maximum is connected to the left exit region of a jet streak. - Isotachs at 300 hPa:
Mostly the Comma tail is situated within the left exit region of a jet streak.
|
06 March 2009/00.00 UTC - Meteosat 9 IR10.8 image; magenta: height contours 1000 hPa
|
|
|
|
|
06 March 2009/12.00 UTC - Meteosat 9 IR10.8 image; magenta: height contours 1000 hPa
|
|
|
|
|
06 March 2009/00.00 UTC - Meteosat 9 IR10.8 image; green: height contours 500 hPa
|
|
|
|
|
06 March 2009/12.00 UTC - Meteosat 9 IR10.8 image; green: height contours 500 hPa
|
|

|
|
|
06 March 2009/00.00 UTC - Meteosat 9 IR10.8 image; blue: thermal front parameter 500/850 hPa, green: thickness 500/1000 hPa
|
|
|

|
|
06 March 2009/12.00 UTC - Meteosat 9 IR10.8 image; blue: thermal front parameter 850 hPa, green: thickness 500/1000 hPa
|
|
|
|
|
06 March 2009/00.00 UTC - Meteosat 9 IR10.8 image; red dashed: Cold Advection red straight Warrm Advection 500/1000 hPa
|
|

|
|
|
06 March 2009/12.00 UTC - Meteoasat 9 IR10.8 image; red dashed line: Cold Advection red line: Warrm Advection 500/1000 hPa
|
|
|
|
|
06 March 2009/00.00 UTC - Meteosat 9 IR10.8 image; yellow: isotachs 300 hPa; red : PVA 300 hPa; Black: Jet axis
|
|
|
|
|
06 March 2009/12.00 UTC - Meteosat 9 IR 10.8 image; Yellow: isotachs 300 hPa; red: PVA 300 hPa; Black: Jet axis
|
|
|
|
Typical Appearance In Vertical Cross Sections
In the area of the Baroclinic Boundary an intensification of humidity in the middle and upper levels should be noticed. In the mature stage the relative humidity has high values (about 60 to 80%) in front of and above the frontal zone. Low values of about 30% can be found behind and below the crowding zone of the Cold Air Development.
The field of temperature advection is characterized by CA within the area of Cold Air Development. If there is some WA in front of the Cold Air Development it can be found at middle and high levels. Within the upper most levels of the troposphere pronounced WA can be observed, which is related to the tropopause.
The whole area of Cold Air Development is characterized by PVA. As usual the values of the PVA generally are increasing with height (see Front Intensification By Jet Crossing and Comma ).
The fields of divergence and omega do not show any specific features: there is upward motion in connection with the cloud configuration mostly caused by increase of PVA with height. Circulation cells of divergence and omega, which are distinct features of fronts, cannot be found in the Cold Air Development.
The pixels of the IR, WV and VIS images show high values. In the cross section line across the Baroclinic Boundary they are somewhat lower in the initial stage and characterized by a lot of local peaks indicating the cellular structure of the cloud spiral (see Cloud structure in satellite image and Meteorological physical background ).
|
06 March 2009/00.00 UTC - Meteosat 8 Airmass RGB image; position of vertical cross section indicated
|
|
|
|
|
06 March 2009/00.00 UTC - Vertical cross section; black: isentropes (ThetaE)
|
|
|
|
|
06 March 2009/12.00 UTC - Meteosat IR image; position of vertical cross section indicated
|
|
 |
|
|
06 March 2009/12.00 UTC - Vertical cross section; black: isentropes (ThetaE)
|
|
|
|
|
06 March 2009/12.00 UTC - Vertical cross section; black: isentropes (ThetaE), red thick: WA, red thin: CA
|
|
|
|
|
06 March 2009/12.00 UTC - Vertical cross section; black: isentropes (ThetaE), green thick: PVA, green thin: NVA
|
|
|
|
Weather Events
| Parameter | Description |
| Precipitation |
|
| Temperature |
|
| Wind (incl. gusts) |
|
| Other relevant information |
|
The weather events are well illustrated using data from 28 January 2020 at 12 UTC, which is the time of the end stage of a CAD extending from the west of Ireland eastward to central Europe. This case is accompanied by strong weather activity, even Cbs but no differentiation between the former comma tail and comma head.
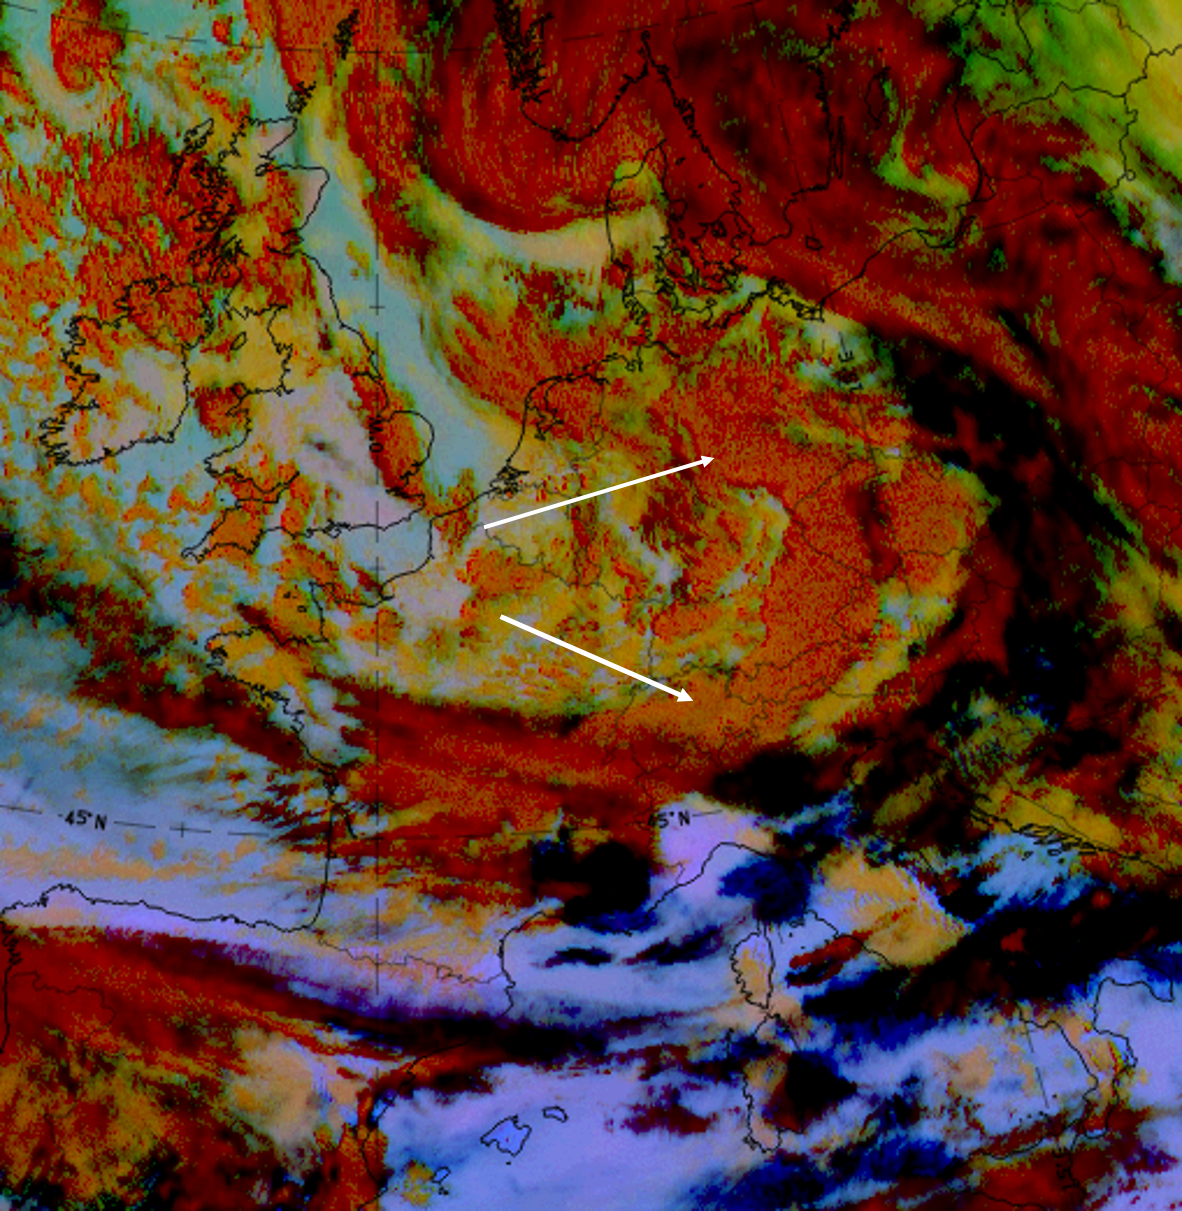
28 January, 12 UTC. Dust RGB; arrows indicate the cloudiness of the stage of the Cold Air development.
|
|
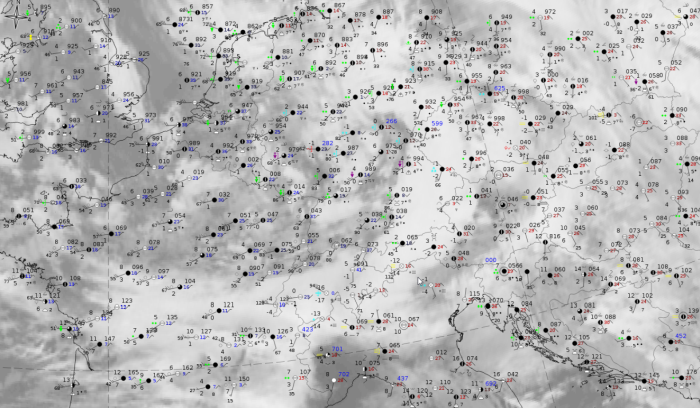
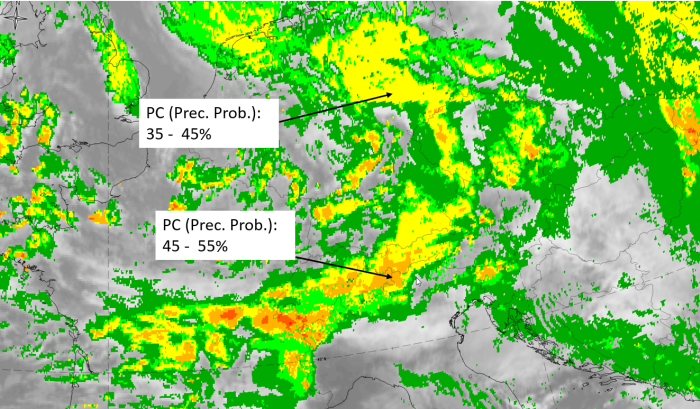
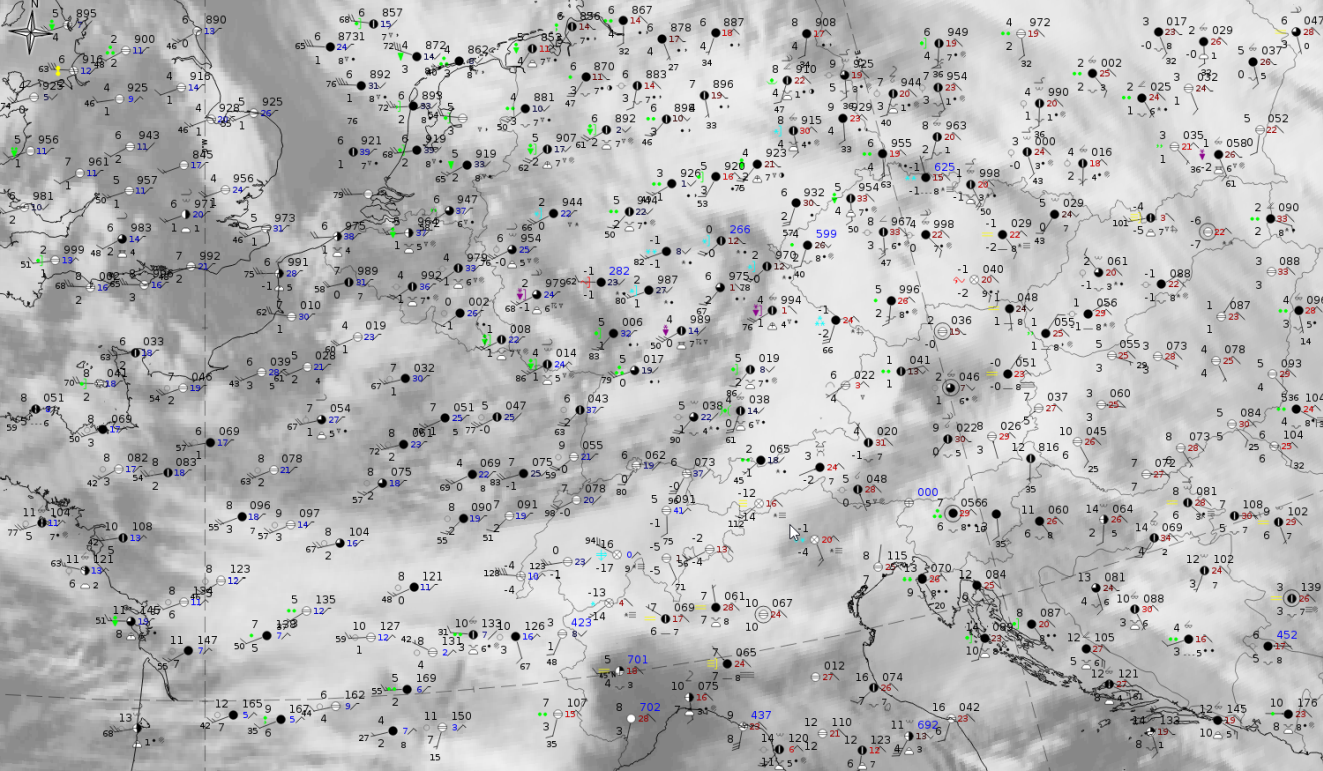
28 January 2019, 12UTC: IR + synoptic measurements (above) + probability of moderate rain (Precipitting clouds PC - NWCSAF).
Note: for a larger SYNOP image click this link.
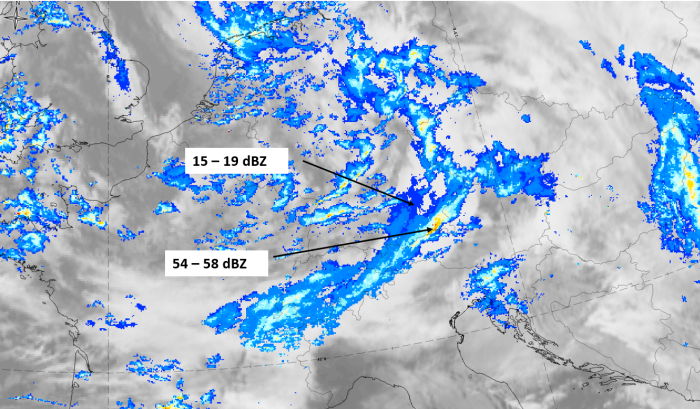
All available synoptic stations in the comma front, in a spiral southward to the Alps in Austria, show heavy rain and some also Cbs. Conversely, the precipitation probability of moderate rain (PC) seems to underestimate the real rain: the probability is between 35 and 55 %. Higher values appear along the windward side of the Alps. From an evaluation of this NWCSAF product it can be said that it generally displays such behaviour, that rain is usually observed alongside smaller probabilities.
|
|
|
|
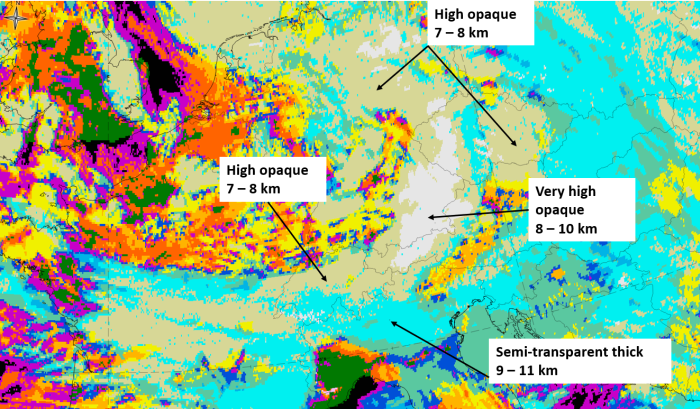
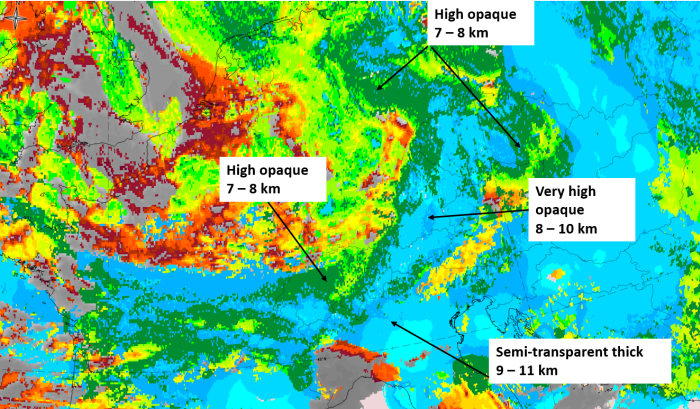
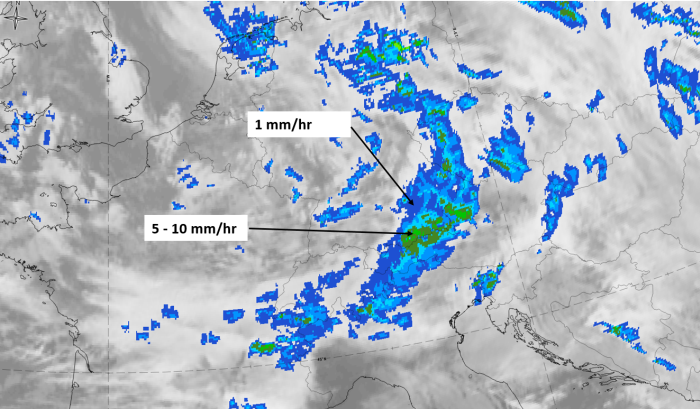
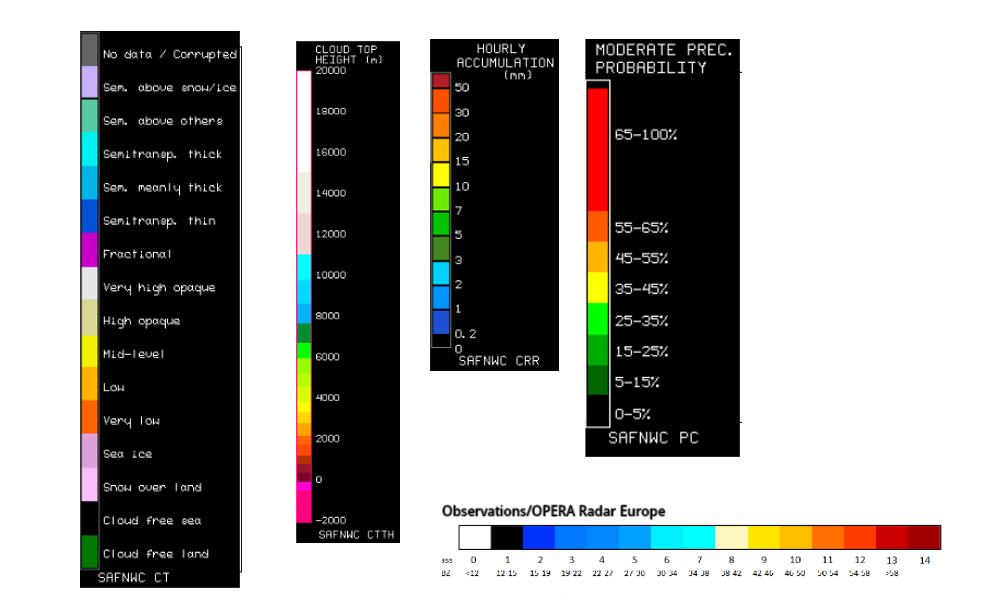
28 January 2020, 12 UTC, IR ; superimposed: 1st row: Cloud Type (CT NWCSAF) (above) + Cloud Top Height (CTTH - NWCSAF) (below); 2nd row: Convective Rainfall Rate (CRR NWCSAF) (above) + Radar intensities from Opera radar system (below)
For identifying values for Cloud type (CT), Cloud type height (CTTH), precipitating clouds (PC), and Opera radar for any pixel in the images look into the legends. (link)
References
General Meteorology and Basics
- BENNETTS D. A., GRANT J. R. and MCCALLUM E. (1988): An introductory review of fronts. Part I: Theory and observations; Met. Mag., Vol. 117, p. 357 - 370
- BENNETTS D. A., GRANT J. R. and MCCALLUM E. (1989): An introductory review of fronts. Part II: A case study; Met. Mag., Vol. 118, p. 8 - 12
- GREEN J. S. A., LUDLAM F. H. and MCILVEEN J. F. R. (1966): Isentropic relative - flow analysis and the parcel theory; Quart. J. R. Meteor. Soc., Vol. 92, p. 210 - 219
General Satellite Meteorology
- BADER M. J., FORBES G. S., GRANT J. R., LILLEY R. B. E. and WATERS A. J. (1995): Images in weather forecasting - A practical guide for interpreting satellite and radar imagery; Cambridge University Press
- EVANS M. S., KEYSER D., BOSART L. F. and LACKMANN G. M. (1994): A satellite derived classification scheme for rapid maritime cyclogenesis; Mon. Wea. Rev., Vol. 122, p. 1381 - 1416
Specific Satellite Meteorology
- FORBES G. S. and LOTTES W. D. (1985): Classification of mesoscale vortices in polar airstreams and the influence of the large-scale environment on their evolutions; Tellus, Vol. 37A, p. 132 - 155
- LOCATELLI J. D., HOBBS P. V. and WERTH J. A. (1982): Mesoscale structures of vortices in polar air streams; Mon. Wea. Rev., Vol. 110, p. 1417 - 1433
- MULLEN S. L. (1979): An investigation of small synoptic-scale cyclones in polar airstreams; Mon. Wea. Rev., Vol. 197, p. 1636 - 1647
- MULLEN S. L. (1982): Cyclone development in polar air streams over the wintertime continent; Mon. Wea. Rev., Vol. 110, p. 1664 - 1676
- MULLEN S. L. (1983): Explosive cyclogenesis associated with cyclones in polar air streams; Mon. Wea. Rev., Vol. 111, p. 1537 - 1552
- REED R. J. (1979): Cyclogenesis in polar air streams; Mon. Wea. Rev., Vol. 107, p. 38 - 52
- REED R. J. and BLIER W. (1986): A case study of comma cloud development in the Eastern Pacific; Mon. Wea. Rev., Vol. 114, p. 1681 - 1695
- REED R. J. (1990): Advances in knowledge and understanding of extratropical cyclones during the past quarter century: an overview; in: Extratropical Cyclones, The Erik Palmen Memorial Volume, Ed. Chester Newton and Eero O Holopainen
- THEPENIER R.-M. and CRUETTE D. (1981): Formation of cloud bands associated with the American subtropical jet stream and their interaction with mid-latitude synoptic distrubances reaching Europe; Mon. Wea. Rev., Vol. 109, p. 2209 - 2220