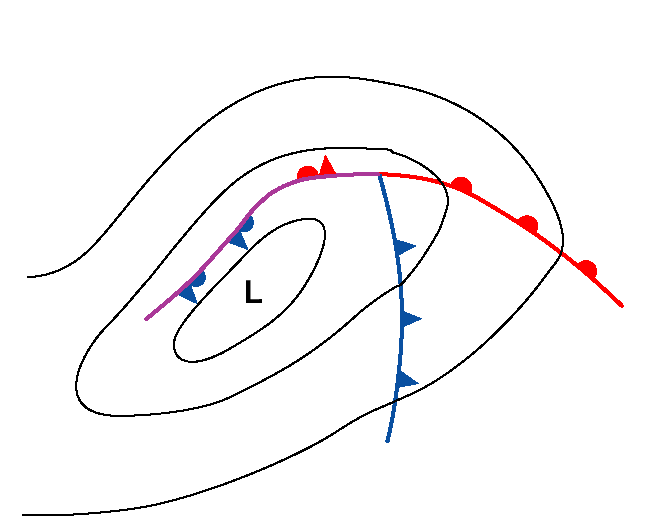
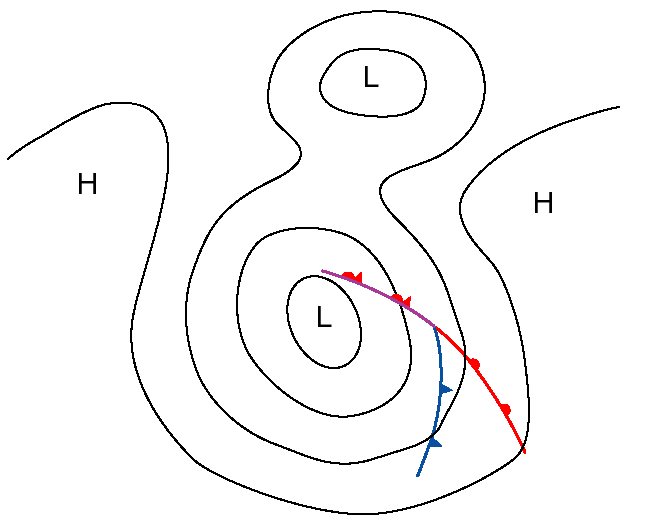
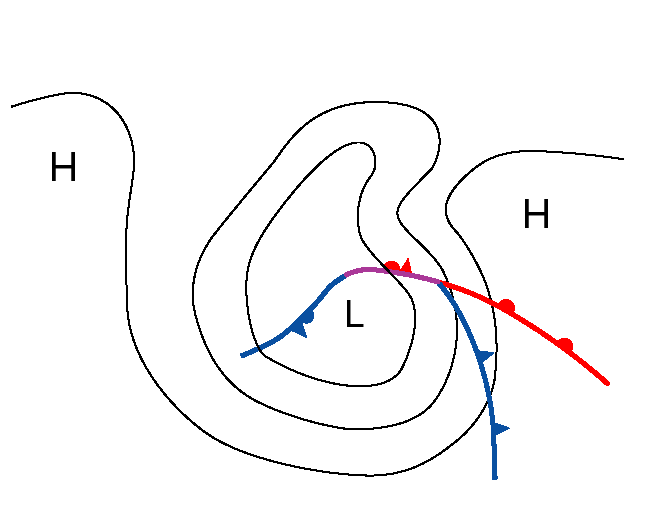
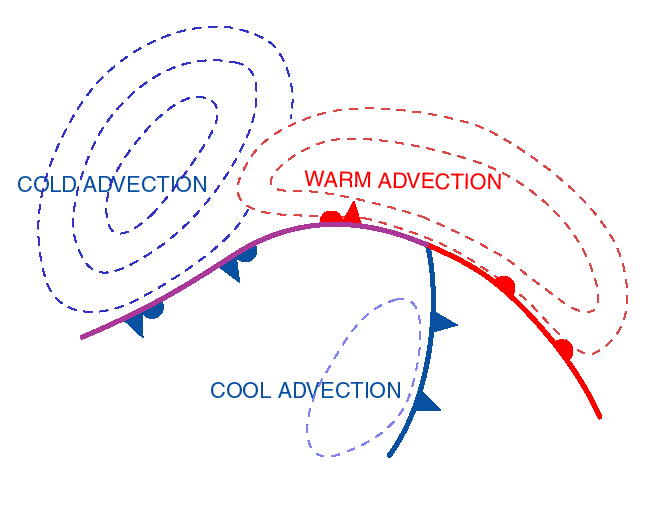
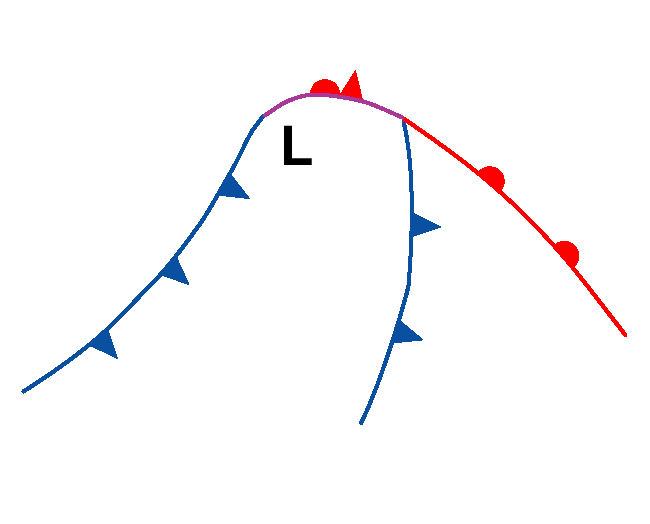
Key Parameters
- Height contours at 1000 hPa:
The surface pressure gradient is relatively weak near the centre of the low, and often elongated in the direction of the occluded front. - Height contours at 500 hPa:
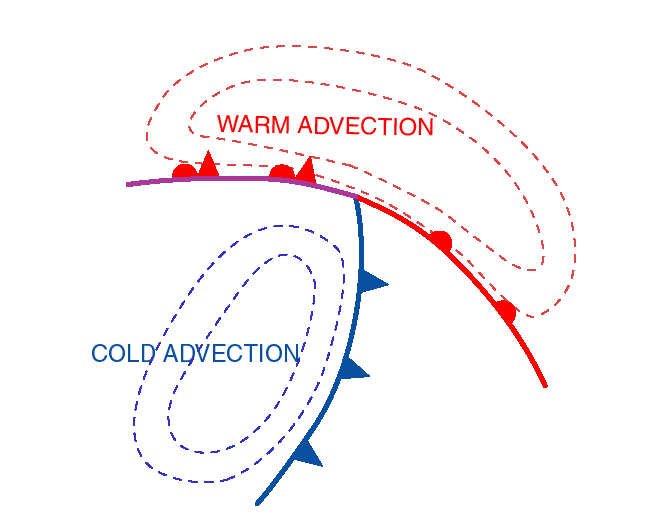
In case of bending back of an Occlusion by a cold advection there is usually a low on upper levels in the cold airmass ahead of the Occlusion. In the case of a stationary high there is a pronounced large high pressure ahead of the Occlusion. - Temperature advection at 700 hPa:
In the initial stage there is warm advection ahead of the occluded front. When the front bends back, it turns into a Cold Front and there is cold advection behind it. If the cyclone is in very cold airmass, the temperature advections are even clearer at 850 hPa.
A Back Bent Occlusion can also be neutral if it is formed by a relatively warm stationary high, but this type is very rare. - Vorticity advection at 500 hPa and 300 hPa:
The field of vorticity advection shows at 300 as well as at 500 hPa a pronounced PVA maximum in connection with the Comma, but overrides the frontal cloud band during the merging process. The PVA maximum mostly is situated within the area of the Comma tail, which typically can be found within the left exit region of a jet streak. - Thermal Front Parameter:
The bending back of an occluded front can be seen from the curvature of TFP field around the Occlusion.
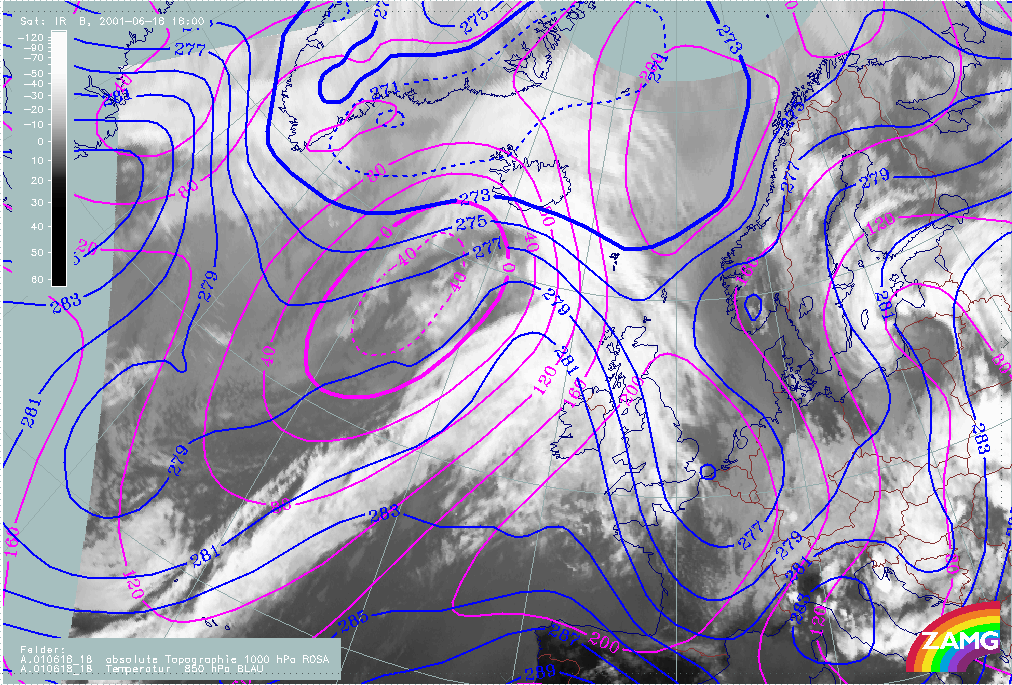
Height contours at 1000 hPa
|
18 June 2001/18.00 UTC - Meteosat IR image; magenta: height contours 1000 hPa, blue: temperature 850 hPa
|
|
|
|
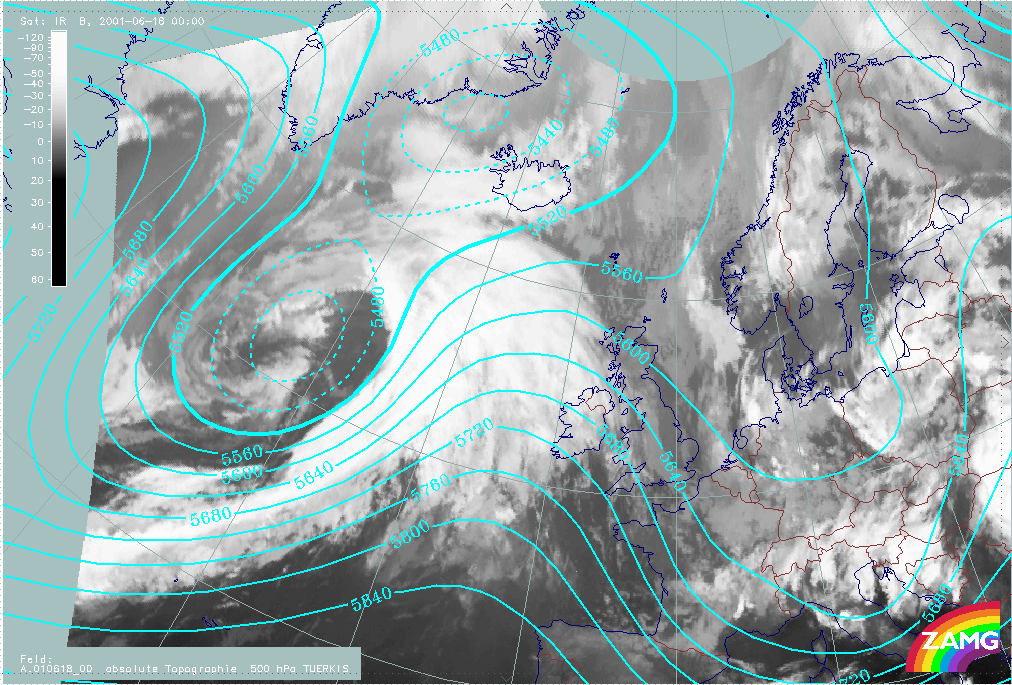
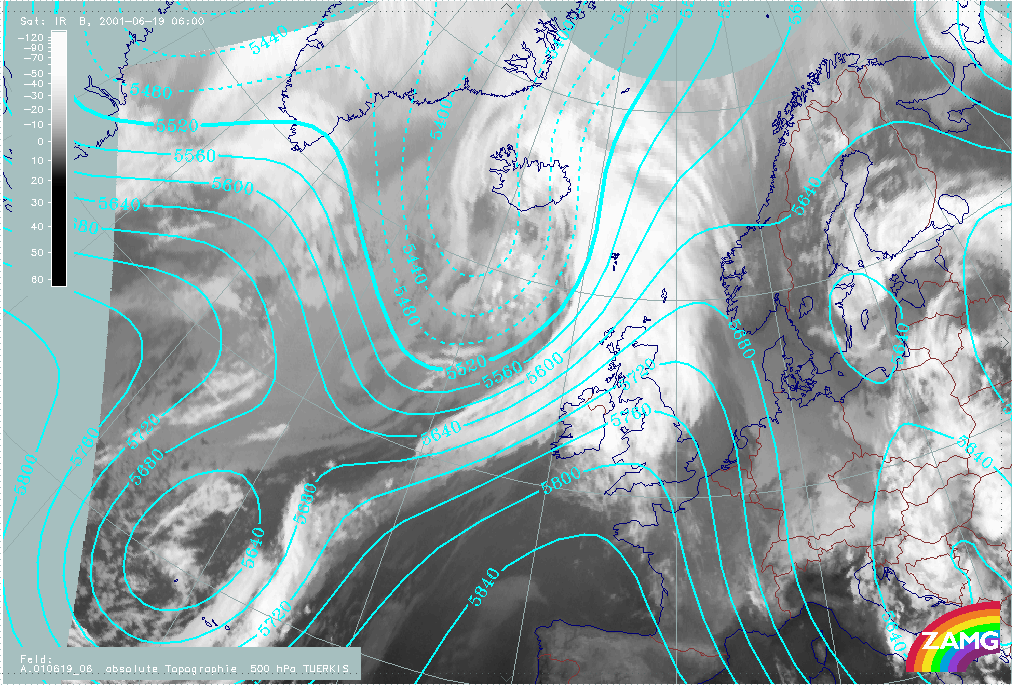
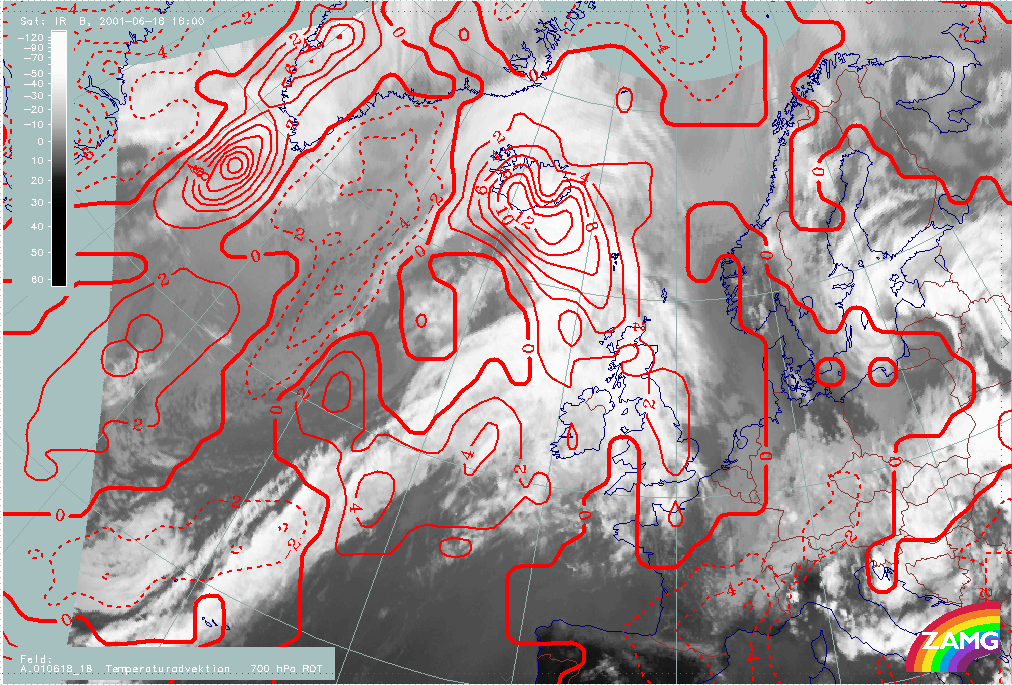
Height contours at 500 hPa
|
18 June 2001/00.00 UTC - Meteosat IR image; cyan: height contours 500 hPa
|
|
|
|
The lows are merging and the occluded front becomes a Cold Front; black: absolute topography 500 hPa.
|
18 June 2001/06.00 UTC - Meteosat IR image; cyan: height contours 500 hPa
|
|
|
|
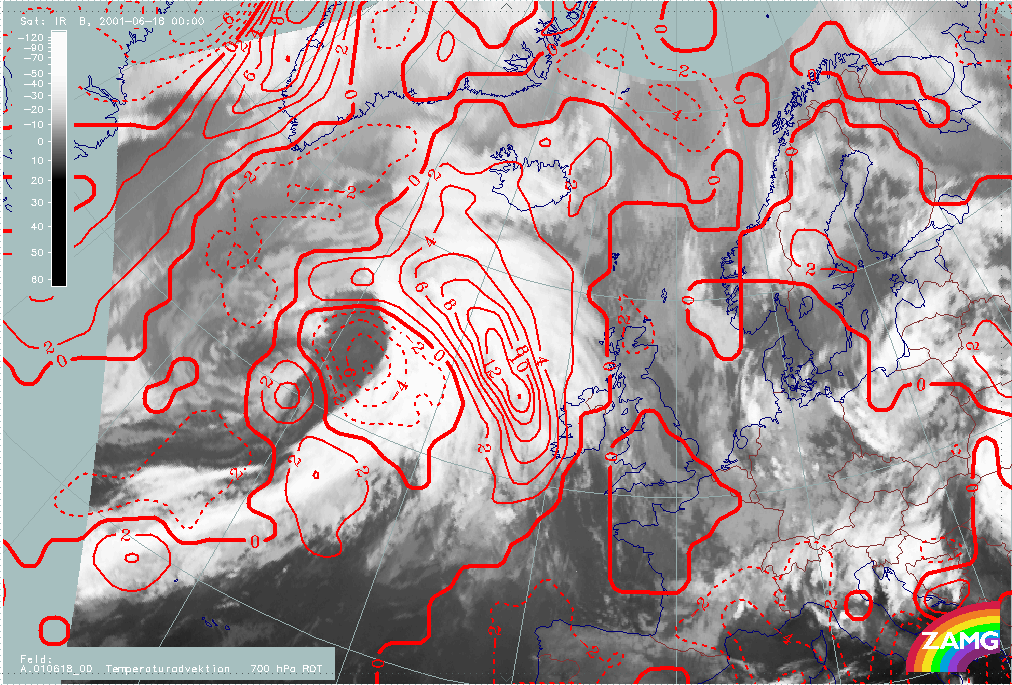
Temperature advection at 700 hPa
|
18 June 2001/00.00 UTC - Meteosat IR image; red: temperature advection 700 hPa
|
|
 |
|
Temperature advections in a Back Bent Occlusion that turns into a Cold Occlusion:
|
18 June 2001/18.00 UTC - Meteosat IR image; red: temperature advection 700 hPa
|
|
|
|
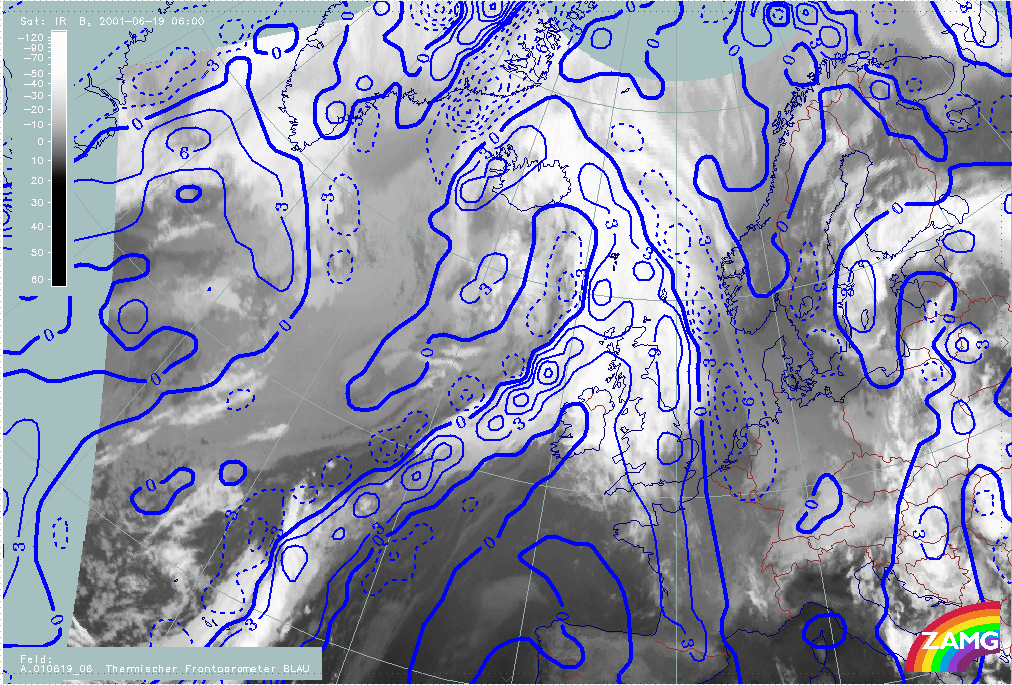
Thermal frontal parameter
Surface fronts in the final stage:
|
18 June 2001/18.00 UTC - Meteosat IR image; blue: thermal front parameter
|
|
|
|