Chapter IV: The effect of viewing geometry
Table of Contents
- Chapter IV: The effect of viewing geometry
- The effect of viewing geometry
The effect of viewing geometry
We aim to analyse the temporal change in snow characteristics in the available VIIRS Cloud Phase RGB images (and their components) between 11 and 19 January 2021 over Spain. This amounts to 1-2 images per day. The melting of snow (shrinkage of the blue area) is clearly observable in the valleys. It is noteworthy that the colour shade of the snowy area fluctuated between light and dark blue in the Iberian Mountain Chain area, where the snow melted only after this period. What is the reason for this variation?
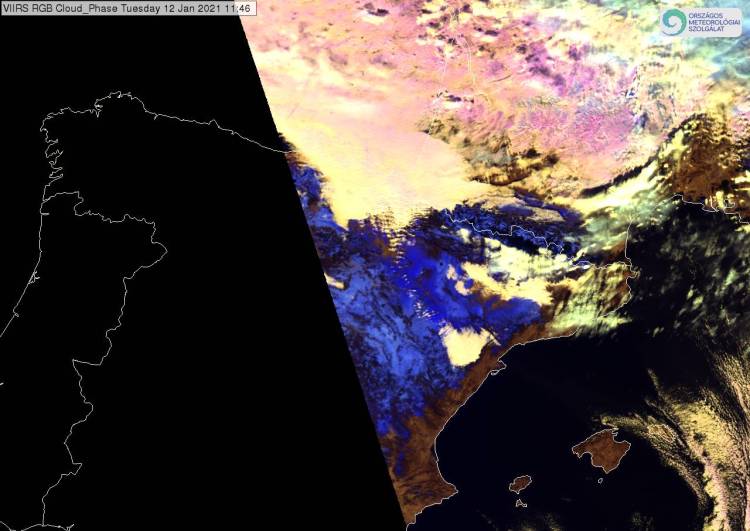
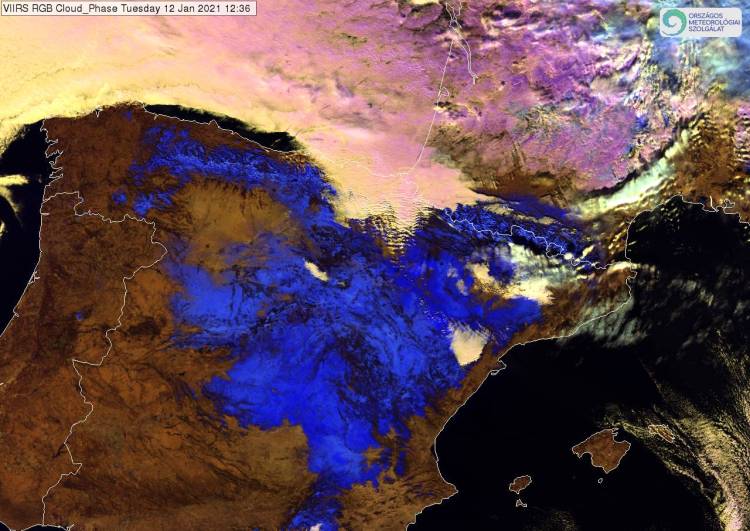
The shade of the blue colour in Cloud Phase RGB images primarily refers to the snow characteristics, but it also depends on the satellite zenith angle. This can clearly be seen by comparing the two images taken on 12 January 2021 at 11:46 and 12:36 UTC (Figure 9).
|
|
Figure 9: VIIRS Cloud Phase RGB images taken on 12 January 2021 by NOAA-20 at 11:46 UTC and by NPP at 12:36 UTC, on top of each other. Satellite zenith angles over the Iberian Mountain Chain were: ~68° and 33°, respectively. Hover your mouse over the image to use the slider.
Because of the short time difference between the two overpasses and because the temperature was far below 0°C in the Iberian Mountain Chain, one can assume that the snow quality here remained almost unchanged. However, the blue shade of the snowy area and the reflectivity values were different. The reason is likely the difference between the satellite zenith angles.
Especially for the NIR1.61 and NIR2.25 channels, the reflectivity values increase for larger satellite zenith angles (Figure 10). In the image taken at 11:46 UTC, the reflectivity values were around 16% and 23% in the NIR1.61 and NIR2.25 channels, respectively, at the location indicated by the arrow. In that case the satellite zenith angle was ~68° in the Iberian Mountain Chain. On the same day, in the image taken at 12:36 UTC, the reflectivity values were around 8% and 13% in the near-infrared channels and the satellite zenith angle was ~33°.
Figure 10: VIIRS Cloud Phase RGB images taken on 12 January 2021 at 11:46 UTC (left) and 12:36 UTC (right). The NIR1.61, NIR2.25 and VIS0.67 reflectivity values in the area indicated by the arrows are shown in the top left corners of the panels. Satellite zenith angles in the Iberian Mountain Chain were ~68° and ~33°, respectively.


