Chapter III: METOP AVHRR Day Microphysics RGB
Table of Contents
- Chapter III: METOP AVHRR Day Microphysics RGB
- Aim
- Physical Basis
- How to create METOP AVHRR Day Microphysics RGB images
- Typical Colors
- Examples of Interpretation
- Benefits and limitations
- Comparison with SEVIRI Day Microphysics RGB images
- Exercises
METOP AVHRR Day Microphysics RGB
EUMETSAT's recommendation for Microphysics RGBs is that the red component should be used for information on cloud thickness, the green one for microphysical information, and the blue one for temperature.
The METOP AVHRR instrument only uses one microphysical channel during daytime (NIR1.61), which means it can only be used to create Day Microphysics RGBs.
The Meteosat SEVIRI instrument uses two channels that provide microphysical information during daytime: NIR1.6 and IR3.9. The SEVIRI standard Day Microphysics RGB uses IR3.9 channel data since it is more sensitive to cloud top particle size than NIR1.6 data.
METOP AVHRR Day Microphysics RGB images are created by combining data from three different channels. The 0.87 micrometer channel (NIR0.87) is visualized in red, the 1.61 micrometer channel (NIR1.61) in green and the 10.8 micrometer channel (IR10.8) in blue. It is a daytime RGB since it uses shortwave channels.
Aim
The aim of this RGB type is to provide general cloud analysis with good color contrast between different cloud types and between clouds and the surface. It contains information on cloud thickness, cloud top phase, particle size and cloud top temperature.
Physical Basis
Distinguishing clouds according to their optical thickness and cloud top temperature
In cloudy areas the NIR0.87 channel values depend mainly on cloud thickness. NIR0.87 reflectivity values are high for opaque and lower for semi-transparent clouds.
The IR10.8 channel distinguishes thick clouds by their cloud top temperatures. IR10.8 is an atmospheric window channel (where the absorption of gas molecules is low). For opaque clouds the measured signal depends mainly on cloud top temperature. For semi-transparent clouds the interpretation of the measured radiation is more complicated: besides the cloud's temperature, it also depends on its transparency and the temperature of the underlying surface.
Distinguishing ice and water clouds and clouds with small and large cloud top particles
NIR1.61 channel data contains information on cloud top microphysics: the phase and the effective particle size of the cloud top elements. (Effective particle size is the size of an 'averaged' particle, calculated by dividing total particle volume by total particle surface area.)
The NIR1.61 channel helps to distinguish water clouds from ice clouds. Ice crystals absorb radiation more strongly than water particles in the NIR1.6 channel. Fig. 1 presents the imaginary refraction index of water and ice. This index characterizes the absorption of the material, not the absorption of a cloud layer. A cloud layer's absorption also depends on many other things (like the number of droplets/particles etc.), but the absorption coefficient of the material has a dominant role. Due to ice's higher absorption in the NIR1.61 channel their reflection is lower than that of water clouds. (Note that the difference in absorption between ice and water is not small: it is shown on a logarithmic scale.) For the NIR0.87 channel the index is much lower and about the same for ice and water particles.

Figure 1: Absorption spectra of water (blue curve) and ice (red curve)
Fig. 2a shows 1.6 micrometer simulated thick cloud reflectivity as a function of effective cloud particle size for water (red curve) and ice (blue curve) elements. The ellipses represent the typical range of water droplet and ice particle sizes.
The figure shows that
- water clouds usually have higher reflectivity than ice clouds
- the reflectivity also depends on effective particle size:
- Water clouds with small particles have higher reflectivity than water clouds with large particles.
- Ice clouds with small particles have higher reflectivity than ice clouds with large particles.
- Ice clouds with small ice crystals can have similar reflectivity as water clouds.
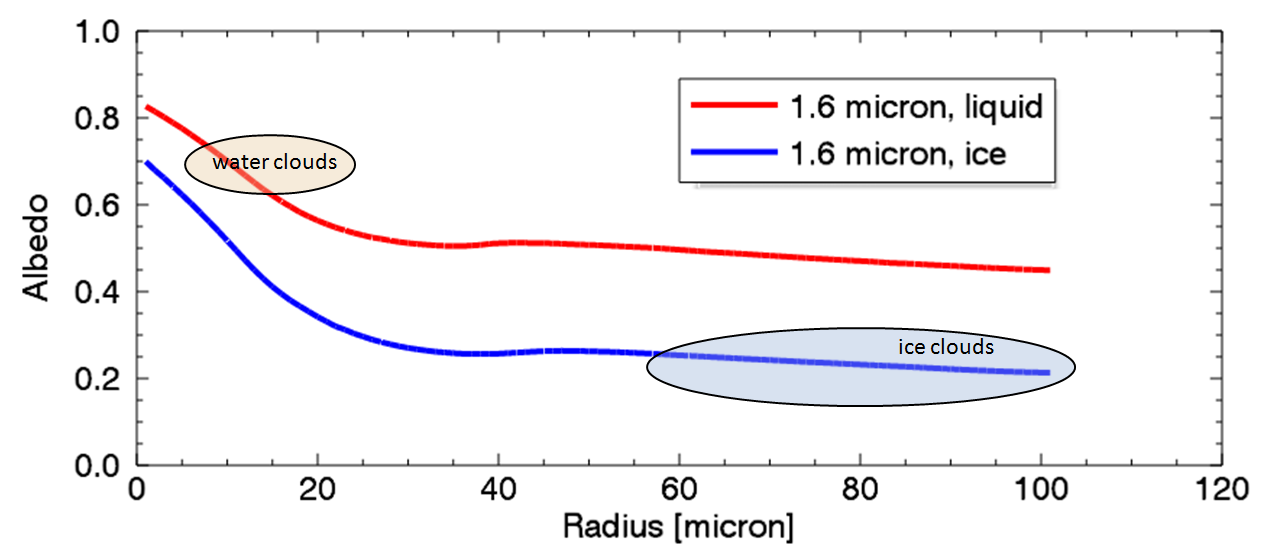
Figure 2a: 1.6 micrometer simulated thick cloud reflectivity as a function of effective cloud particle size for water (red curve) and ice (blue curve) elements. The ellipses represent the typical range of water droplet and ice particle sizes.
(Courtesy of Ralf Bennartz, University of Wisconsin)
Although the typical range of ice particle sizes is 'large', there are some special cases when small ice crystals are present at the cloud top.
- High-level lee clouds usually consist of very small ice crystals.
- Severe convective clouds with very strong updrafts often contain small ice crystals at their tops.
- Highly polluted ice clouds usually consist of small ice crystals because of the high number of condensation nuclei.
- Convective clouds with cold cloud bases have small ice crystals at the top.
Fig. 2b shows that ice clouds with small ice crystals can possess a reflectivity similar to water clouds. It shows a scatterplot of satellite-measured VIS0.6 and NIR1.6 reflectivity value pairs from water and ice clouds (indicated by orange and blue symbols). While the two groups are generally quite distinct, there is a region with overlap.
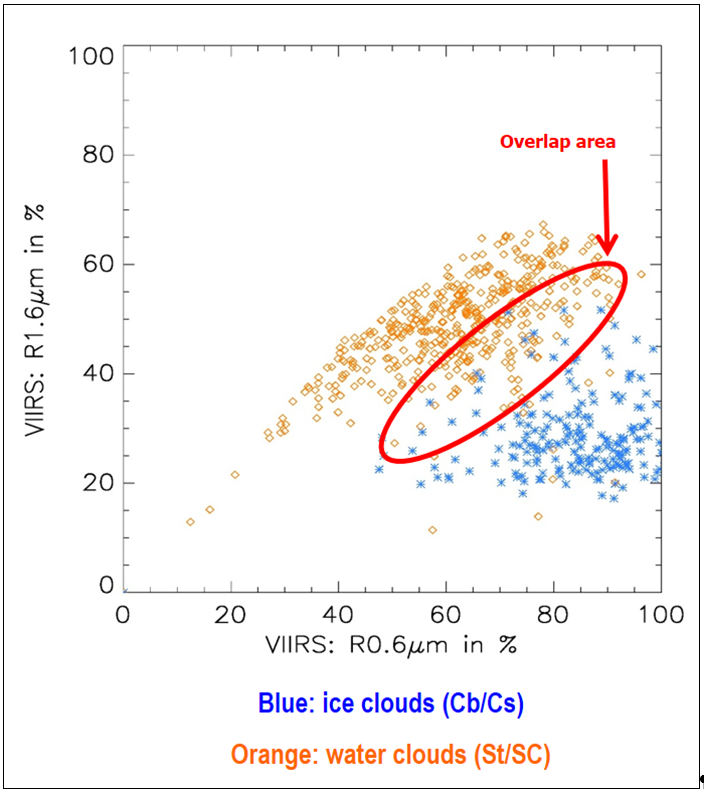
Figure 2b: Scatterplot of satellite-measured VIS0.6 and NIR1.6: reflectivity value pairs of water and ice clouds. (VIIRS: Visible Infrared Imaging Radiometer Suite) (Courtesy to HL and KG, Meteo-France)
Note that 1.6 micrometer reflectivity is less sensitive to effective particle size than 3.9 micrometer reflectivity, which is used in the SEVIRI Day Microphysics RGB. (For more on the topic, see the section 'Comparison with SEVIRI Day Microphysics RGB type'.)
Distinguishing snow and fog or water clouds
The NIR1.61 channel helps to discriminate between snow-covered land and fog or low water clouds. Fig. 3 presents the typical shortwave reflectivity spectra of some surface types including snow. The snow's reflectivity is much higher in NIR0.87 than NIR1.61 (see the brown vertical lines in Fig. 3). Because water clouds reflect much of the radiation in both channels (not shown in Fig. 3), they can be used in combination to distinguish snow and water clouds.

Figure 3: Typical shortwave reflectivity spectra of different surface types. The brown vertical lines show the reflectivity at 0.87 and 1.61 micrometers
(Courtesy of Steve Ackerman, CIMSS)
How to create METOP AVHRR Day Microphysics RGB images
EUMETSAT's recommendation for Microphysics RGBs is that cloud thickness information should be visualized in red, microphysical information in green, and temperature information in blue.
The 'recipe' of the Day Microphysics RGB is summarized in Table 1. The table shows which channels are visualized in which colors. The measured values should be calibrated to brightness temperature or reflectivity. (The reflectivity values should be normalized by the cosine of the solar zenith angle.) The images are then enhanced - linearly stretched - within the ranges listed in the table.
| AVHRR Day Microphysics RGB | ||||
|---|---|---|---|---|
| Color | Channel | Range | ||
| Red | NIR0.87 | 0 | 100 | % |
| Green | NIR1.61 | 0 | 70 | % |
| Blue | IR10.8 | 203 | 323 | K |
Table 1: Recipe of the AVHRR Day Microphysics RGB scheme
The following examples (Figs. 4-6) show how the Day Microphysics RGB is made by combining the NIR0.87, NIR1.61 and IR10.8 images. It shows both the resulting RGB as well as the components, which are enhanced according to Table 1. The IR10.8 image is bright for high and dark for low brightness temperatures.
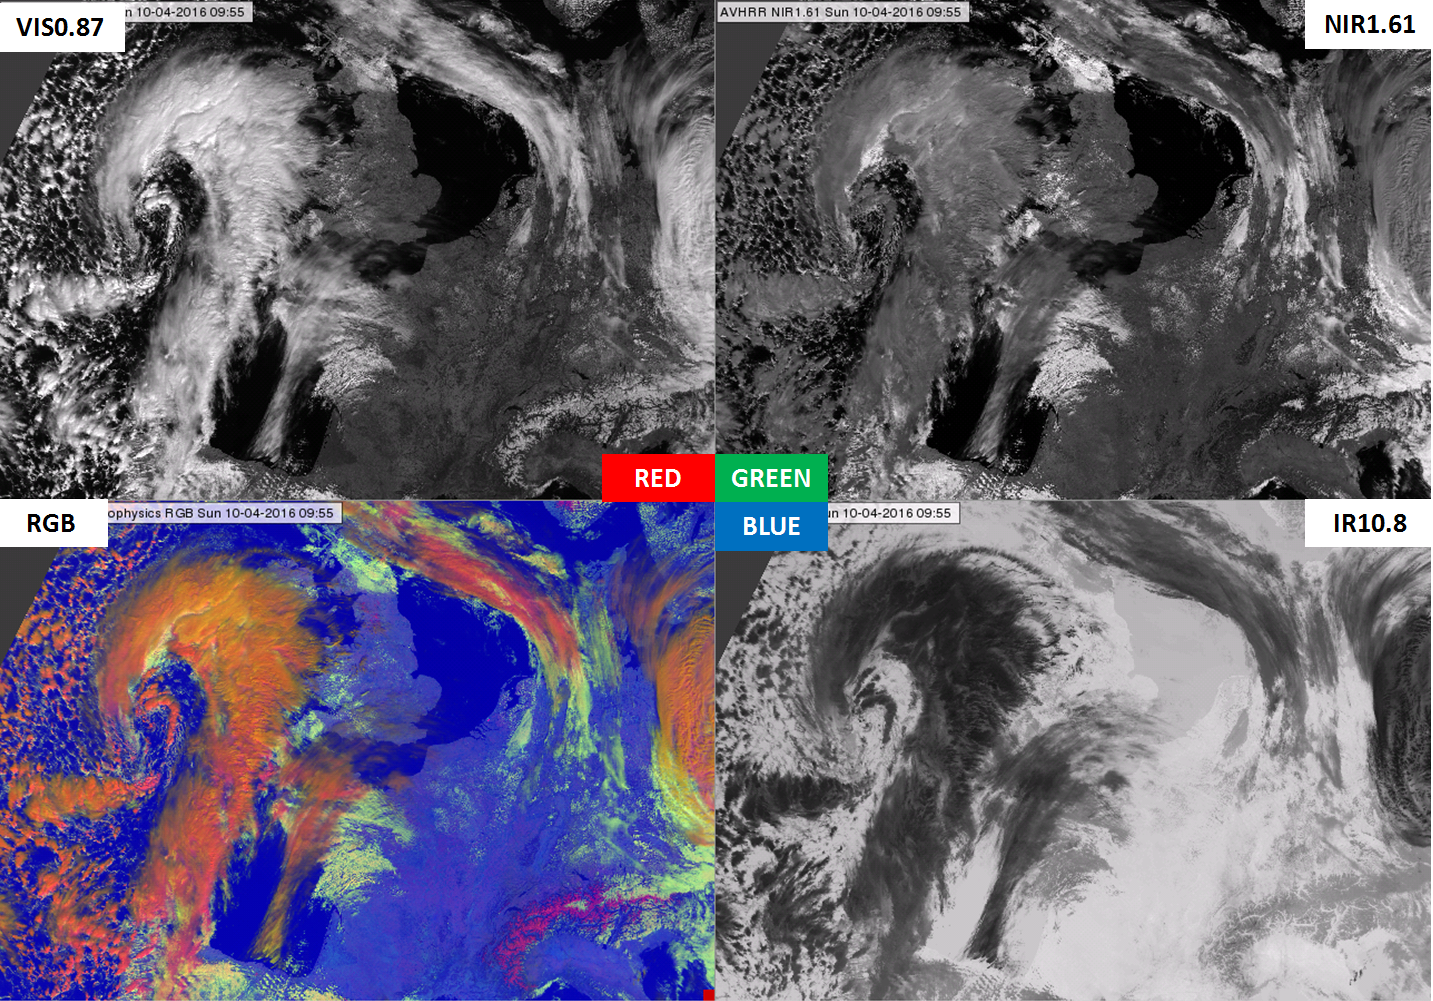
Figure 4a: METOP-A AVHRR NIR0.87 (upper left), NIR1.61 (upper right), Day Microphysics RGB (bottom left) and IR10.8 (bottom right) images of the coast of France and the UK on 10 April 2016 at 09:55 UTC
Fig. 4a shows the color components of a Day Microphysics RGB image: the channels which are in the recipe with the corresponding enhancement. The lower left panel shows the Day Microphysics RGB.
Fig. 4b is the same as Fig. 4a except that the three components are visualized with colors instead of grayscale, which is how the three components are used together in the RGB.
Fig. 4c shows the four panels of Fig. 4a on top of each other. Hover your mouse over the image to use the slider.
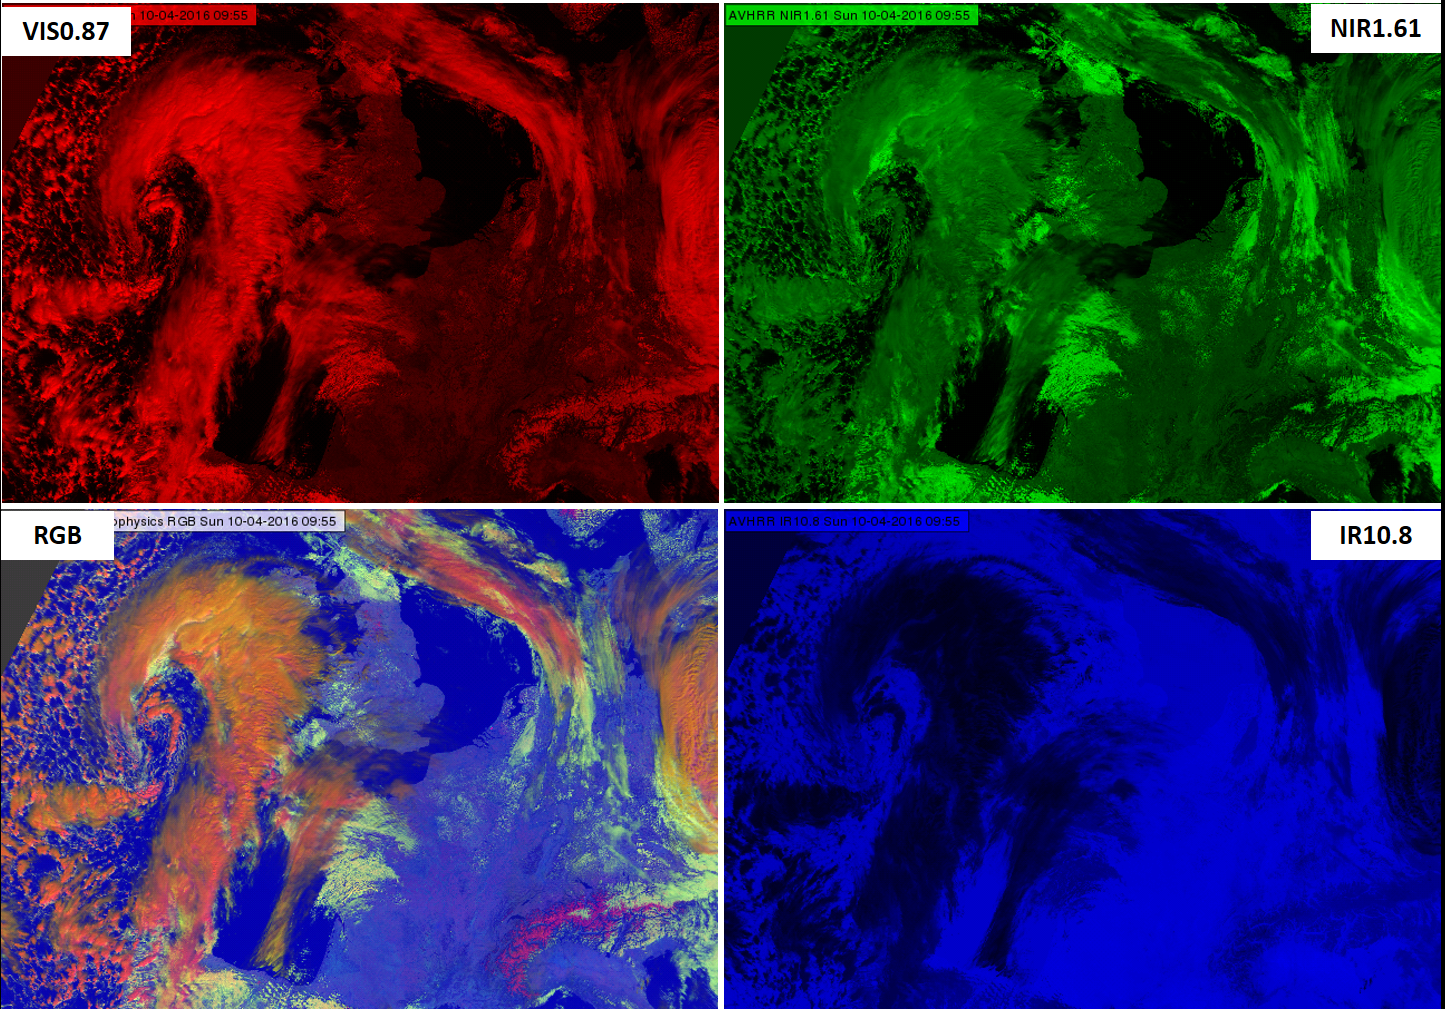
Figure 4b: METOP-A AVHRR NIR0.87 (upper left), NIR1.61 (upper right), Day Microphysics RGB (bottom left) and IR10.8 (bottom right) images of the coast of France and the UK on 10 April 2016 at 09:55 UTC
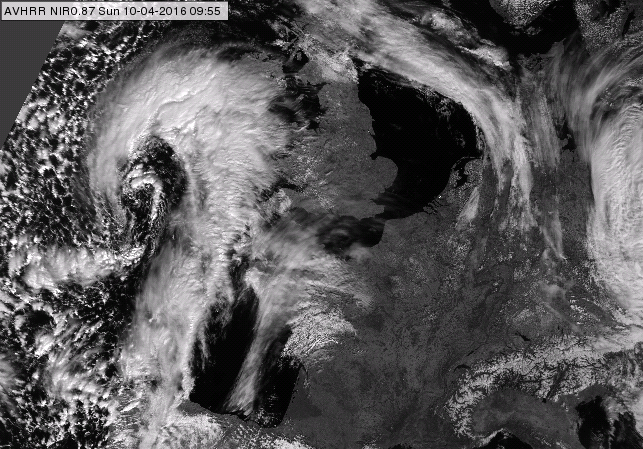
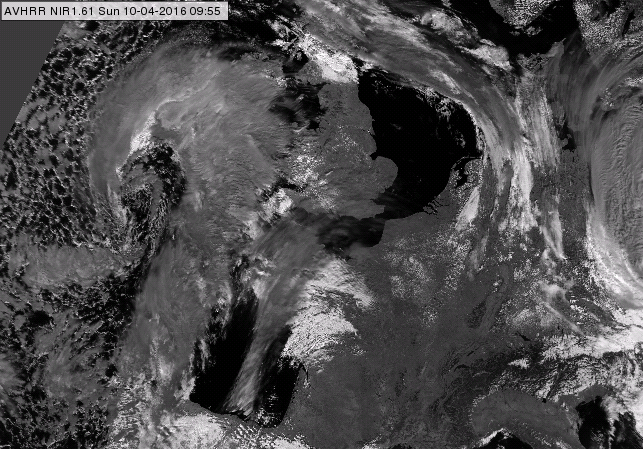
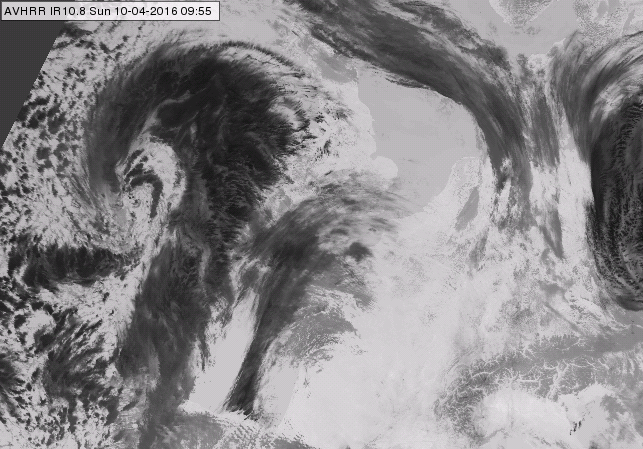
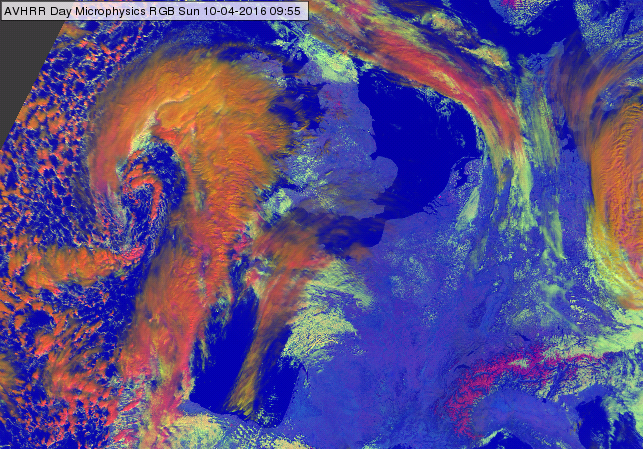
Figure 4c: 4-Panel display, please use your mouse to compare the four images. METOP-A AVHRR NIR0.87, NIR1.61, Day Microphysics RGB and IR10.8 images of the coast of France and the UK on 10 April 2016 at 09:55 UTC
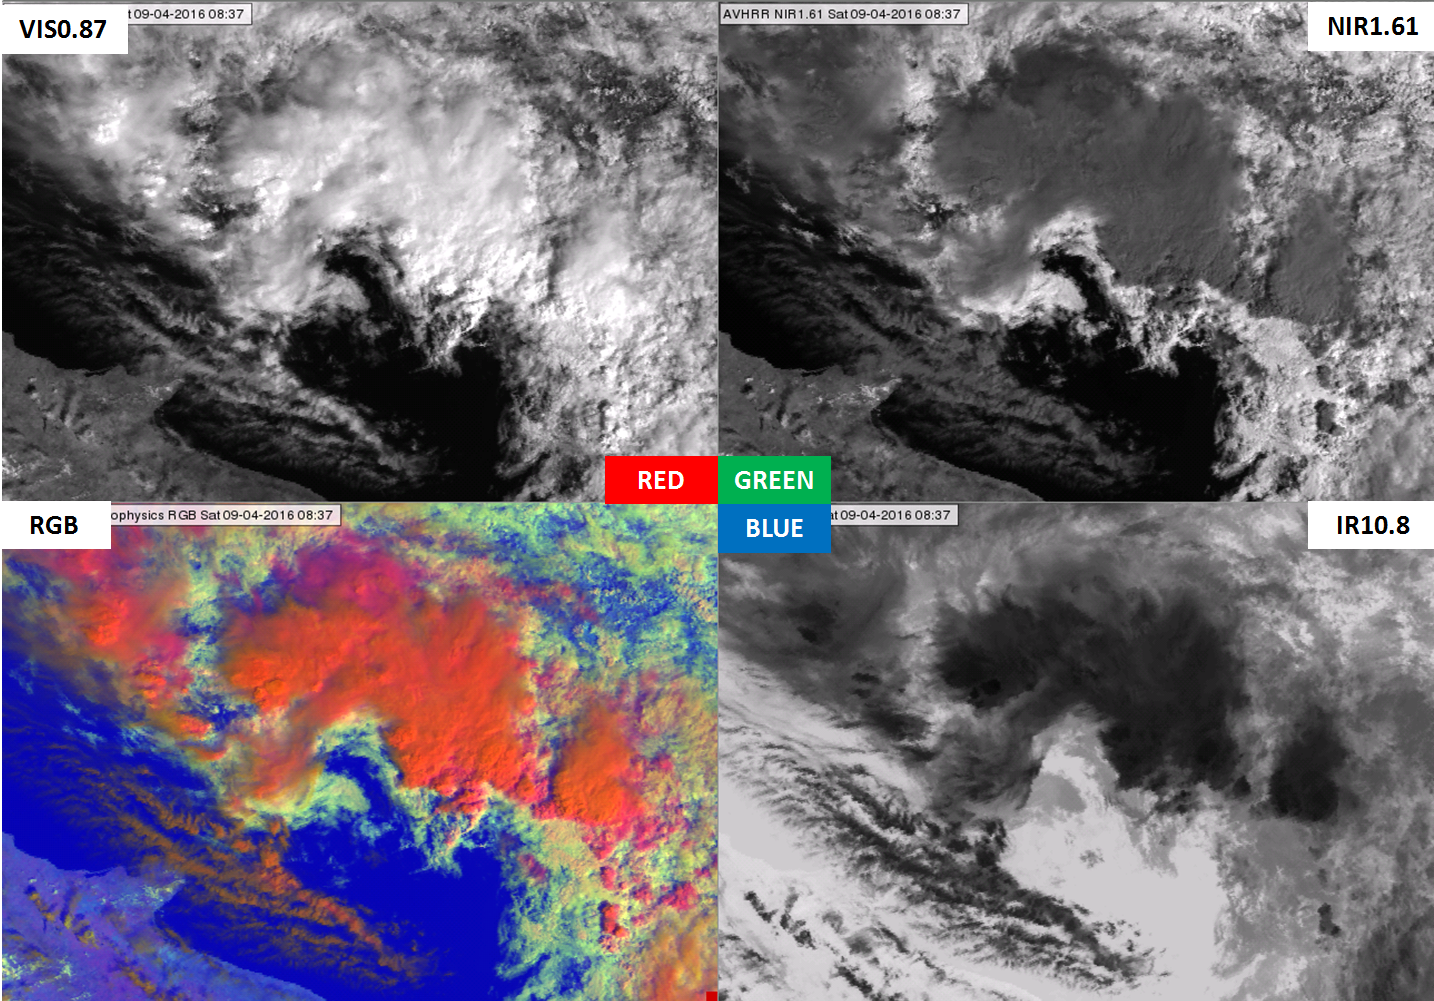
Figure 5a: METOP-A AVHRR NIR0.87 (upper left), NIR1.61 (upper right), Day Microphysics RGB (bottom left) and IR10.8 (bottom right) images of the Adriatic Sea region on 9 April 2016 at 08:37 UTC
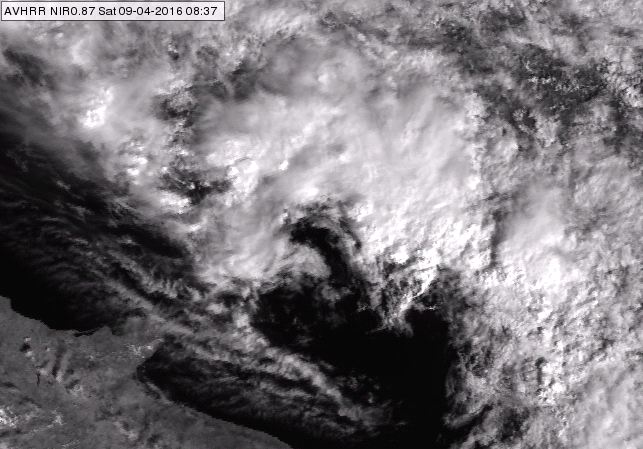
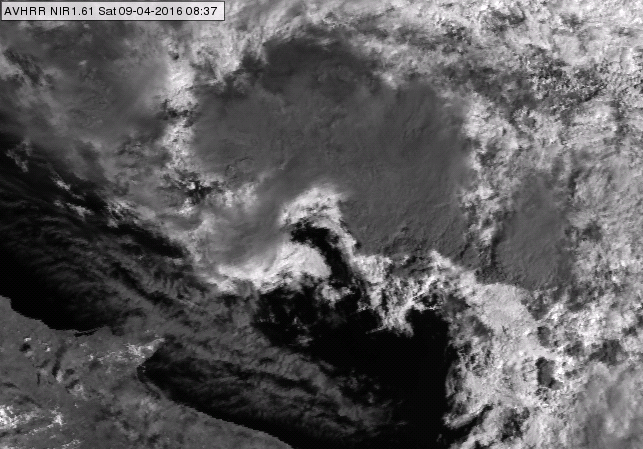
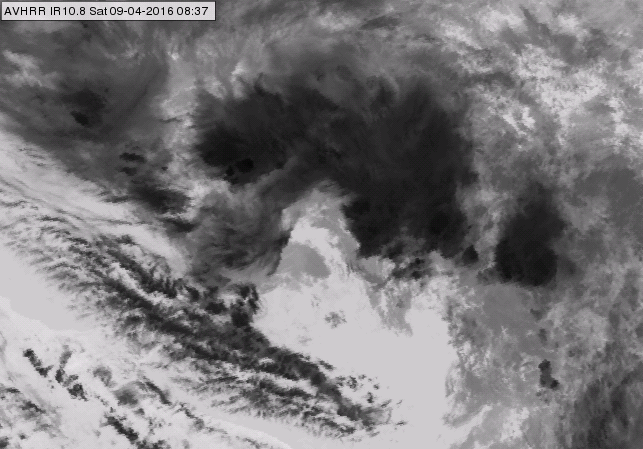
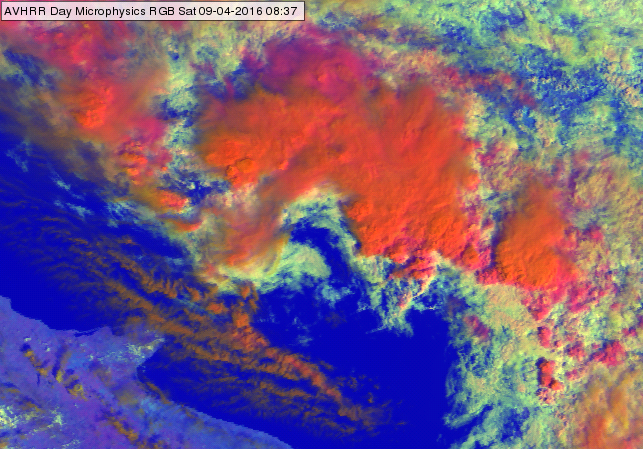
Figure 5b: 4-Panel display, please use your mouse to compare the four images. METOP-A AVHRR NIR0.87, NIR1.61, Day Microphysics RGB and IR10.8 images of the Adriatic Sea region on 9 April 2016 at 08:37 UTC
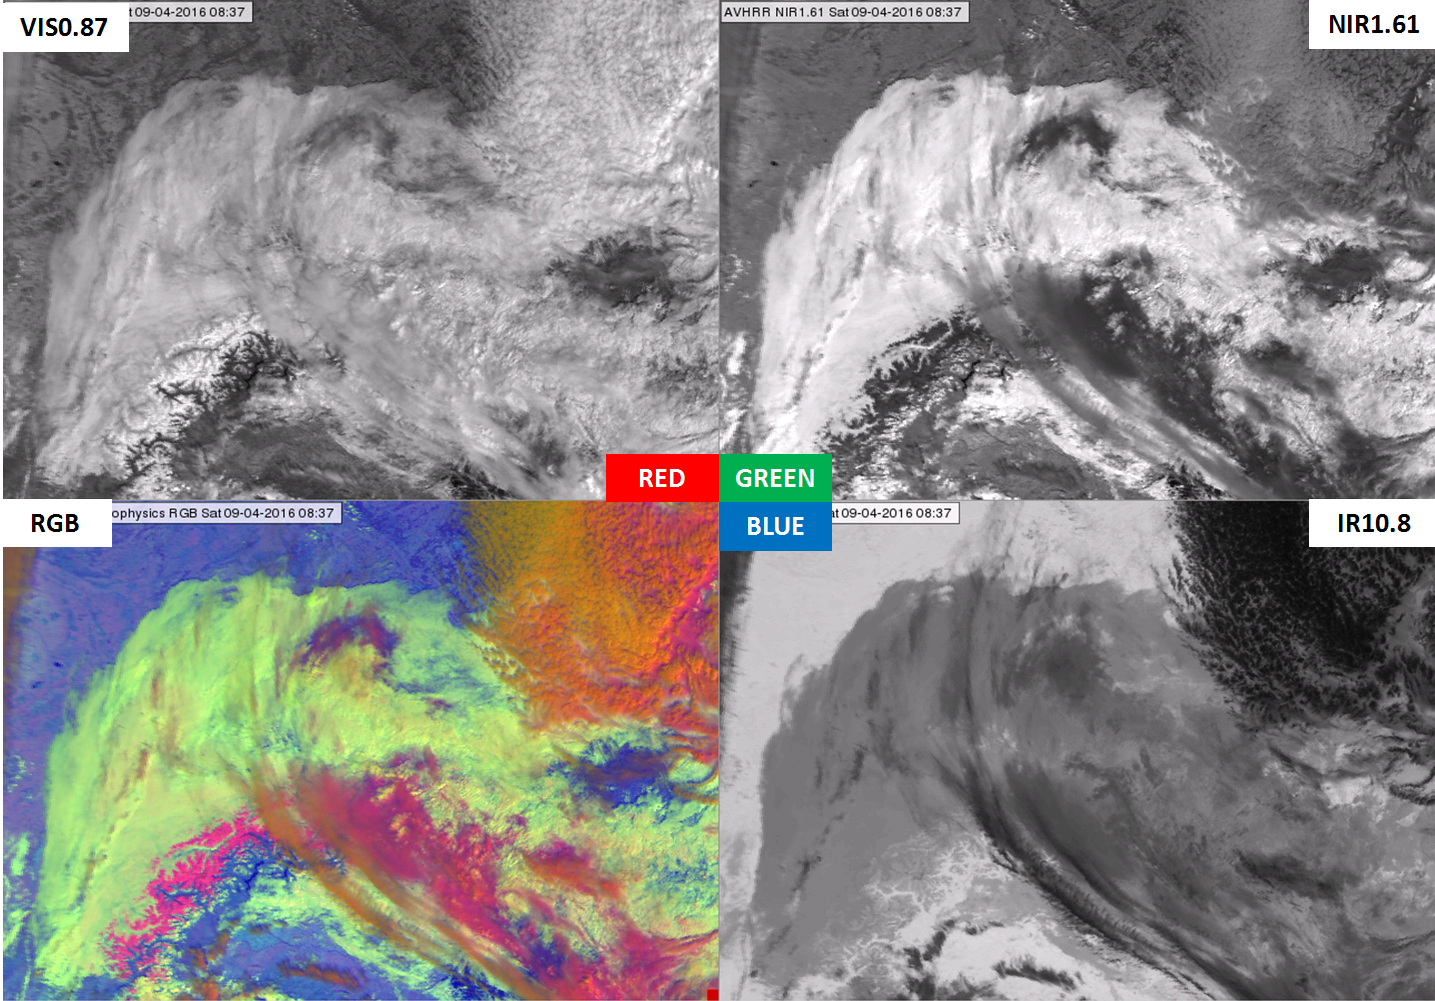
Figure 6: METOP-A AVHRR NIR0.87 (upper left), NIR1.61 (upper right), Day Microphysics RGB (bottom left) and IR10.8 (bottom right) images of the Alps region on 9 April 2016 at 08:37 UTC
Typical colors
The main purpose of this RGB type is to provide complex cloud analysis with good color contrast between cloud types and against the surface.
Fig. 7 shows the typical colors of METOP AVHRR Day Microphysics RGB images. These are only examples and do not display every color and tone available to the RGB type. Note that the brightness and shades of the colors may vary across the swath; for more about this see the chapter 'Effects of the scanning geometry'.
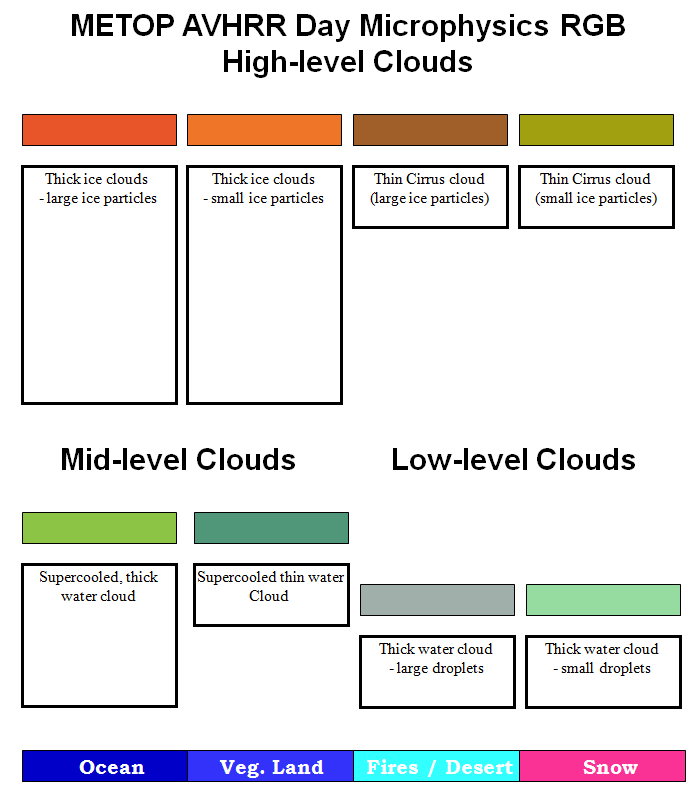
Figure 7: Typical colors of METOP AVHRR Day Microphysics RGB images
Typical colors of the clouds:
The Day Microphysics RGB type contains information on cloud thickness, cloud top phase, particle size and cloud top temperature.
- Thick ice clouds are magenta, red-orange or orange;
- relatively warm thick ice clouds appear magenta,
- cold, thick ice clouds with large particles are red-orange,
- cold, thick ice clouds with small ice crystals on their tops appear orange.
- Thin ice clouds are
- 'dirty' orange (brownish),
- dirty orange with green shades in the case of small ice crystals (see Fig. 9a),
- bright green in cases with extremely small ice crystals (see Fig. 9b).
- Thick mid-level supercooled water clouds are bright medium green.
- Thin mid-level supercooled water clouds appear medium green with a tint of the color of the underlying surface.
- Thick, low-level water clouds with large droplets are gray.
- Thick, low-level water clouds with small droplets are light green.
The color of a semi-transparent cloud depends on the color of that cloud type, its transparency and the color of the underlying surface.
Typical colors of cloud-free regions:
- open water surfaces (ocean, sea, big deep lakes) are medium blue, except for increased aerosol content (like dust clouds) or sunglint,
- snow-free land is bluish or purple - the tones may vary depending on temperature and surface type,
- desert appears light cyan,
- snow-covered land is magenta.
Open water surfaces are usually medium blue in AVHRR Day Microphysics RGB images. Areas with sunglint are an exception. Sunglint is the mirror-like reflection of sunlight off a water surface. Sunglint occurs at a given geometry between the sun and satellite viewing directions. In areas of sunglint an increased amount of solar energy is reflected from the water surface. Smooth ocean water becomes a 'silvery mirror', while rougher surface waters (with big waves) appear less bright. As seas are nearly never perfectly smooth or calm, the Sun's reflection gets blurred giving the water surface a washed-out appearance. Since the reflection is more intense in the NIR1.61 channel than in NIR0.87, and since there is no reflection in the IR10.8 channel, the sunglint appears greenish cyan in Day Microphysics RGB images. Fig. 8 shows examples of weaker and stronger sunglint cases. Note that in Metop AVHRR images (morning orbit), the sunglint area is typically on the eastern side of the satellite ground track.
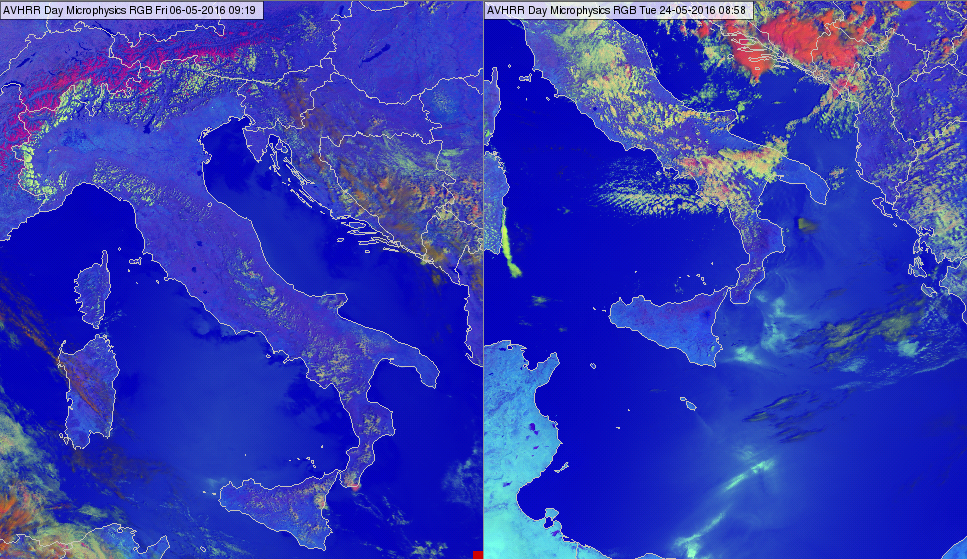
Figure 8: Sunglint over the Mediterranean in AVHRR Day Microphysics RGB images on 6 May 2016 at 09:19 UTC (left) and 24 May 2016 at 08:58 UTC (right)
The following two examples show cirrus clouds with small particles. Fig. 9a shows a case where the front cloudiness is polluted by dust from the Sahara. The left panel shows an AVHRR Day Microphysics RGB image. The right panel is the best matching Meteosat SEVIRI Dust RGB image, included here to confirm that the front cloudiness really is polluted by Sahara dust. (The pink color in SEVIRI Dust RGBs indicates a dust cloud.) In the AVHRR Day Microphysics RGB image the cirrus shield is greener than usual due to the presence of small ice crystals.
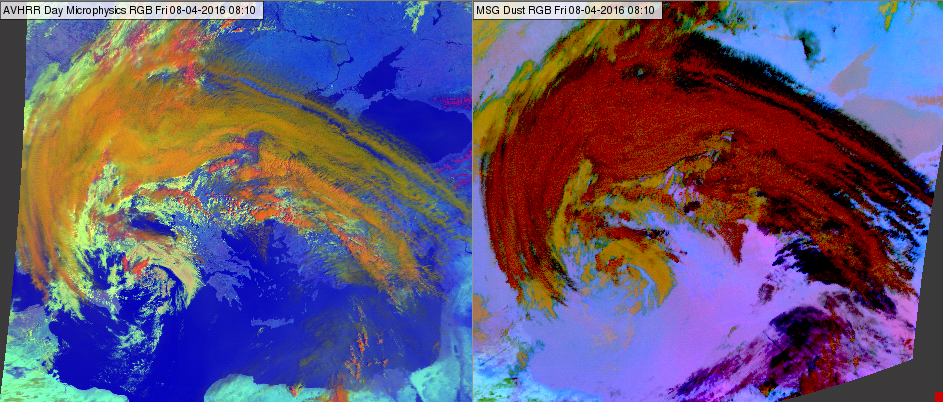
Figure 9a: METOP-B AVHRR Day Microphysics RGB (left) and MSG SEVIRI Dust RGB (right) images of the Mediterranean Sea region on 8 April 2016 at 08:10 UTC
Fig. 9b shows high-level lee clouds south and southwest of the Alps. They appear bright green in the AVHRR Day Microphysics RGB image (upper panel) because they consist of extremely small ice crystals. A SEVIRI Day Microphysics RGB is shown in the bottom panel for comparison. (This link shows what such cirrus cloud with small ice crystals looks like from the ground.)

Figure 9b: AVHRR Day Microphysics RGB (top) and SEVIRI Day Microphysics RGB (bottom) images of the Alps region on 16 March 2014 at 09:52 and 09:40 UTC
Examples of interpretation
Three cases (Figs. 10, 11 and 12) are shown with annotations to demonstrate the proper interpretation of different surface and cloud types in AVHRR Day Microphysics RGB images.

Figure 10: METOP-A AVHRR Day Microphysics RGB images of the Caucasus region on 9 April 2016 at 06:58 UTC
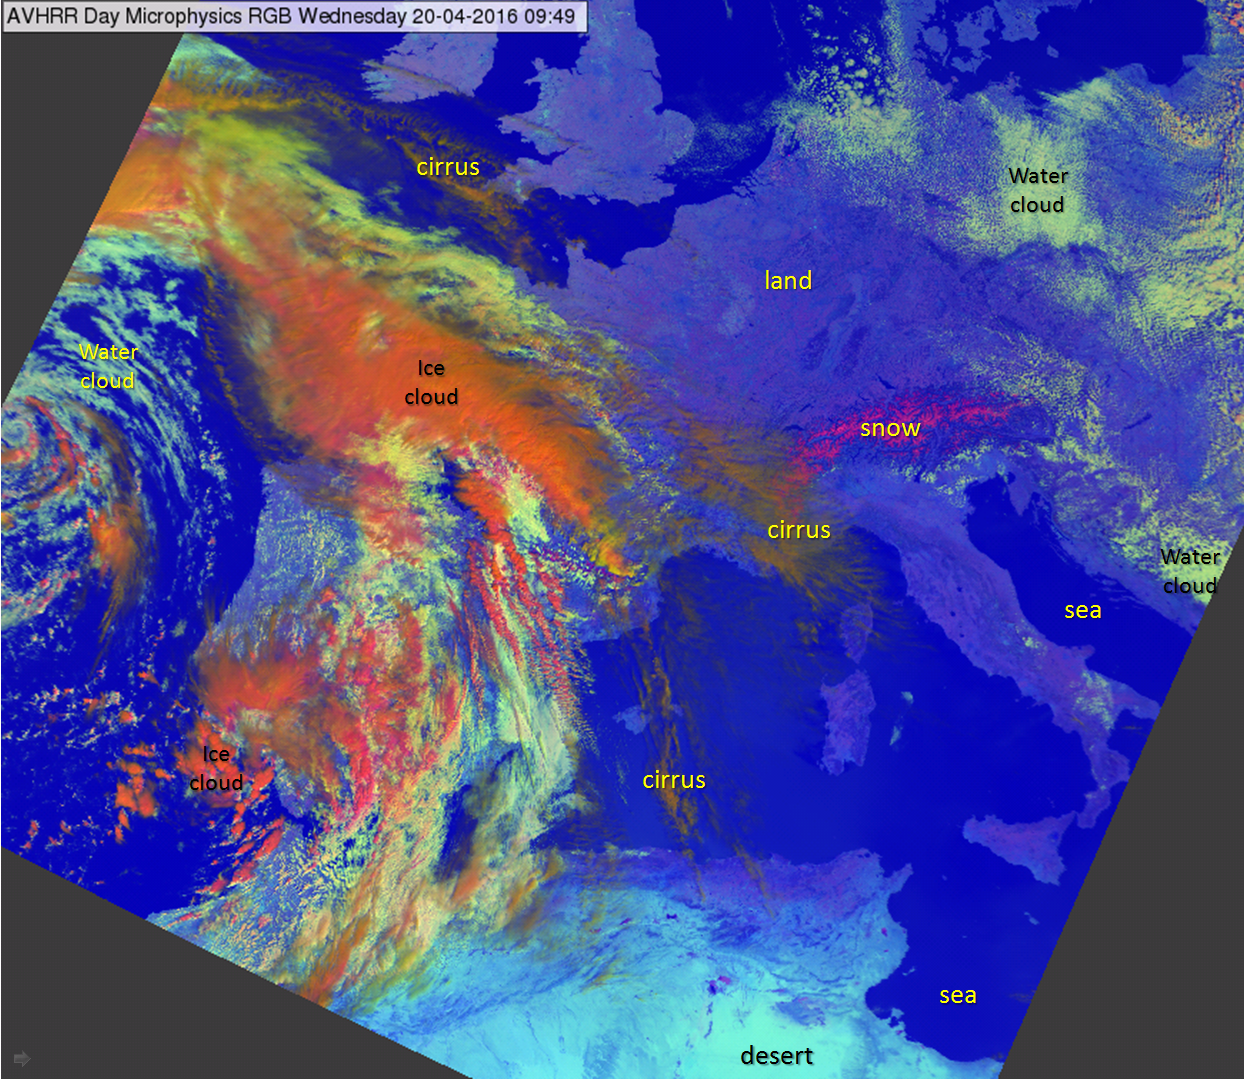
Figure 11: METOP-A AVHRR Day Microphysics RGB images on 20 April 2016 at 09:49 UTC
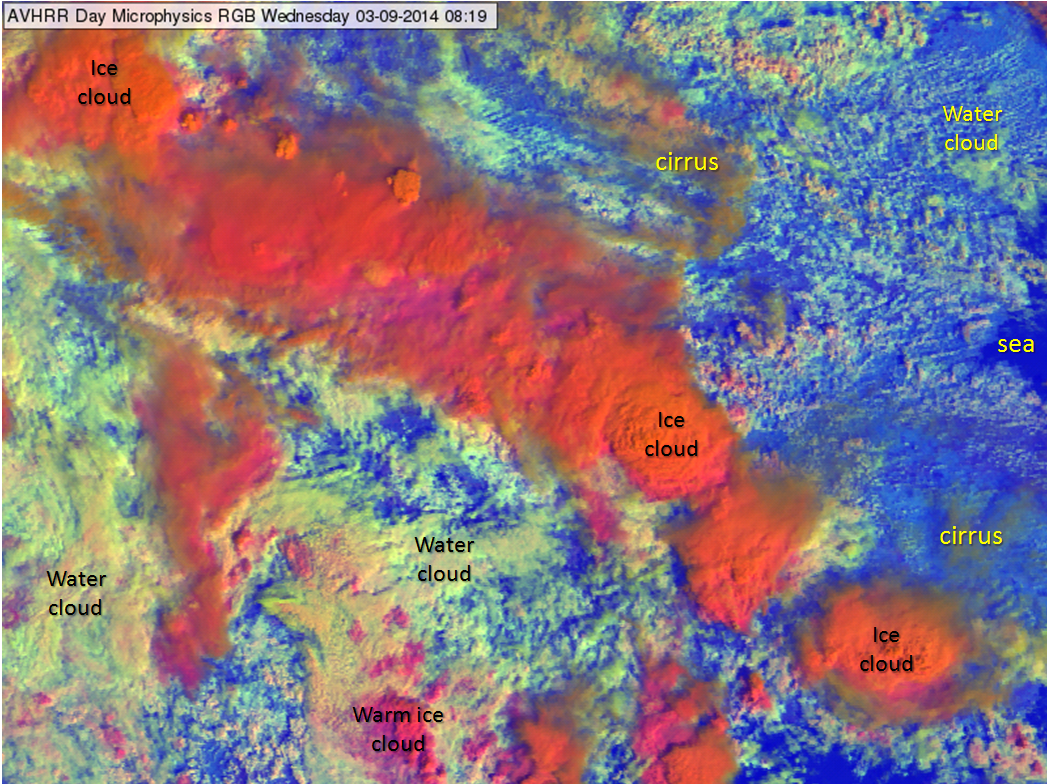
Figure 12: AVHRR Day Microphysics RGB images on 3 September 2014 at 08:19 UTC
Benefits and limitations
Benefits
- This RGB type provides complex and general cloud analysis. It provides information on cloud optical thickness, cloud top temperature and microphysics (phase and effective particle size).
- Good color contrast between
- ice and water clouds
- cold ice clouds and snow
- snow and water clouds
- land and sea
- land and clouds
- sea and clouds
- thin and thick ice clouds
Limitations
- The color contrast between water clouds with small and large particles is weak
- These images are less convenient for the public, because
- the colors are far from natural colors and
- the interpretation of the images requires practice.
Comparison with SEVIRI Day Microphysics RGB images
The METOP AVHRR Day Microphysics RGB will be compared with the standard SEVIRI Day Microphysics RGB, which uses a different channel (IR3.9) for its green component.
However, in the case presented in Fig. 13 it is compared to the non-standard SEVIRI RGB. It is created with the same recipe, but using the SEVIRI NIR1.6 channel as the green component. This comparison is done to show that the AVHRR NIR1.61 channel is very similar to the SEVIRI NIR1.6 channel and as a consequence the two RGBs are also similar. The differences are due to the different satellite viewing angles.

Figure 13: METOP-B AVHRR Day Microphysics RGB (left) and Meteosat SEVIRI RGB created with the same recipe and using the SEVIRI NIR1.6 channel as the green component (right). The images are from 23 May 2016 at 09:19 and 09:25 UTC
In the following examples the AVHRR Day Microphysics RGB will be compared with the standard SEVIRI Day Microphysics RGB. They use different channels for their green components. The solar component of IR3.9 data is used in the standard SEVIRI Day Microphysics RGB as it is more sensitive to cloud top effective particle size than the NIR1.6 channel. However, for AVHRR only the NIR1.61 channel is available during the day.
| MetOp/AVHRR Day Microphysics RGB | |||||
|---|---|---|---|---|---|
| Color | Channel | Range | Gamma | ||
| Red | NIR0.87 | 0 | 100 | % | 1 |
| Green | NIR1.61 | 0 | 70 | % | 1 |
| Blue | IR10.8 | 203 | 323 | K | 1 |
| SEVIRI Day Microphysics RGB | |||||
|---|---|---|---|---|---|
| Color | Channel | Range | Gamma | ||
| Red | NIR0.8 | 0 | 100 | % | 1 |
| Green | IR3.9 refl | 0 | 60 | % | 2.5 |
| Blue | IR10.8 | 203 | 323 | K | 1 |
Table 2: Recipes of the MetOp/AVHRR Day Microphysics RGB and SEVIRI Day Microphysics RGB schemes. The differences are highlighted in yellow.
Table 2 shows the recipes of METOP AVHRR Day Microphysics and SEVIRI Day Microphysics RGBs. The differences are highlighted in yellow. The range and gamma parameter are different for the green component because the channel is different. (Gamma is the parameter of gamma correction, which performs non-linear stretching in case gamma is not equal to 1.)
Fig. 14 shows the simulated albedo of water and ice clouds (red and blue curves) at 1.6 (top) and 3.9 (bottom) micrometers as a function of effective particle size. (The upper panel is identical to Fig. 2.) The ellipses represent the typical range of water droplet and ice particle sizes. There are similarities and differences between the 1.6 and 3.9 μm curves, but it is clear that different ranges are needed for the proper enhancement of data from these wavelengths.
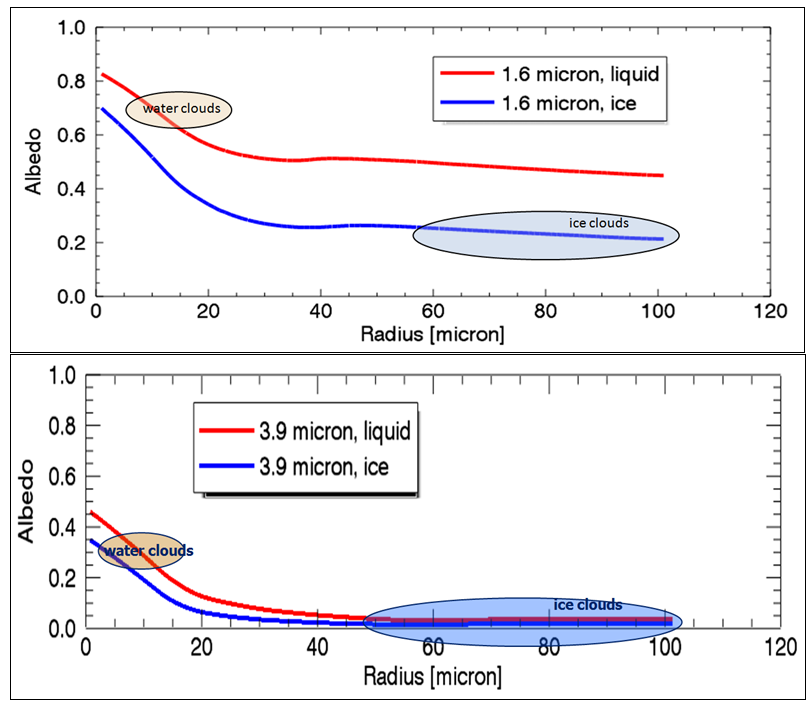
Figure 14: Simulated albedo of water and ice clouds (red and blue curves) at 1.6 (top) and 3.9 (bottom) micrometer wavelengths as a function of effective particle size. The ellipses represent the typical range of water droplet and ice particle sizes.
(Courtesy of Ralf Bennartz, University of Wisconsin)
Figs. 15 - 19 show 2-panel images of AVHRR Day Microphysics RGB and the most closely matching SEVIRI Day Microphysics RGB images. Some remarks on the comparison:
- The spatial resolution is better for AVHRR images.
- The colors of the clouds are similar.
- Surfaces unobstructed by snow or cloud are usually darker in AVHRR images because the AVHRR recipe does not use gamma correction for its green component.
- The contrast between clouds and cloud-free sea/land is higher in AVHRR images.
- The difference between water clouds with small and large droplets is much smaller in AVHRR images (see Figs. 15-17). On the other hand, the valley fog/stratus in the Alps is seen more clearly in Fig 16, since it has a higher color contrast against magenta in AVHRR images.)
- Distinguishing between ice clouds with small and large crystals is comparable or even better in the METOP AVHRR Day Microphysics RGB (see Figs. 16a, 18 and 19). Note that in Fig. 16a the cirrus clouds consist of very small ice crystals. These cirrus clouds were highly polluted by Saharan dust particles.
- Thin semi-transparent ice clouds may appear to have different thicknesses in SEVIRI and AVHRR images due to differences in scanning geometry; see for example the cirrus above the Baltic Sea in Fig. 16a. For more on this see the chapter 'Effects of the scanning geometry'.
- The shades of the AVHRR RGB's colors may change towards the edge of the swath. For more on this see the chapter 'Effects of the scanning geometry'.
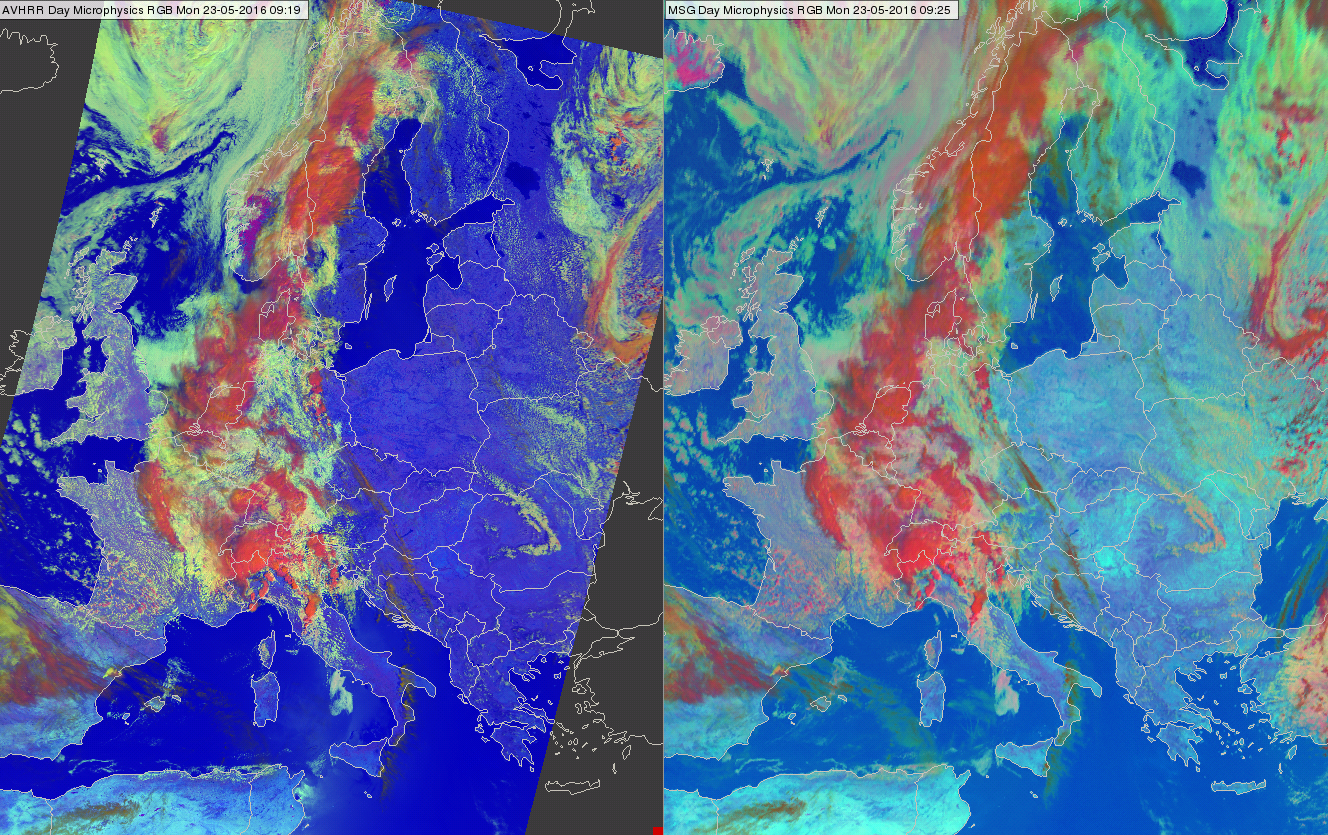
Figure 15: METOP-B AVHRR Day Microphysics RGB (left) and Meteosat SEVIRI Day Microphysics RGB (right) images on 23 May 2016 at 09:19 and 09:25 UTC
(Same slot as shown in Fig. 13)
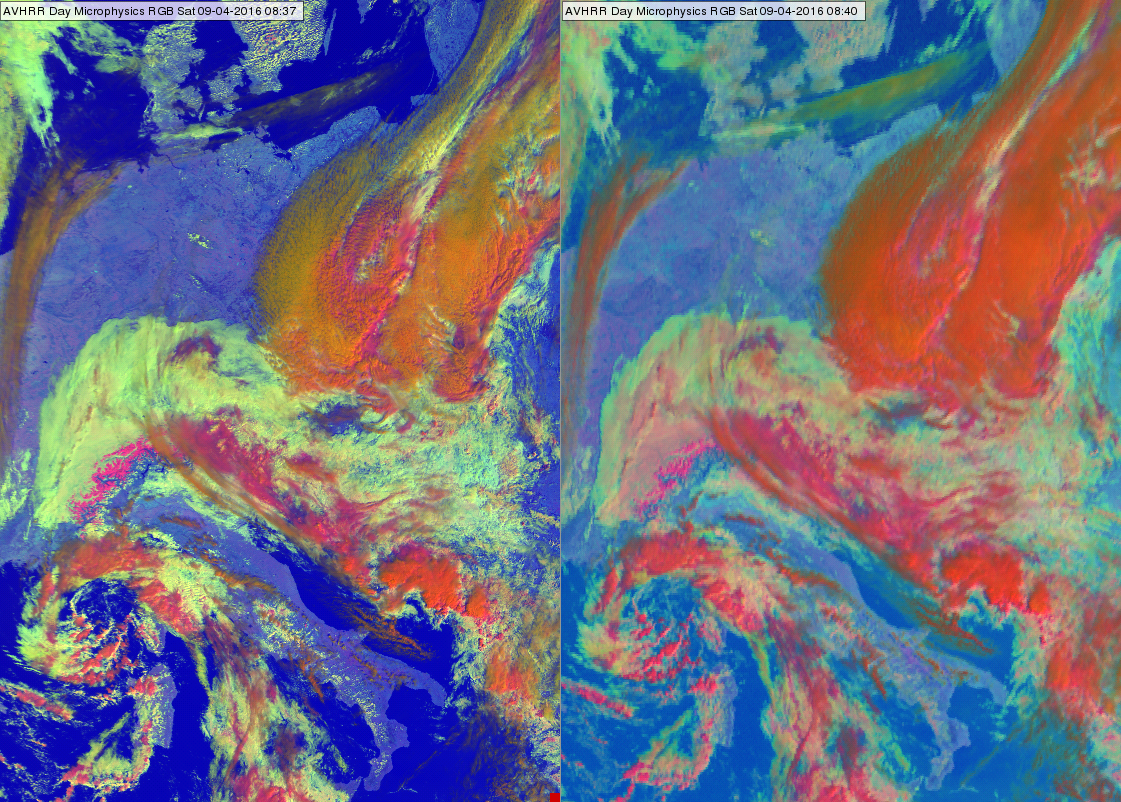
Figure 16a: METOP-A AVHRR Day Microphysics RGB (left) and Meteosat SEVIRI Day Microphysics RGB (right) images on 9 April 2016 at 08:37 and 08:40 UTC
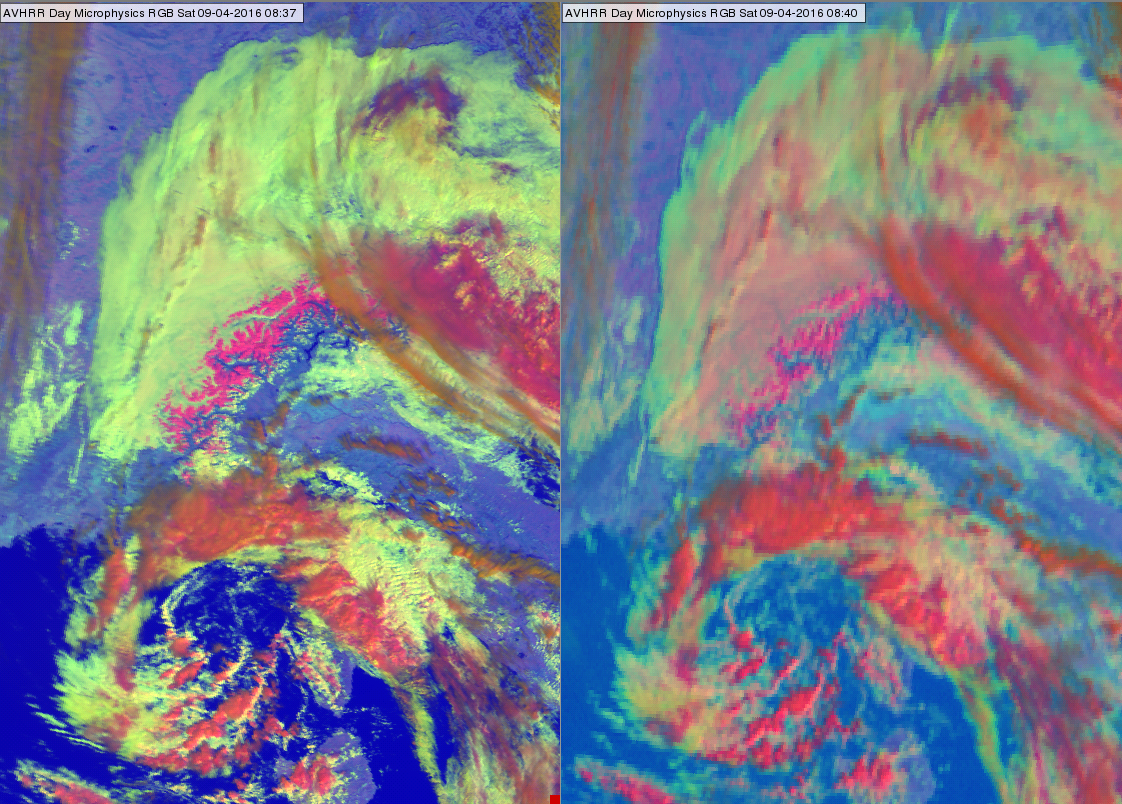
Figure 16b: METOP-A AVHRR Day Microphysics RGB (left) and Meteosat SEVIRI Day Microphysics RGB (right) images of the Alps region on 9 April 2016 at 08:37 and 08:40 UTC. A closer view.
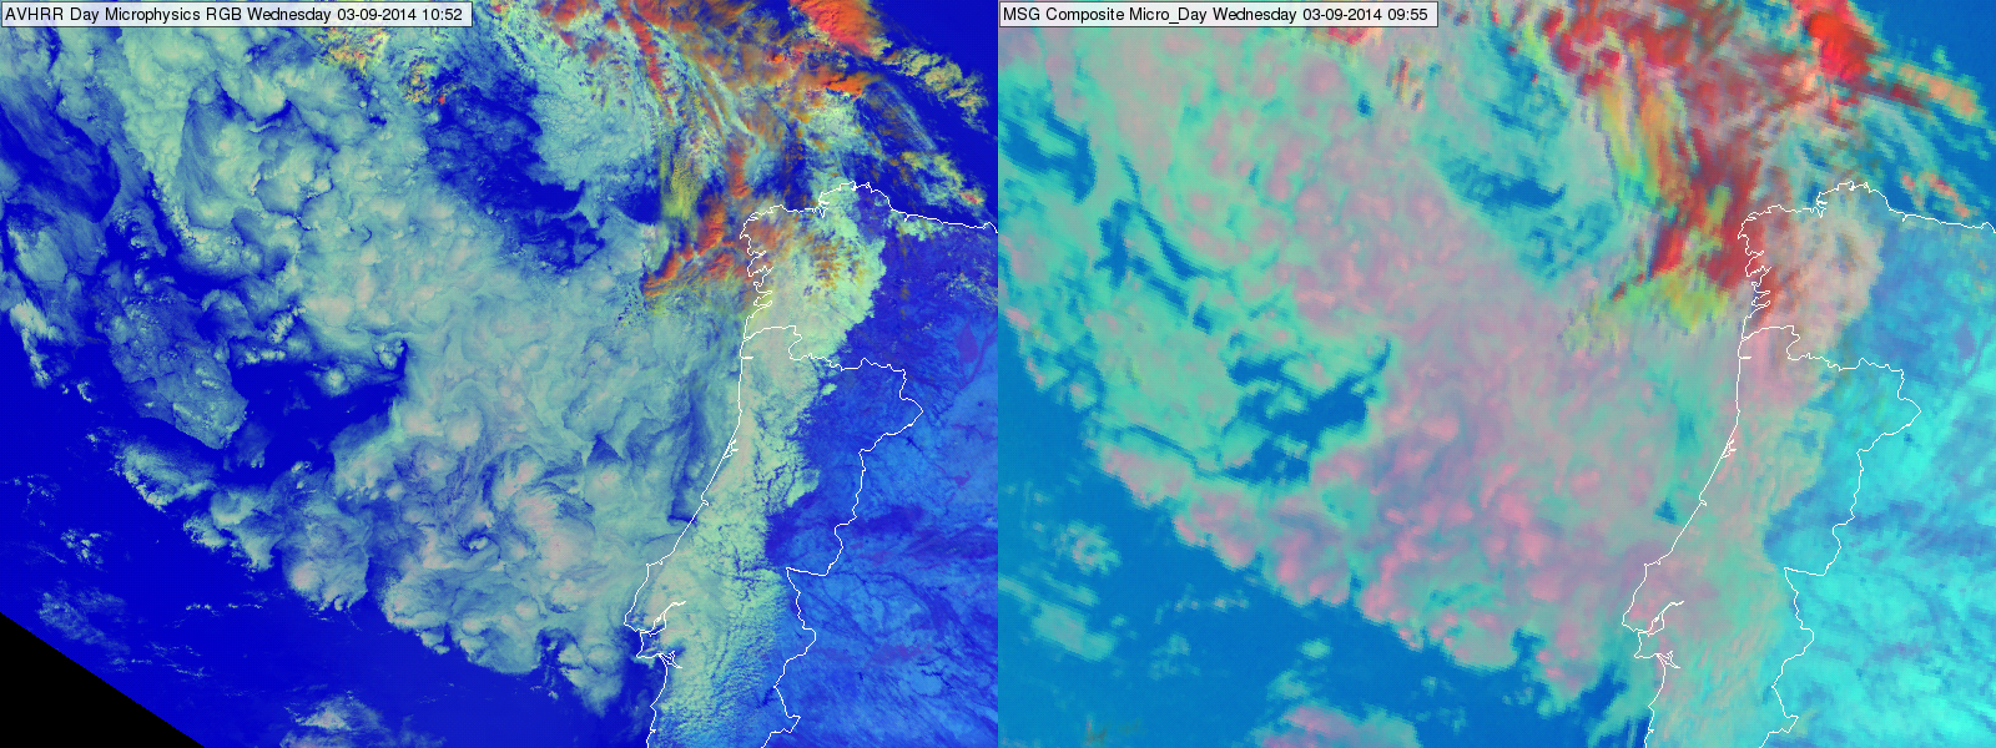
Figure 17: AVHRR Day Microphysics RGB (left) and SEVIRI Day Microphysics RGB (right) images on 3 September 2014 at 10:52 and 09:55 UTC
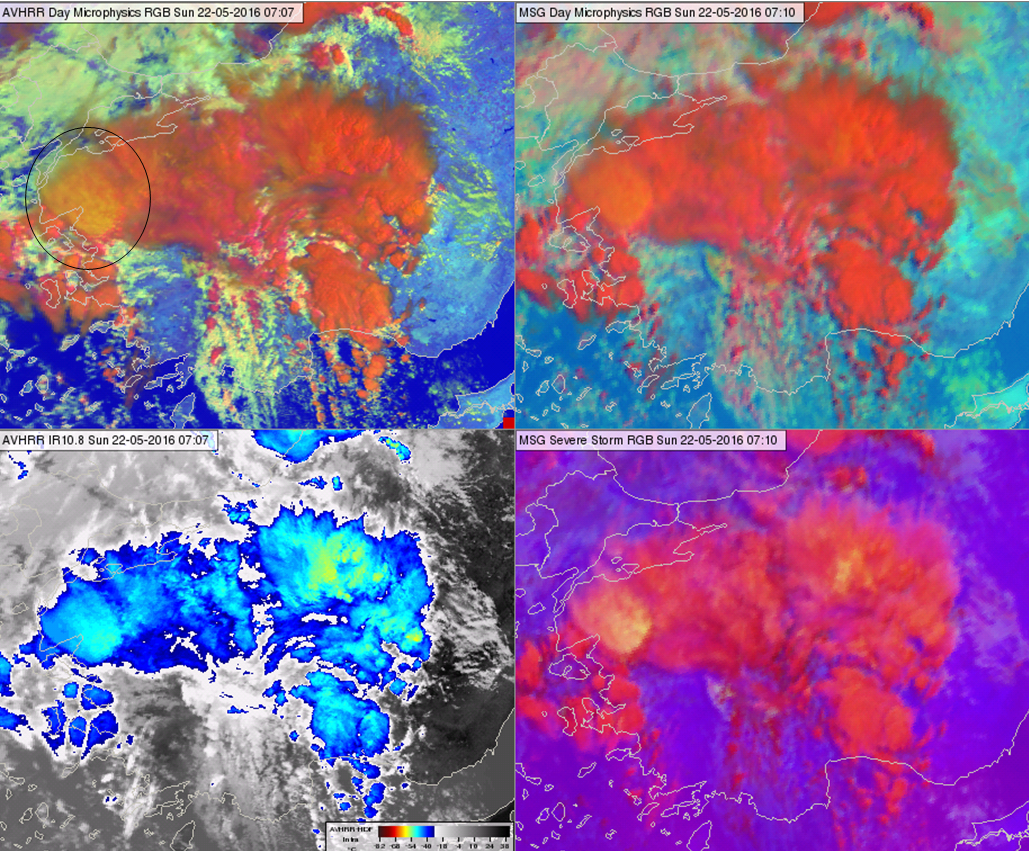
Figure 18: AVHRR Day Microphysics RGB (upper left), SEVIRI Day Microphysics RGB (upper right), AVHRR IR10.8 color enhanced (bottom left) and SEVIRI Severe Storm RGB (bottom right) images over Turkey on 22 May 2016 at 07:07 and 07:10 UTC
Fig. 18 shows convective clouds. Some storms have small ice crystals on their tops. The yellow color in the SEVIRI Severe Storm RGB image (bottom right panel) indicates small particle size and/or a very cold cloud top. However, according to the IR10.8 image (bottom left panel) it is no colder than the other cloud tops in the system, so in this case the yellow color denotes the presence of small ice crystals. In the AVHRR Day Microphysics RGB and SEVIRI Day Microphysics RGB (upper panels) this cloud top has a more orange tone. The color contrast between ice clouds with small and large ice crystals is comparable for both RGB types.
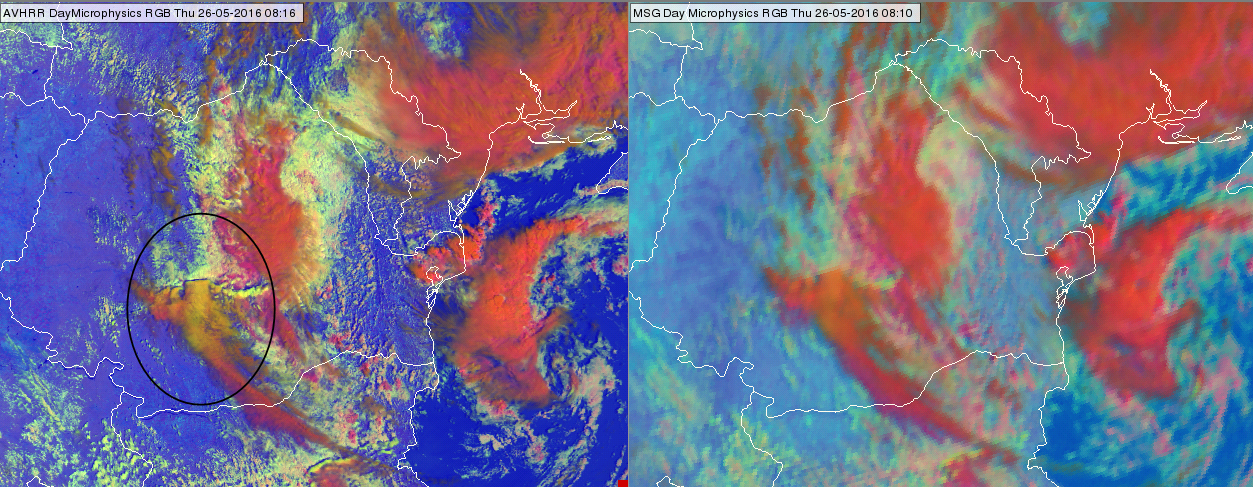
Figure 19: METOP-B AVHRR Day Microphysics RGB (left) and MSG SEVIRI Day Microphysics RGB (right) images on 26 May 2016 at 08:16 and 08:10 UTC
Fig. 19 shows high-level lee clouds south of the Carpathian Mountains. High-level lee clouds typically consist of very small ice crystals. The color contrast between ice clouds with small and large particles is higher in AVHRR Day Microphysics RGBs than in SEVIRI Day Microphysics RGBs.
Exercises
Exercise 1
Which of the following features are present in the numbered areas in Fig. 20? Match each number with only one feature.
Which of the following features are present in the numbered areas in Fig. 20? Match each number with only one feature.
| 1 | 2 | 3 | 4 | 5 | 6 | 7 | 8 | 9 | 10 | 11 | 12 | 13 | 14 | 15 | 16 | 17 | 18 | |
| Cirrus | + | + | + | + | + | + | ||||||||||||
| Water cloud | + | + | + | + | + | |||||||||||||
| Valley fog | + | + | + | |||||||||||||||
| Snow | + | |||||||||||||||||
| Snow-free land | + | + | ||||||||||||||||
| Lake | + | |||||||||||||||||
| Sea | + |
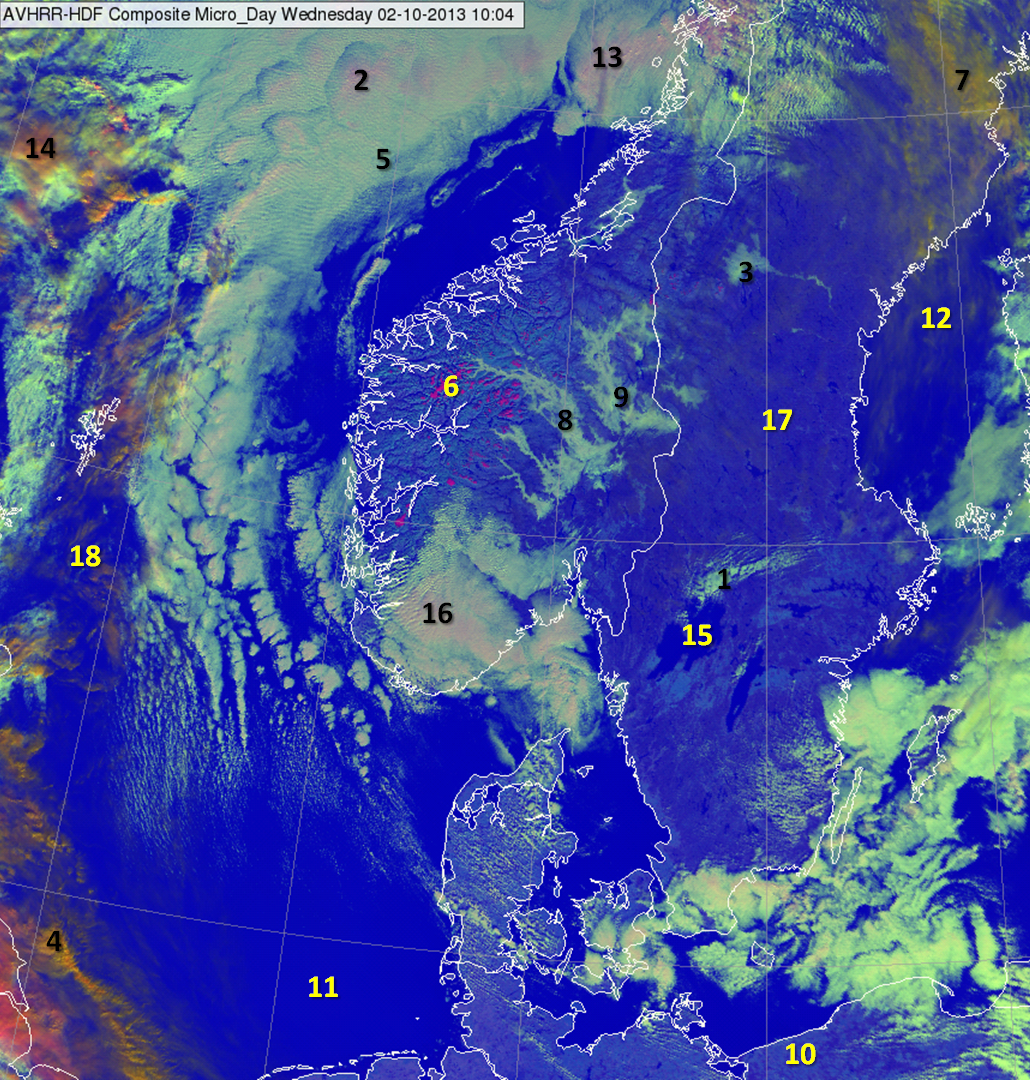
Figure 20: AVHRR Day Microphysics RGB image on 2 October 2013 at 10:04 UTC
Exercise 2
Which of the following features are present in the numbered areas in Fig. 21? Match each number with only one feature.
| 1 | 2 | 3 | 4 | 5 | 6 | 7 | 8 | 9 | 10 | 11 | |
| Thick ice cloud | + | + | |||||||||
| Cirrus | + | ||||||||||
| Cirrus with extremely small particles | + | ||||||||||
| Water cloud | + | + | |||||||||
| Snow | + | ||||||||||
| Land | + | ||||||||||
| Sea | + | + | |||||||||
| Sea with sunglint | + |
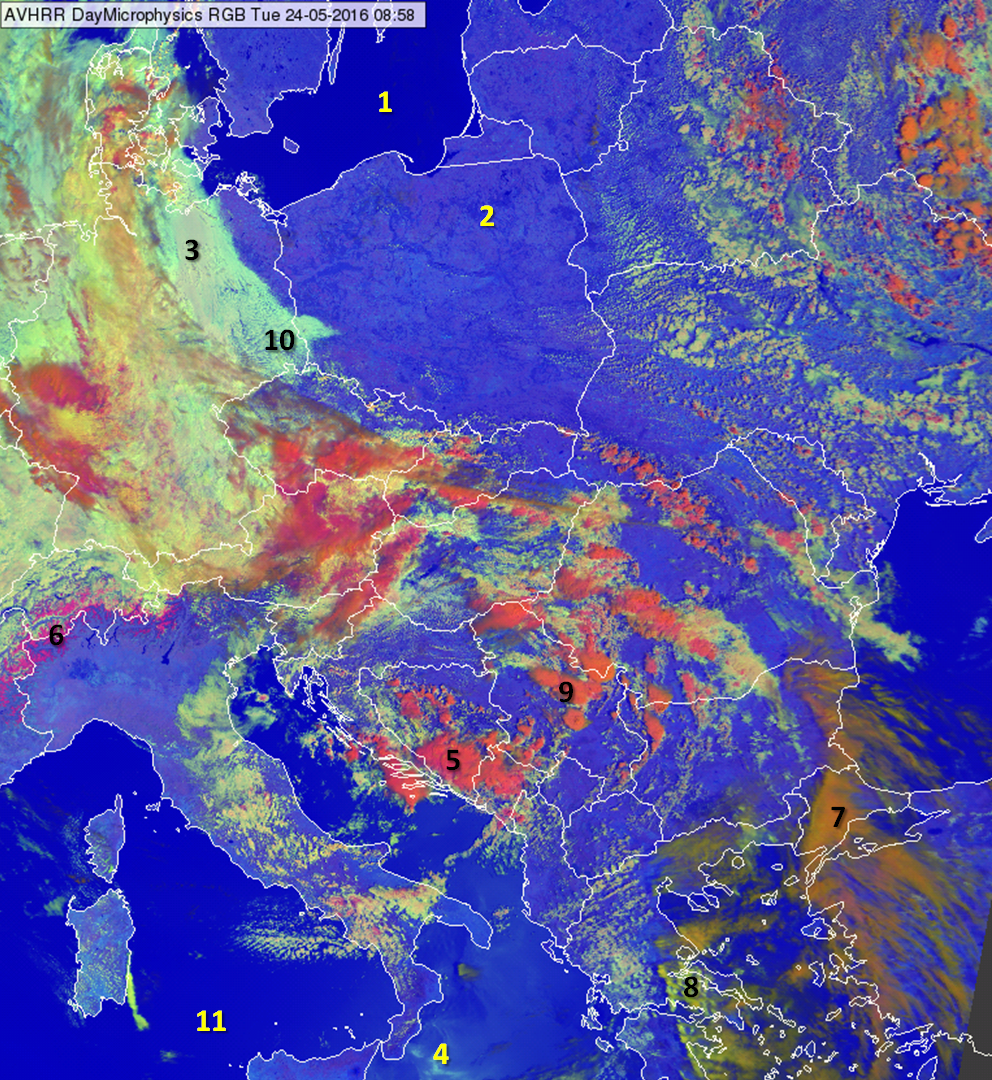
Figure 21: AVHRR Day Microphysics RGB image on 24 May 2016 at 08:58 UTC