How satellites see the surface
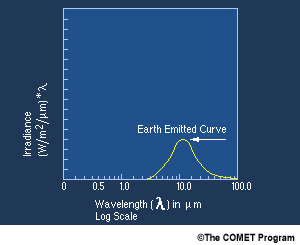
Computing Planck's radiation emission for an assumed average Earth temperature of 290 K as a function of wavelength, as shown in Fig. 5, leads to the conclusion that radiation emissions from the surface peak at around 10 μm, with 90% of total emission at wavelengths >4μm.
Fig. 5: Terrestrial radiation emission curve for an assumed average of 290 K.
As mentioned before, some atmospheric constituents (N2, O2, H2O, CO2, N2O, O3, CH4) interact with the propagating radiation in its path from the surface towards the satellite to a degree that depends on the concentration of these components, but also on the wavelength of the propagating radiation. Fortunately, there are some regions of the electromagnetic spectrum where these effects are less pronounced, which are called the atmospheric windows . Satellite sensors designed to sense the surface are equipped to make use of these windows.
Fig. 6: Radiation emission curves for distinct surface temperatures ranging between 200 and 300 K computed with Planck's function. Observed radiation emitted from the surface at 295 K (yellow curve) is superimposed on top, revealing the attenuation effects of some atmospheric components (H2O, O3 and CO2).
Figure 6 shows surface emission considering different temperatures (200 K - 300 K) in the white curves, computed with Planck's function between 2 and 16 μm. The yellow line shows satellite-measured radiation values of the Earths's surface at 295 K. As observed, the yellow curve varies with wavelength due to absorption and emission by atmospheric gases at different pressure levels (O3, CO2 and mostly water vapor), revealing the presence of absorption bands as well as atmospheric windows where measured radiance is closer to the theoretical 300 K curve. As can be concluded from this figure, some atmospheric windows for thermal infrared radiation coincide with the spectral band where radiation emission from the surface is at its maximum. And yet, despite the atmosphere being almost transparent to thermal infrared radiation in the window regions, the effect of the trace gases is not negligible in the LST retrieval and therefore some correction is still required.
Fig. 7 shows the locations of some spectral channels that can potentially be used for LST retrieval. The atmospheric transmittance (gray line) is plotted between 3.5-14 μm. At the top of the figure are indicated infrared channels locations for 5 geostationary meteorological satellites, MSG, MTSAT, GOES12, GOESR and HIMAWARI-8.
Fig. 7: Atmospheric transmittance as a function of wavelength. Spectral range/location of thermal infrared channels for 5 geostationary satellites are indicated by the colored bars at the top of the graph.
We can see that in this set of satellites, the most recent ones (GOESR, HIMAWARI-8 and MSG) are fitted with 4 to 5 channels located in the thermal infrared windows.
There are some issues with channels IR3.9 and IR 8.7 that hamper their use for LST retrieval. As seen in Fig. 7, IR3.9's transmissivity is close to 1 around these wavelengths, making it a good candidate (weak water vapor absorption in this band). Yet this channel is not only sensitive to infrared emission but also to solar reflected radiation, as shown in Figure 8. It is solar contamination of the IR3.9 channel during daytime that compromises its use for LST retrieval.
Fig. 8: This figure shows the solar and thermal emission curves as a function of wavelength. It is clear from these curves that the 3.9 μm channel is sensitive both to solar and thermal radiation, whereas the 8.7 μm, 10.8 μm and 12 μm spectral channels are only sensitive to thermal radiation.
The second issue is related to the high variability of spectral emissivity both in IR 3.9 and IR 8.7 bands, particularly for desert areas. This can be seen in Figure 9, which shows atmospheric transmittance for the 3.5-14 μm range, this time superimposed with average and standard deviations of emissivity (right axes) computed from MSG2 IR channels for desert areas (in orange) and forests (in green). As can be seen, there is high uncertainty in emissivity estimations for both the IR3.9 and IR8.7 channels, mainly for desert areas.
Fig. 9: Atmospheric transmittance as a function of wavelength in the left axis. Spectral ranges/locations of thermal infrared channels for the MSG2 satellite are indicated by the red horizontal bars at the top of the graph. The average values and standard deviation of the emissivities computed from MSG2 channels 3.9 μm, 8.7 μm, 10.8 μm and 12 μm for deserts and vegetation are represented by the orange and green bars, respectively.
The remaining channels, IR10.8 and 12.0, are then the most commonly chosen candidates for satellite-based LST estimations. These channels are the most common choice since the atmospheric interference can be estimated from the difference in radiance between these two channels. On the other hand, these channels are also the ones where uncertainties in emissivity are relatively low for most types of surfaces.
But do we really need more than one spectral channel to estimate LST? What are the main obstacles for satellite-based LST retrieval?
Coming back to the RTE we see that even after taking into account the atmospheric effect (i.e. estimating the atmospheric transmissivity) we are still left with two unknowns in our equation: the spectral emissivity and LST. The problem is undetermined. As emissivity is a spectral quantity, even if we increase the number of channels (n >1), there will still be n+1 unknowns (n channels+LST). However, though there are ways to retrieve LST with a single satellite channel, the most common method uses several channels.
Given the fact that the inversion of the RTE is an ill-posed problem (there is no unique, well-defined solution for each choice of data) some assumptions and approximations must be made. Over the years several algorithms have been proposed for the many sensors in space working in the TIR (Thermal Infrared Region). In the next section a very brief overview on the different approaches is provided.


