Chapter VII: Shear-Gravity Waves In Satellite Images
Table of Contents
- Chapter VII: Shear-Gravity Waves In Satellite Images
- Shear-gravity waves and turbulence
- Example: 7 January 2016, 12:00 UTC
- Example: 16 December 2011
- Exercises
Shear-Gravity Waves In Satellite Images
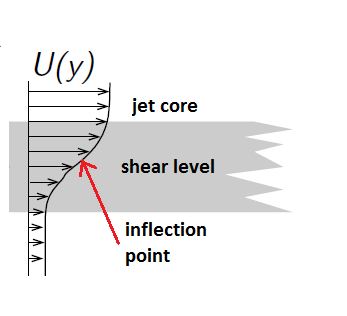
Shear-gravity waves (also called Kelvin-Helmholtz waves) are often seen as substructures in high level cirrus clouds and are closely connected to the subtropical or polar jet stream. Their development only depends on the vertical velocity profile of the wind. The wind profile should have at least one inflection point. This inflection point can be found below and above the jet core (figure 1).
Figure 1: Schematic of the wind profile below the jet core
In contrast to the gravity waves discussed previously, Kelvin-Helmholtz waves are highly unstable and have the tendency to break. The reason for instability is strong vertical wind shear. Because of their tendency to break, shear-gravity waves do not persist as long as pure gravity waves.
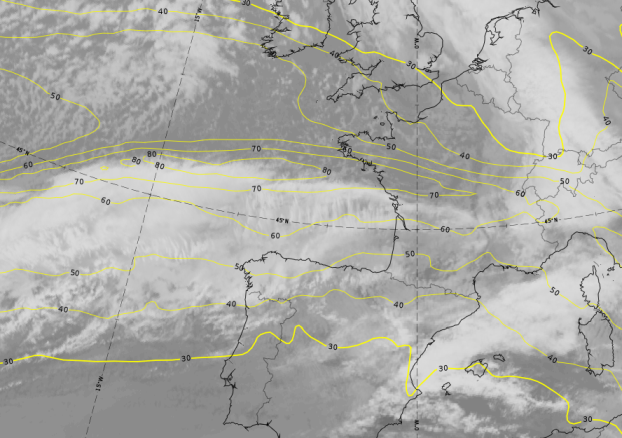
Figure 2 shows parallel cloud bands oriented perpendicular to the jet axis and consisting of small ice particles. While these cloud bands typically range from a few dozen to a few hundred kilometers in length, they can extend over 1000 to 2000 kilometers horizontally in the stable upper troposphere.
Shear-gravity waves are typically located on the anticyclonic side of the jet axis. They are also called transverse cloud bands and are treated in Chapter V of the Water Vapor Imagery Pallet module.
|
|
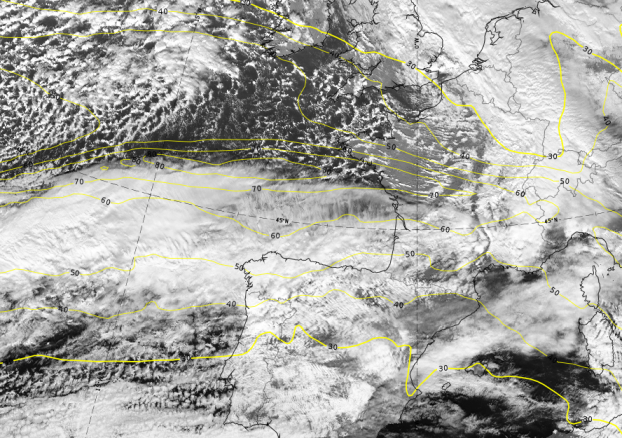
Figure 2: MSG IR 10.8 μm and HRV image from 7 January, 2016 at 12:00 UTC. Transverse cloud bands can be seen over and west of the Bay of Biscay. The isotachs at 300 hPa are depicted in yellow (use the slider).
As high level shear-gravity waves consist of small ice crystals, they are easiest to see in IR imagery because of their low temperature. These layers are often optically thin and therefore hard to see in HRV image. Notice the difference in visibility between the low lee cloudiness over Spain and France (water clouds) and the shear-gravity waves (ice clouds) in both spectral channels.
Shear-gravity waves and turbulence
Shear-gravity waves are the cause of severe turbulence, often in the form of clear air turbulence (CAT), experienced by aircraft cruising at jet level. Aircraft flying at these levels are subject to vertical accelerations during rapid crossing of bodies of air which are moving vertically at different speeds. A vertical wind speed of 9.8 m/s affects the aircraft with a force of 1g.
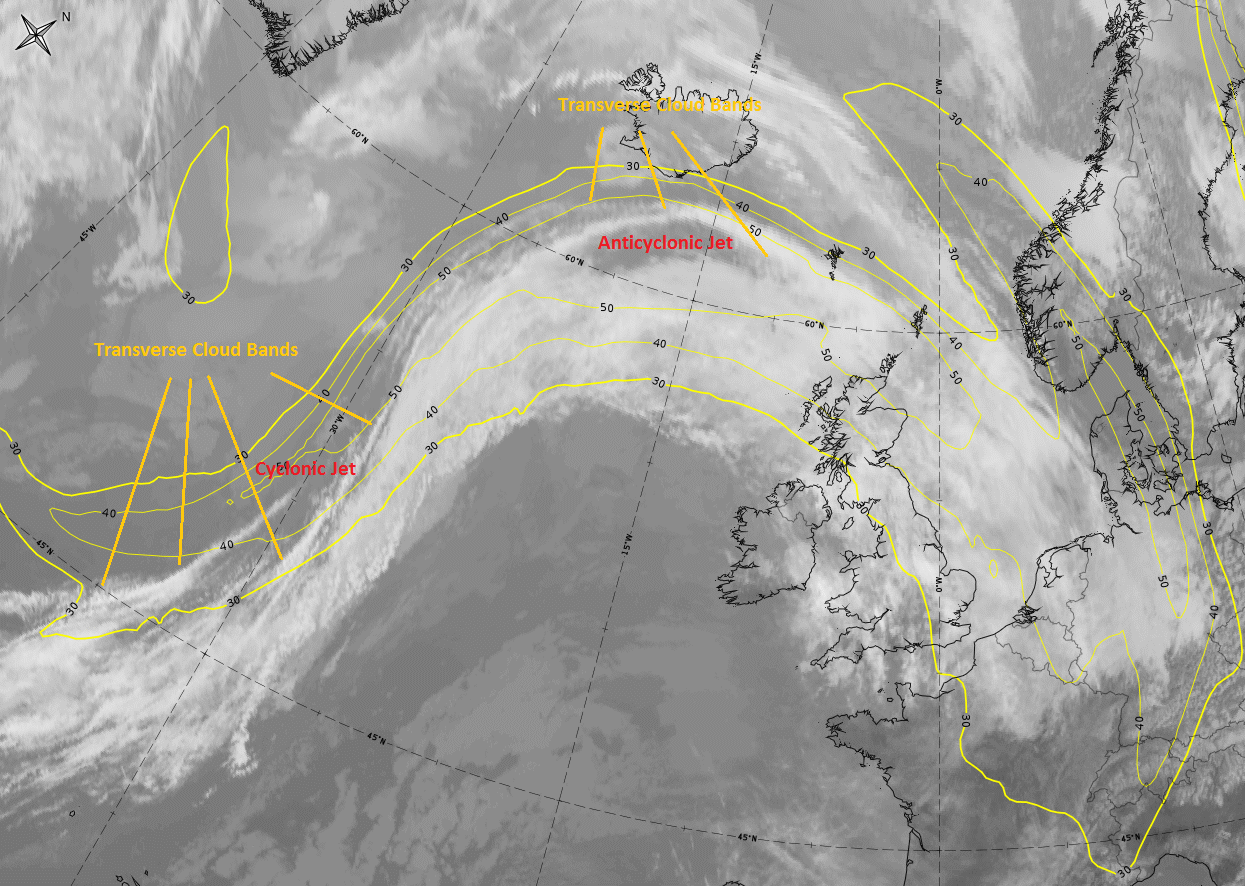
As shown in figure 3, transverse cloud bands can result from vertical oscillations in the air, which means they can be signs of turbulence. In jet streams, turbulence is generally found in the baroclinic zones above and below the jet core. There is a tendency for turbulence to be concentrated in the lower zone of cyclonically curved jets and in the upper zone of anticyclonically curved jets.
Figure 3: IR10.8 μm image from 11 August, 2016 at 12:00 UTC.
The origin of transverse cloud bands lies in the vertical wind shear caused by the jet stream. When wind shear increases strongly as is the case near jet streaks, frictional forces within the stable stratified air increase. Friction between layers with differing wind speed leads to small vertical disturbances forming a wave-like pattern within the atmospheric stream, similar to the way wind interacts with the ocean's surface. Due to the different velocities of the air between wave crest and wave trough (vertical wind shear), wave tops will overrun the wave base and the waves start to break.
This special kind of instability appearing at shear-gravity waves has been named after the physicians Lord Kelvin and Hermann von Helmholtz. Breaking shear-gravity waves will lead to moderate or severe clear air turbulence. Again, when the air is near saturation, ice crystals form at the wave crest and they can be detected in satellite images.
Figure 4: Numerical simulation of Kelvin-Helmholtz instability (Source Wikipedia)
Notice:
Transverse cloud bands visible in WV and IR imagery are an indication of turbulence in the upper troposphere. However, the absence of transverse bands is not a sign of a laminar atmospheric flow, since shear-gravity waves become visible only when the air is nearly saturated with moisture.
Example: 7 January 2016, 12:00 UTC
As previously seen in figures 2 and 3, the transverse cloud bands are located in the higher troposphere above frontal cloud bands. In this example the shear-gravity waves are located within a frontal cloud band over the Atlantic on the anticyclonic side of the jet axis.
The contrast between wave crest and wave trough is higher in WV 6.2 μm than in IR 10.8 μm (see figure 5). This difference in visibility results from the fact that high level cirrus clouds tend to blur IR images more than they do with WV images. Thin cirrus clouds are optically thick in the IR 10.8 μm channel, while the WV channel at 6.2 μm represents the water vapor content of a vertically integrated layer.
|
|
Figure 5: MSG IR 10.8 μm and WV 6.2 μm from 7 January at 12:00 UTC. The red circle in the IR image contains most of the shear-gravity waves (use the slider).
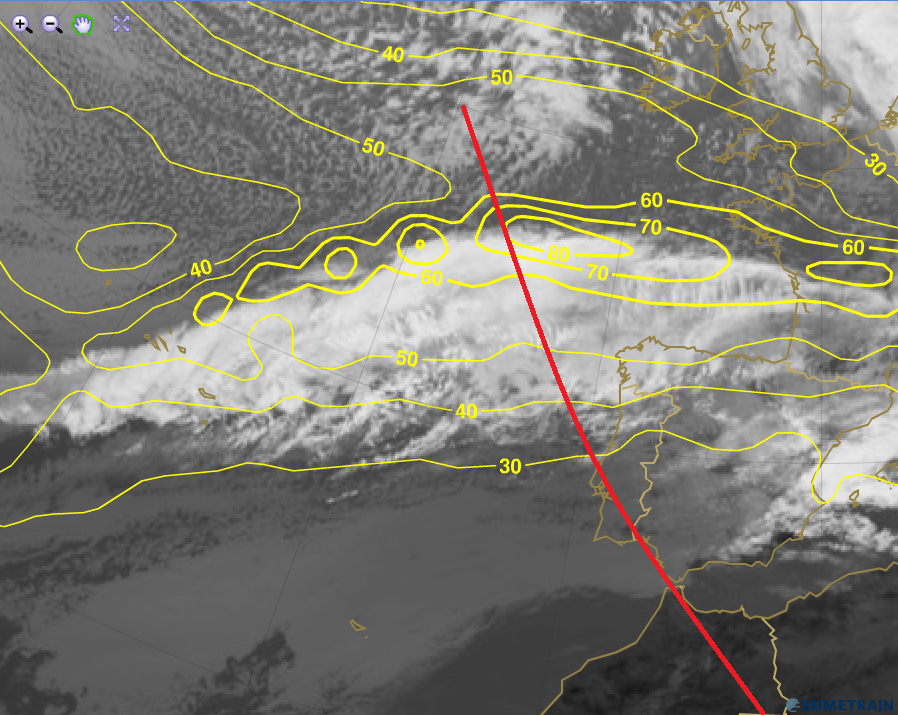
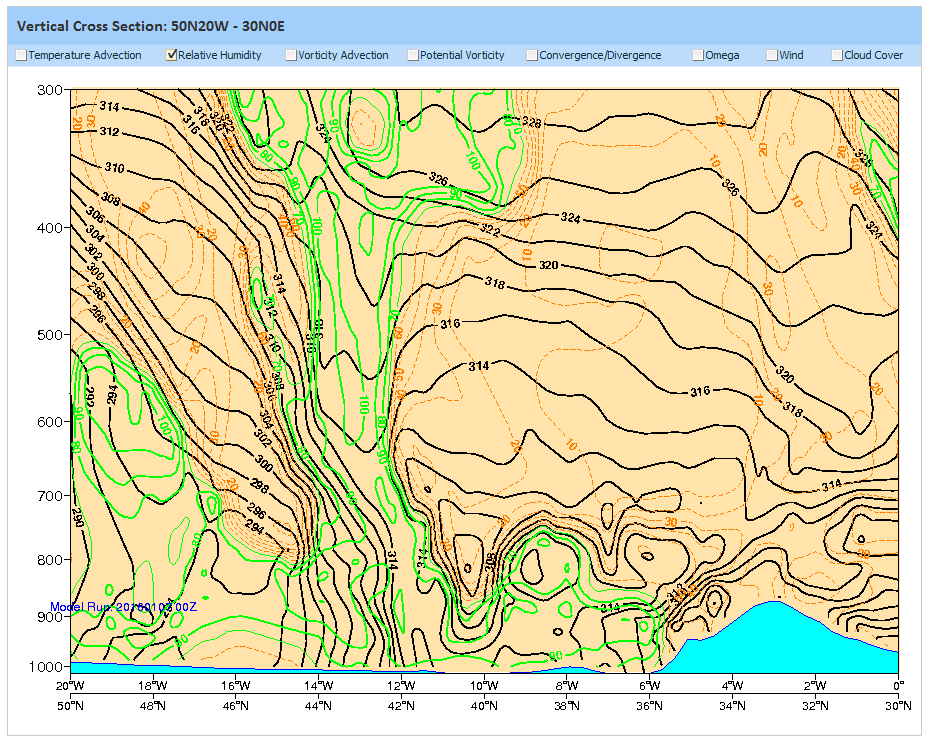
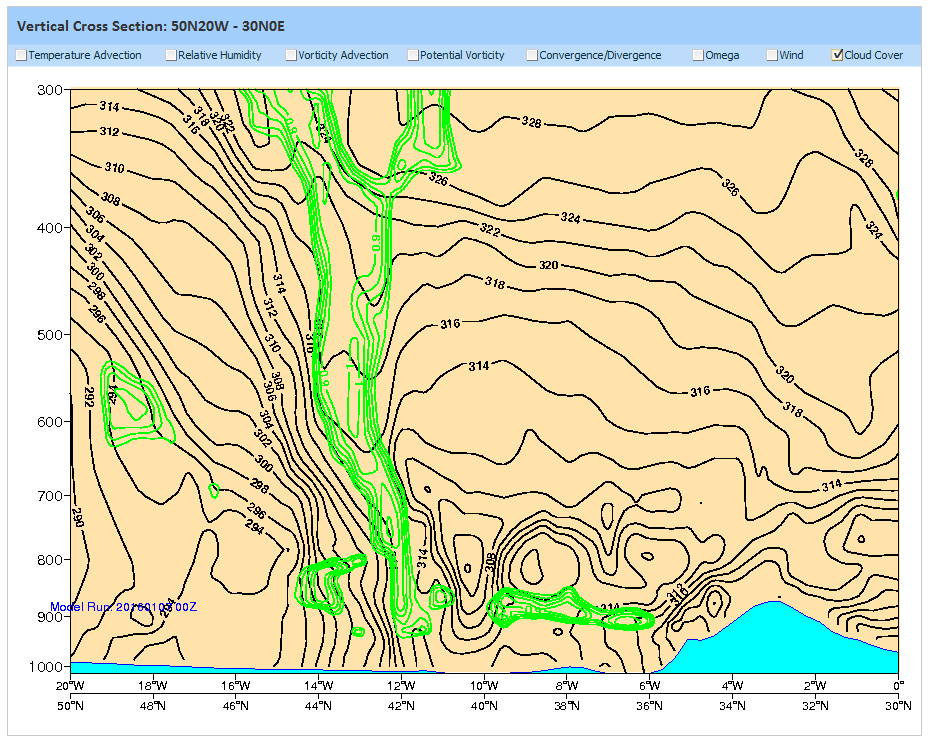
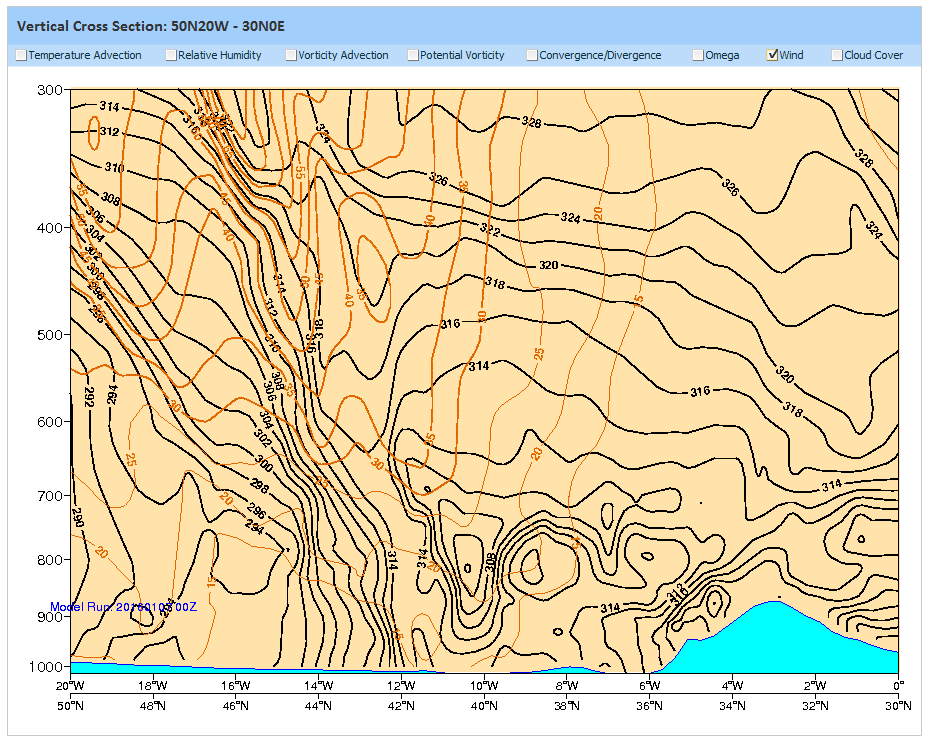
A vertical cross section (figure 6a-6d) through the cloud band west of Spain shows the frontal zone of a cold front. This pronounced cold front marks the transition from the polar to a warmer and more humid air mass. ECMWF cloud parameterization shows the presence of a broader zone of high level cloudiness (and humidity) ahead of the cold front above 400 hPa.
Figure 6a-6d: Vertical cross section through the cold front with ECMWF model data. The date is the same as in figure 5.
- Position of the vertical cross section (red line)
- Equivalent potential temperature (black) and relative humidity (green/brown)
- Equivalent potential temperature (black) and cloud cover (green)
- Equivalent potential temperature (black) and isotachs (brown)
The crowded isolines of the equivalent potential temperature in figure 6b-6d show the position of the cold front between 16W/46N and 12W/42N. The high values of relative humidity as a precondition for condensation are reflected in the model fields as well as the cloud cover seen in satellite imagery. The isotachs with a wind maximum around 300 hPa suggest strong vertical wind shear.
When relative humidity is near 100%, conditions are favorable for Kelvin-Helmholtz wave to become visible in satellite imagery (formation of ice crystals).
Example: 16 December 2011
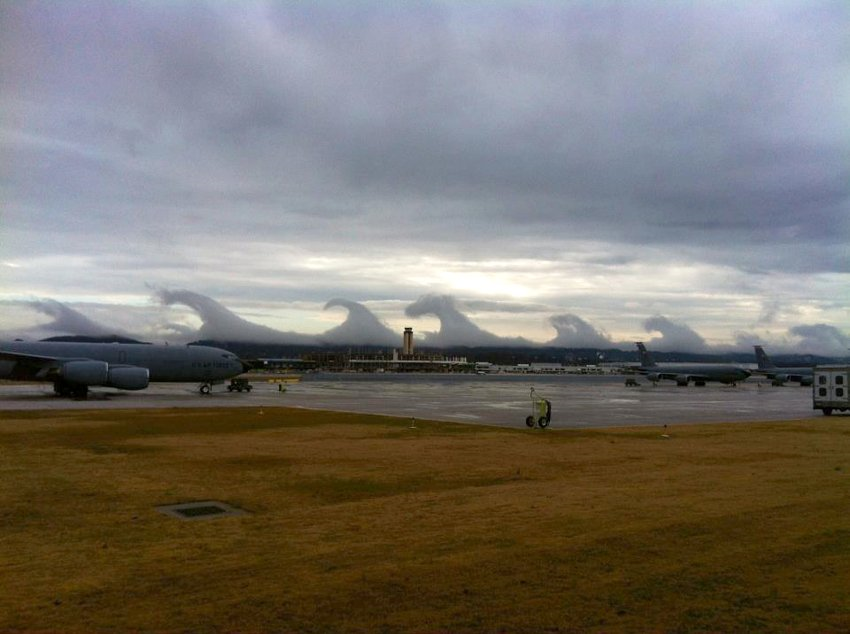
Kelvin-Helmholtz waves also exist in lower atmospheric levels as shown in the example below from Birmingham, Alabama in December 2011 (figure 7). The wind blows over a cold near-surface cloud layer. On top of the cloud layer, at the level of the temperature inversion, vertical wind shear generates waves.
Figure 7: Kelvin-Helmholtz waves over Birmingham, Alabama on 16 December 2011. ©ABC 33/40-TV.
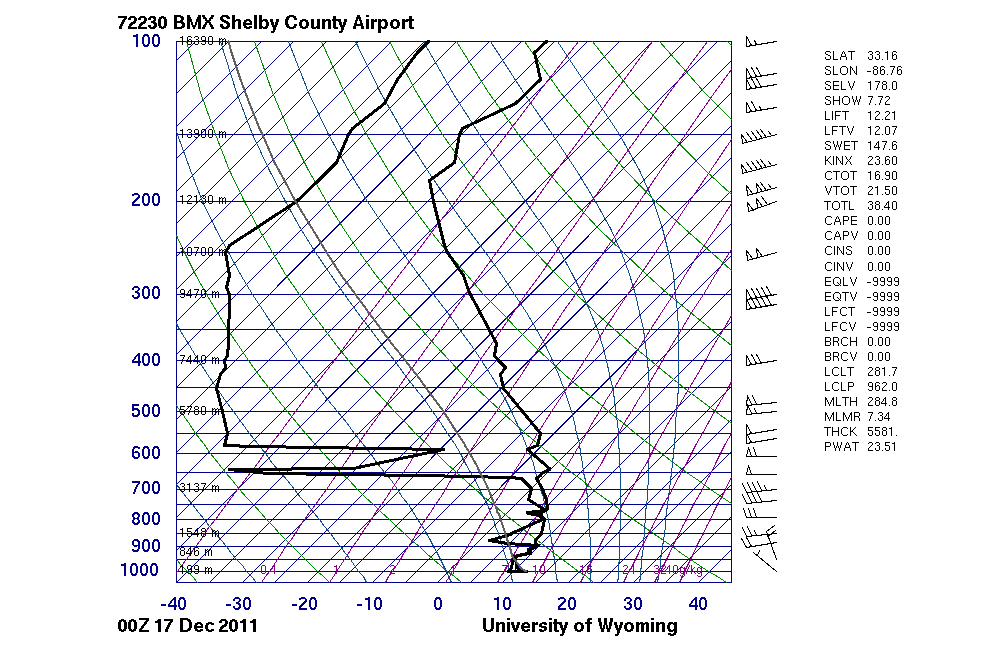
Figure 8 shows the corresponding sounding (17 December 2011 at 00 UTC) from the nearby Shelby County Airport. A low level inversion can be detected at around 900 hPa with a vertical wind shear of about 15 knots (5 knots below and 20 knots above the inversion). This is approximately the height of the wave base observed in figure 7.
Figure 8: Sounding from 17 December 2011 at 00 UTC at Shelby County Airport (Alabama)
Exercises
The IR 10.8 μm satellite image below shows two frontal systems, one over the Atlantic and the other over central Europe. Both systems involve high wind speeds at 300 hPa (Click here for the NWP parameter "isotachs at 300 hPa").
Choose the right position
Find the three regions with transverse cloud bands by clicking on the image above. MSG IR 10.8 μm image from 2 January, 2016 at 12:00 UTC.
For a larger image click here
- Solution: Click here for the solution.
2. Choose the right answer
