Example: 7 January 2016, 12:00 UTC
As previously seen in figures 2 and 3, the transverse cloud bands are located in the higher troposphere above frontal cloud bands. In this example the shear-gravity waves are located within a frontal cloud band over the Atlantic on the anticyclonic side of the jet axis.
The contrast between wave crest and wave trough is higher in WV 6.2 μm than in IR 10.8 μm (see figure 5). This difference in visibility results from the fact that high level cirrus clouds tend to blur IR images more than they do with WV images. Thin cirrus clouds are optically thick in the IR 10.8 μm channel, while the WV channel at 6.2 μm represents the water vapor content of a vertically integrated layer.
|
|
Figure 5: MSG IR 10.8 μm and WV 6.2 μm from 7 January at 12:00 UTC. The red circle in the IR image contains most of the shear-gravity waves (use the slider).
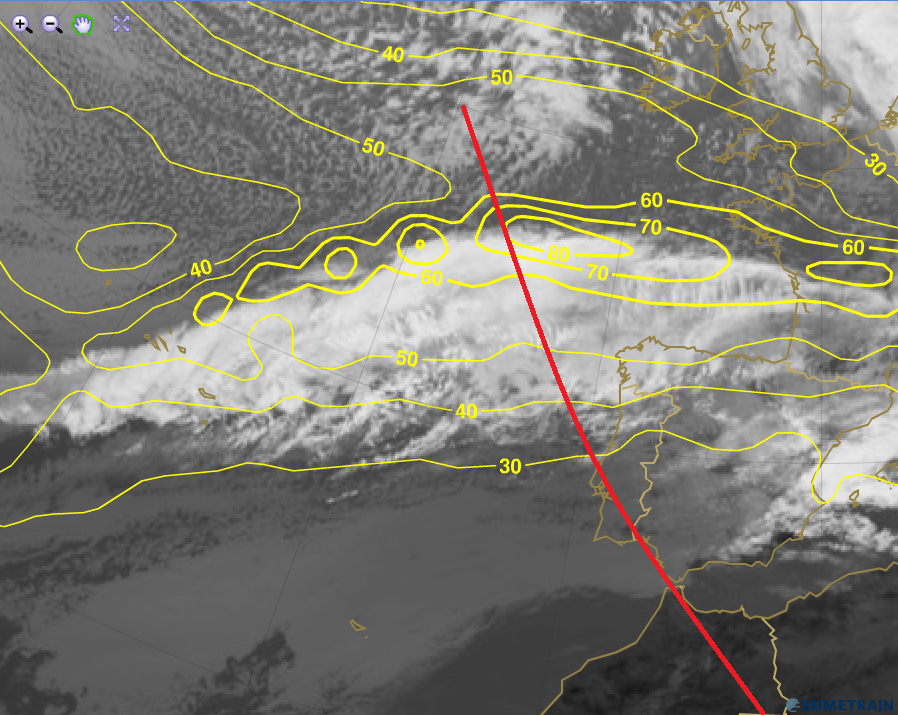
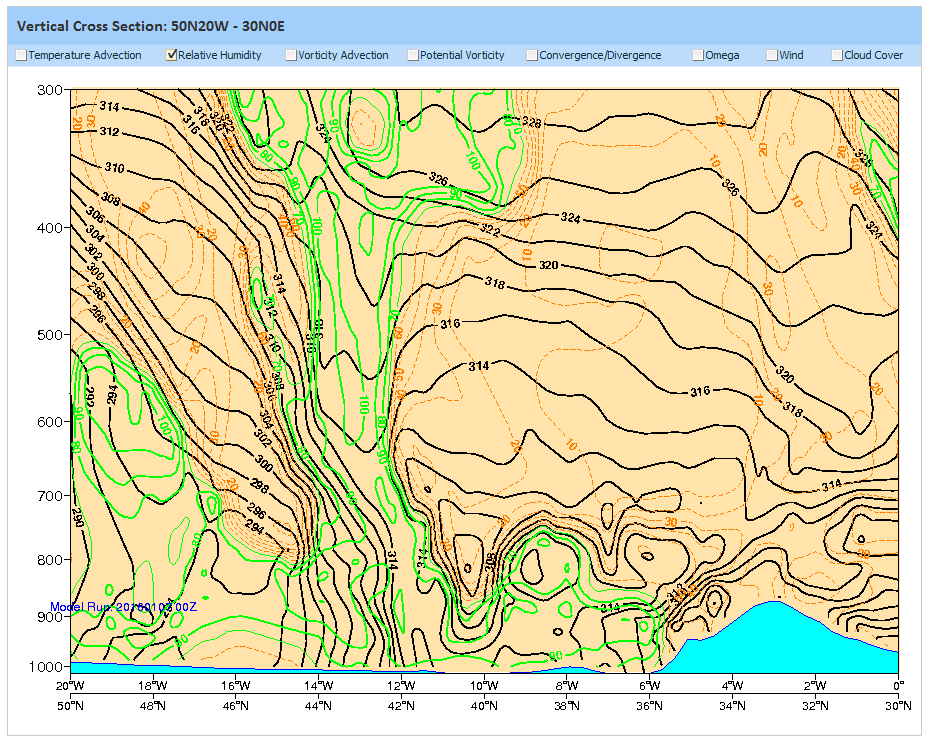
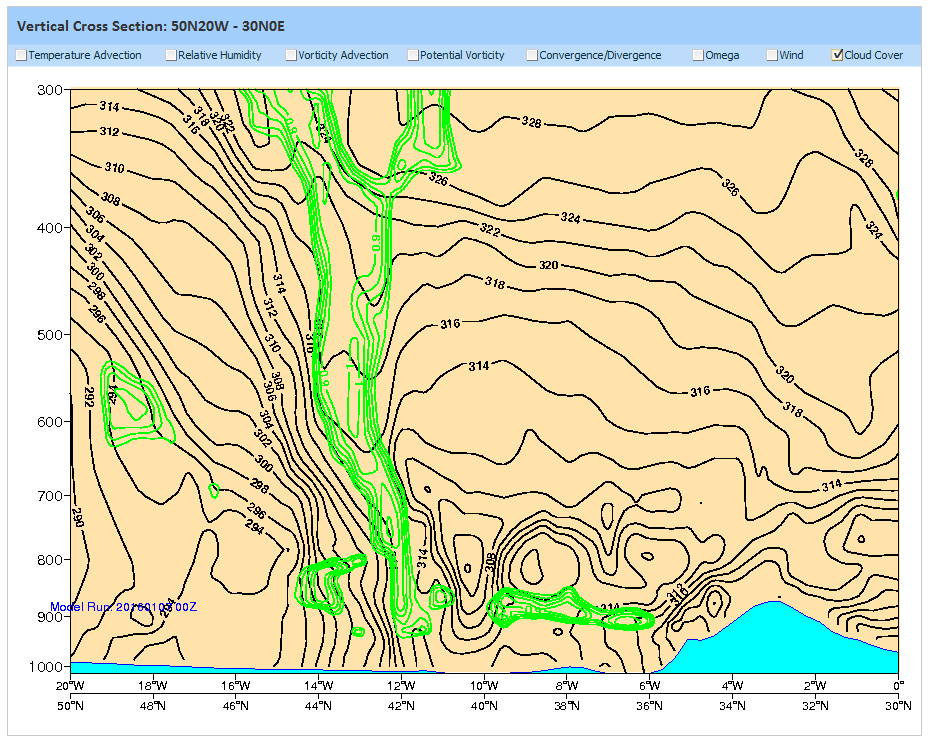
A vertical cross section (figure 6a-6d) through the cloud band west of Spain shows the frontal zone of a cold front. This pronounced cold front marks the transition from the polar to a warmer and more humid air mass. ECMWF cloud parameterization shows the presence of a broader zone of high level cloudiness (and humidity) ahead of the cold front above 400 hPa.
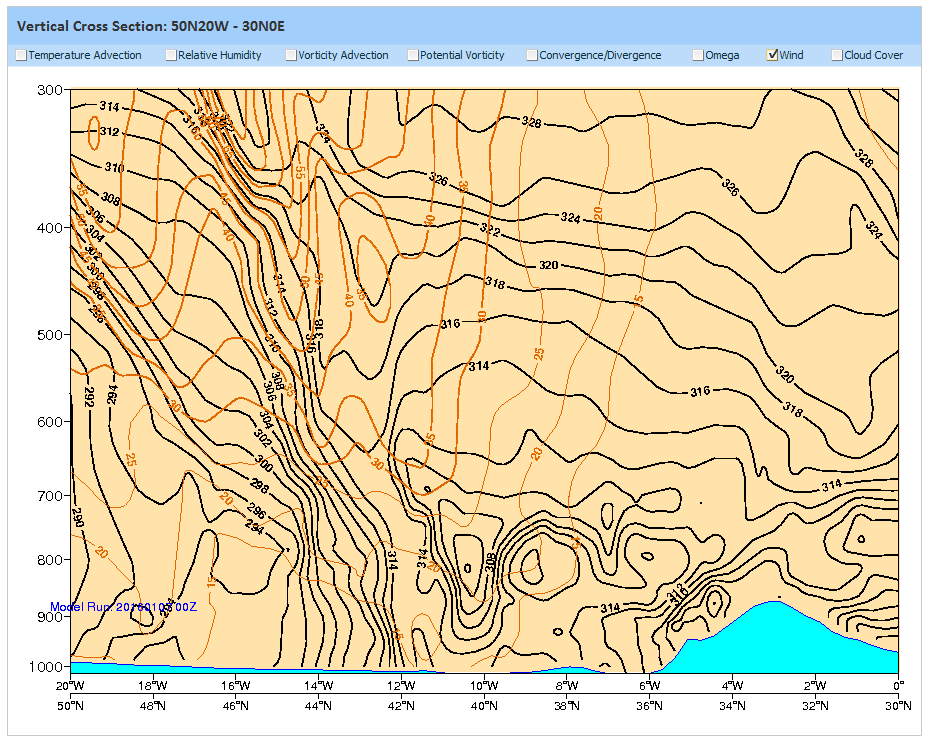
Figure 6a-6d: Vertical cross section through the cold front with ECMWF model data. The date is the same as in figure 5.
- Position of the vertical cross section (red line)
- Equivalent potential temperature (black) and relative humidity (green/brown)
- Equivalent potential temperature (black) and cloud cover (green)
- Equivalent potential temperature (black) and isotachs (brown)
The crowded isolines of the equivalent potential temperature in figure 6b-6d show the position of the cold front between 16W/46N and 12W/42N. The high values of relative humidity as a precondition for condensation are reflected in the model fields as well as the cloud cover seen in satellite imagery. The isotachs with a wind maximum around 300 hPa suggest strong vertical wind shear.
When relative humidity is near 100%, conditions are favorable for Kelvin-Helmholtz wave to become visible in satellite imagery (formation of ice crystals).


