4.5 - Applications
VIs are widely used to assess how environmental changes affect the distribution and dynamics of vegetation, particullarly at large temporal and spatial scales, and/or in areas of limited in situ data. In this chapter we will present examples of NDVI use to assess environmental consequences of DROUGHT:
- Vegetation stress
- Crop monitoring
4.5.1.Drought Monitoring
Drought and vegetation stress in Portugal 2004
The strong dependence of vegetation dynamics on water availability has been for long recognized in semi-arid regions (Gouveia et al. 2009). Under such conditions VI's can be used to identify areas prone to drought. However VI's must be used carefully. For example low values of NDVI indicate bare/low vegetated areas, but NDVI by itself cannot be considered a drought index since the concept of drought implies an extreme condition and a deviation from normal status. In terms of vegetation dynamics, a drought is an event that hampers the normal vegetation growth. In order to capture this effect, and to compare drought conditions in areas with different land cover, NDVI information has to be complemented with climatic information.
Next figure presents monthly NDVI anomalies for September 2004 - to - August 2005, defined as departures from the respective monthly medians. The latter statistics were obtained from NDVI time-series encompassing the September 1998 - to - July 2006 period, and derived from VEGETATION instrument onboard SPOT 4 and SPOT 5 (Gouveia, C. et al. 2009).
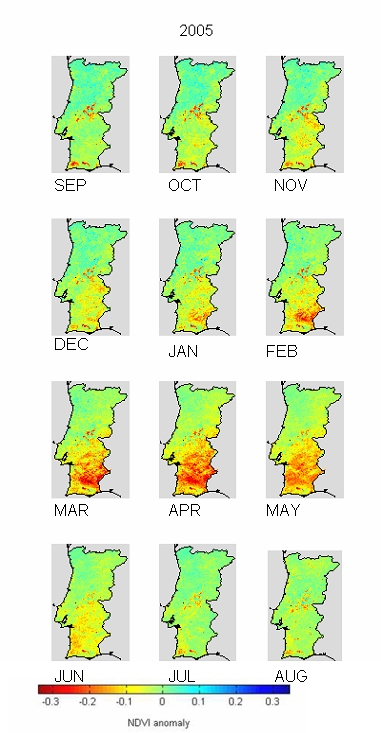
Figure 4.4: NDVI monthly anomalies between September 2004 and August 2005 derived from images acquired by the VEGETATION instrument onboard SPOT 4 and SPOT 5 (Gouveia et al. 2009).
(*) - During the summer season of 2005, Portugal was also hit by large wild fires. You can learn further details about this Fire event at the Forest Fires EUMETRAIN CAL Module
Drought and Crop production decrease in Kenya 2009
The amount of precipitation of Kenyas 2009 "long rains" season was well below the climatological average and also under the 2008 "long rains", which was also a dry year. The figure shows the MODIS NDVI 16-day composite for the period between Sep 14 and Sep 29 in 2007 (left panel) and in 2009 (right panel).
The figure shows the MODIS NDVI 16-day composite from Sept 14 until Sept 29 for 2007 on the left and for 2009, on the right.

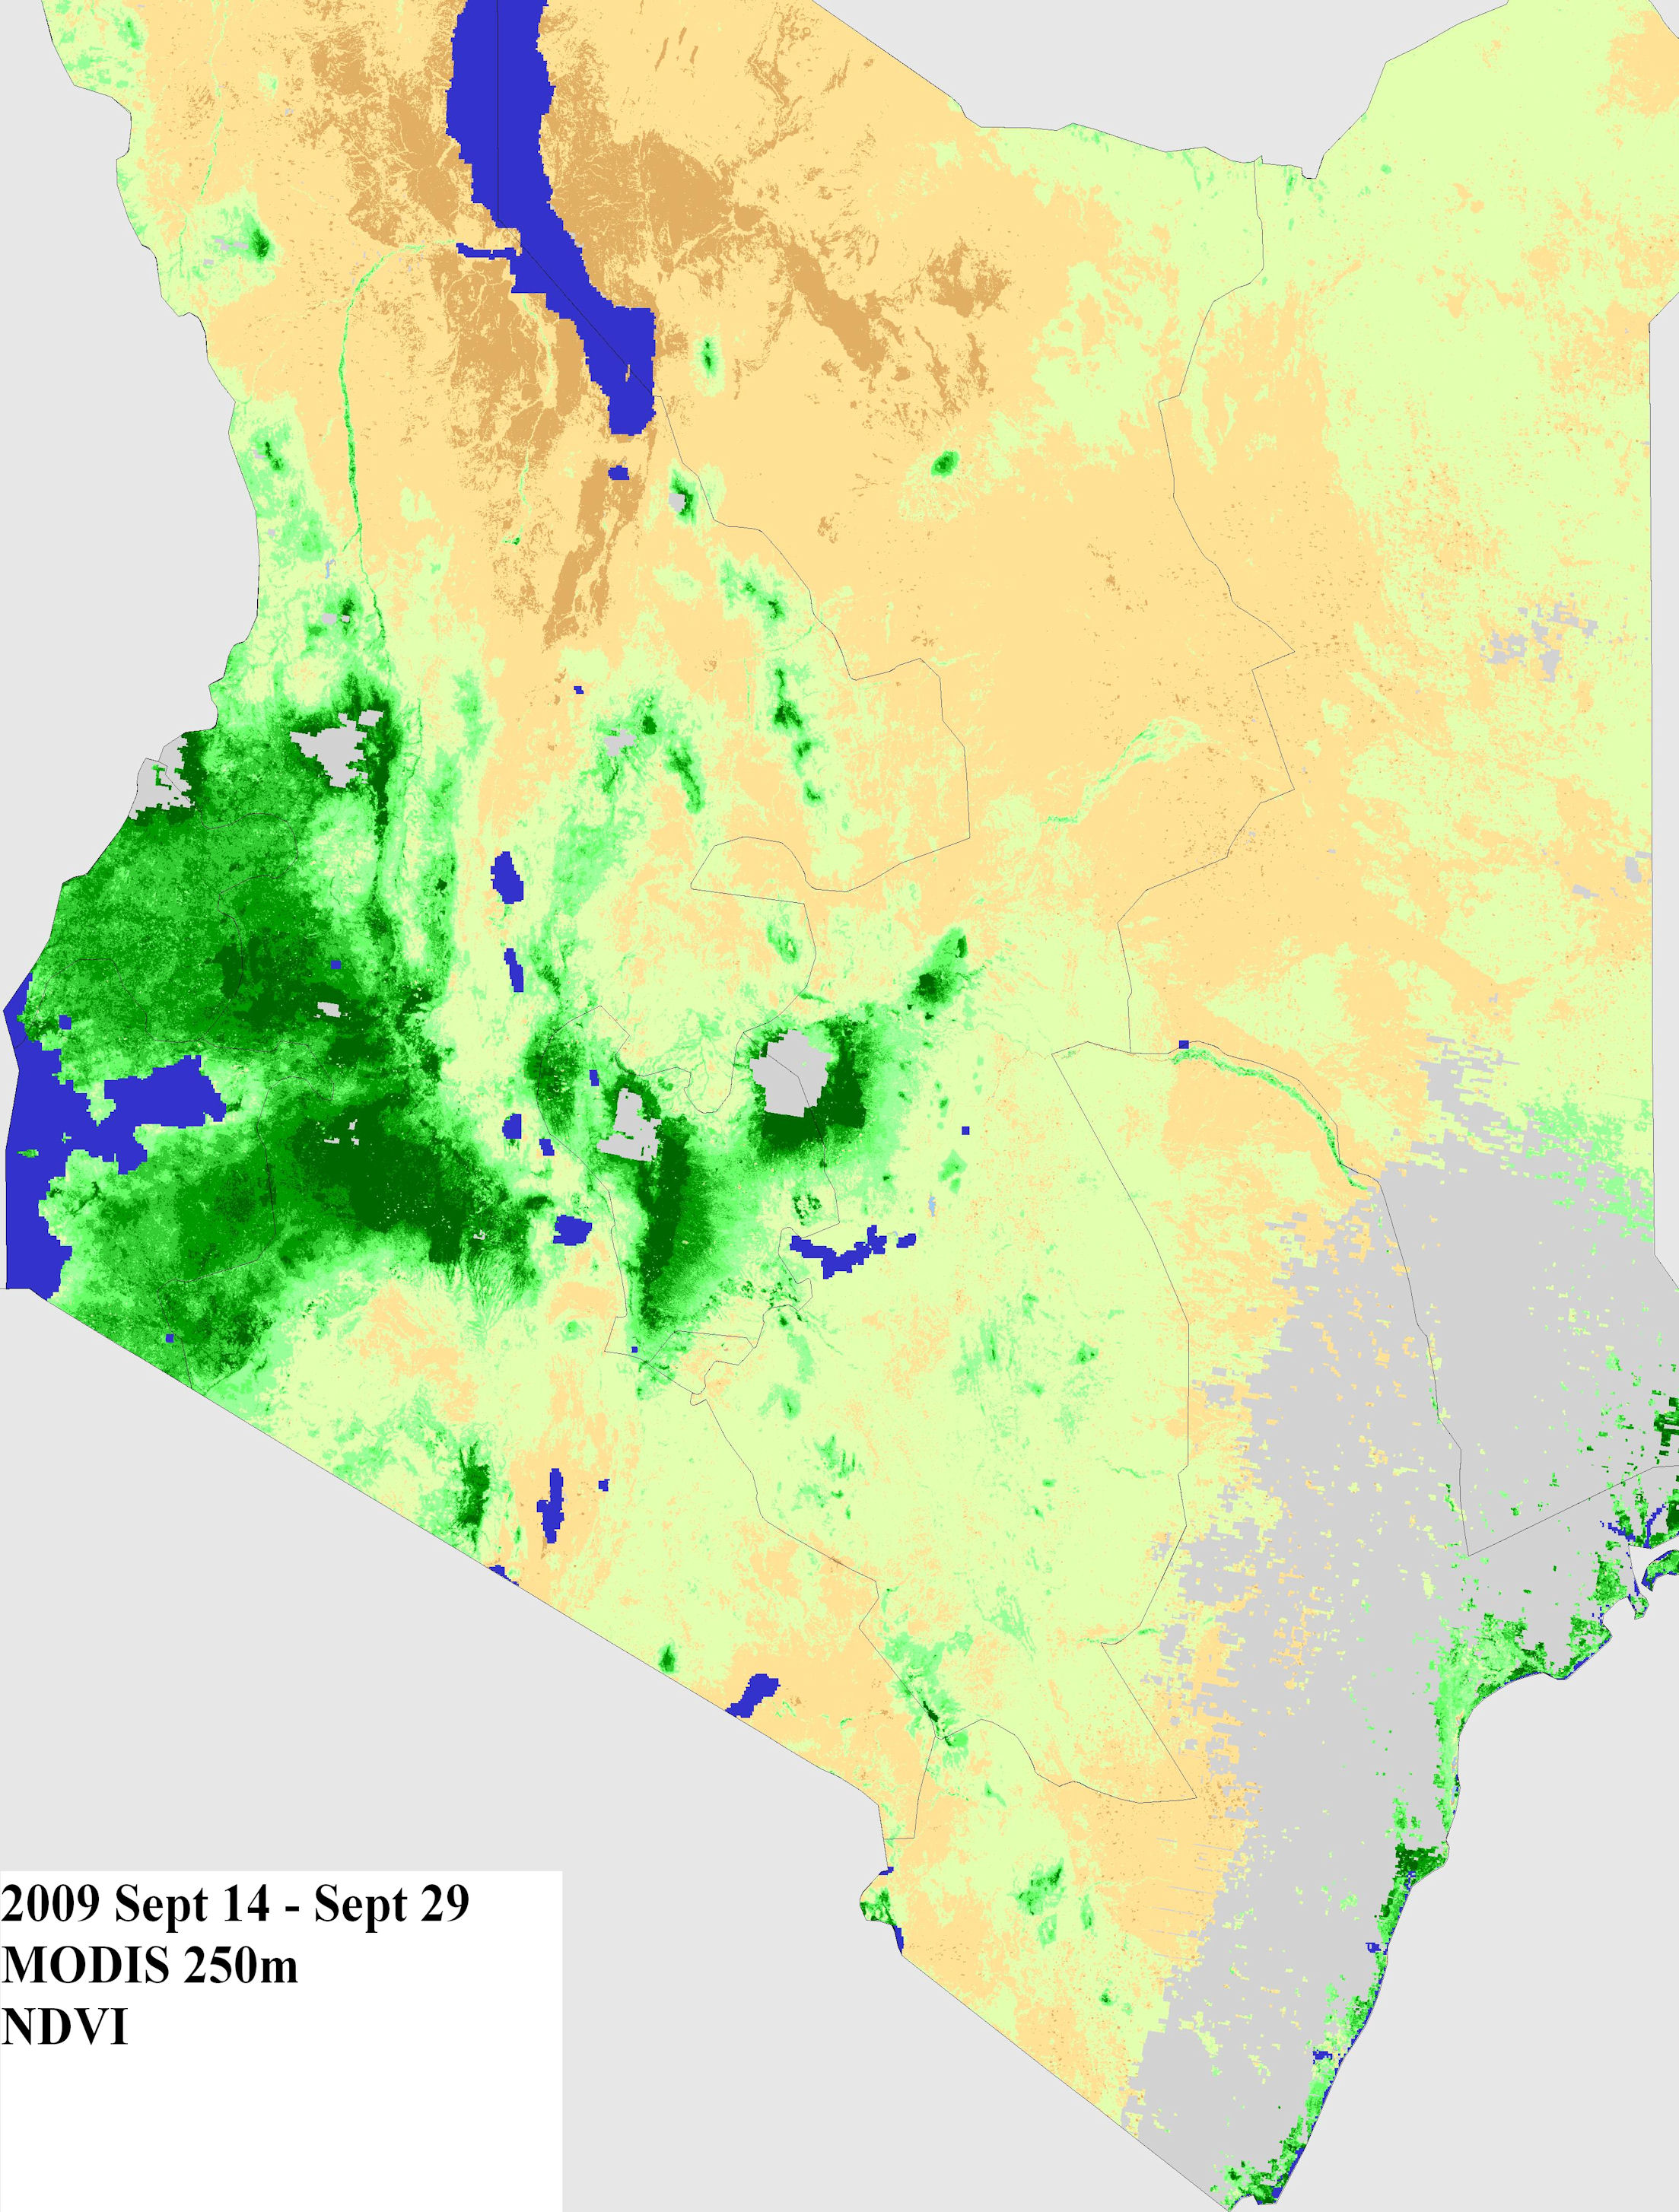

Figure 4.5: NDVI 16-day composite for Sep 14 - Sep 29 2007(left) and the same period in 2009 (right) derived from MODIS 250m spatial resolution.
The 2009 NDVI shows a dramatic decrease of vegetation dynamics when compared with 2007. Because NDVI correlates well with relative grain yields for most agro-climates in Kenya (USDA FAS - Commodity Intelligency Report, Dec 2009), the comparison of 2007 and 2009 NDVI suggests that the severe 2009 drought will reduce the Kenya's 2009 "long rain" corn yields. In fact USDA's Foreign Agricultural Service forecasted for Kenyas 2009/10 corn production 1.8 million tons, down 0.3 million tons compared to the previous year already poor crop and considerably less than the 5-year average of 2.6 million tons. We will return to this subject latter on this module section 5.9.3.