3.2 - Fundamental factors affecting vegetation reflectance
A typical reflectance spectrum of a vegetation canopy can be subdivided into 3 parts, visible (0.40 - 0.70 μm), near infrared NIR (0.701 - 1.3 μm) and middle-infrared (1.301 - 2.5 μm). Another optical property of the reflectance spectrum of vegetation is the abrupt transition between the strong absorption in the visible red and the strong reflectance in the NIR domain known as Red Edge.
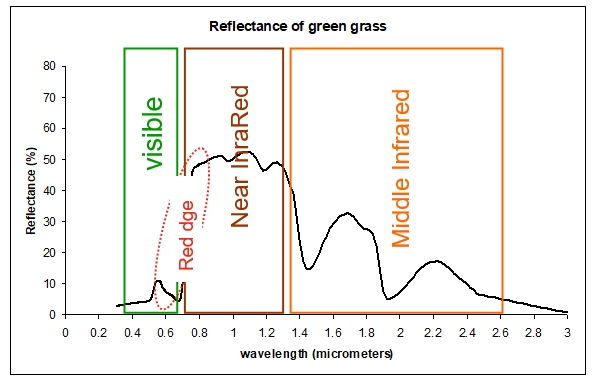
Figure 3.3: Reflectance spectrum of green grass subdivided into the 4 main optical properties of the reflectance spectrum of vegetation.
NOTE: The classification of the electromagnetic radiation used in this module is the most widely used in the vegetation community. The Visible is within the interval 0.40 μm - 0.70 μm; the Near Infra-red 0.701μm - 1.3μm and the Middle Infra-red 1.301μm - 2.5μm. Thus, in this module, channel 0.6μm is called Visible (VIS); channel 0.8μm - Near Infra-red (NIR) and 1.6μm - Middle Infra-red (MIR), instead of the classification used in the Satellite Meteorology community 0.6μm - Visible (VIS), 0.8μm - Visible (VIS) and 1.6μm - Near Infra-red (NIR)
3.2.1 - Visible region
The visible part of the reflectance spectrum (0.40 μm - 0.70 μm) of vegetation is controlled by the pigments in the green leaf chloroplasts that reside in the outer or Palisade leaf, the Chlorophyll pigments - chlorophyll-a and chlorophyll-b. A pigment is any substance that absorbs light. The colour of the pigment is determined by reflected wavelengths. White pigments/light colours reflect all or almost all of the energy striking them. Black pigments absorb all of the wavelengths that strike them. Chlorophyll is the major absorber of radiation in the visible region and its absorption is dominant in the visible red 0.6 - 0.7 μm - red wavelengths; it is called the green pigment and it is common to all photosynthetic cells. Other leaf pigments also have an important impact on the visible part of the spectrum. The carotene (yellow to orange-red pigment responsible for the colour of some flowers, fruits and leaves without chlorophyll) and xantophyll (responsible for the leaf colour in autumn) have strong absorption in the 0.35 - 0.5 μm, blue wavelengths.
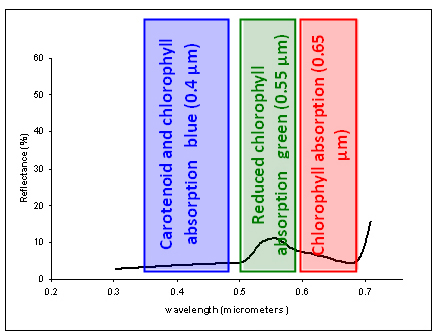
Figure 3.4: Reflectance spectrum for green grass, for VIS wavelengths.
Figure 3.4. shows a typical reflectance spectrum for green vegetation, for VIS wavelengths. Since absorption occurs in red and blue wavelengths, the predominant reflectance of visible wavelengths is concentrated in the green.
3.2.2 - Near infrared (NIR)
The optical properties in the near infrared spectral domain (0.701 - 1.3 μm) are explained by leaf structure. The spongy mesophyll cells located in the interior or back of the leaves reflects NIR light, much of which emerges as strong reflection rays. The intensity of NIR reflectance is commonly greater than most inorganic materials, so vegetation appears bright in NIR wavelengths.
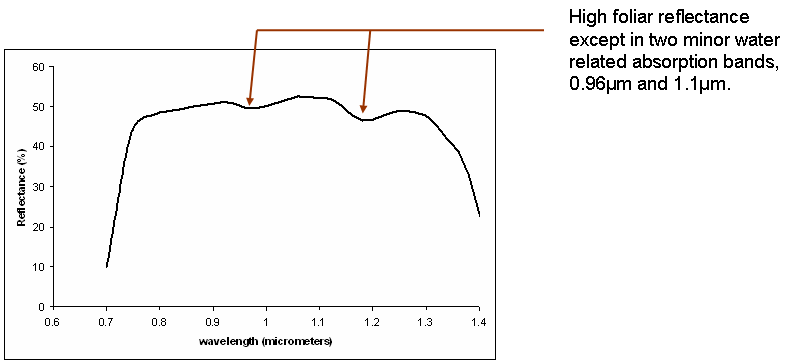
Figure 3.5: Reflectance spectrum for green grass, for NIR wavelengths
3.2.3 - The red edge
The red edge is a region in the red-NIR transition zone of vegetation reflectance spectrum and marks the boundary between absorption by chlorophyll in the red visible region, and scattering due to leaf internal structure in the NIR region. This transition zone is in the basis of several vegetation indices like NDVI which is the normalized difference between the reflectance in the red visible (0.6μm) and the NIR (0.8μm) reflectance. Also the red edge position (REP) is used to estimate the chlorophyll content of leaves or over a canopy.
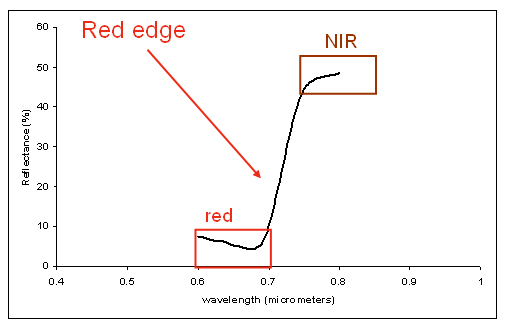
Figure 3.6: Reflectance spectrum for green grass, for the transition zone between VIS and NIR wavelengths- the Red Edge
The concept of Red Edge is on the basis of the most widely used vegetation index - the Normalized Difference Vegetation Index (NDVI). This index is the normalized difference between the NIR and the red VIS reflectance.
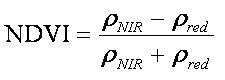
Where ρ NIR and ρred are the reflectance values for NIR and VIS (red) bands, respectively.
This combination of the strong absorption in the red visible and strong reflectance in the NIR is very specific of vegetation and allow us to distinguish vegetation from bare soil (see Figures 3.1. and 3.2). Calculations of NDVI for a given pixel can always result in a number that ranges from -1 to +1; however, for natural surfaces NDVI values are within the 0 to +1 range. An NDVI close to 0 corresponds to no vegetation, while NDVI close to +1 (0.8 - 0.9) indicates the highest possible density of green leaves. NDVI can be computed at the Top Of the Atmosphere (TOA) or at the surface, i. e. using atmospherically corrected reflectances for NIR and Red bands.
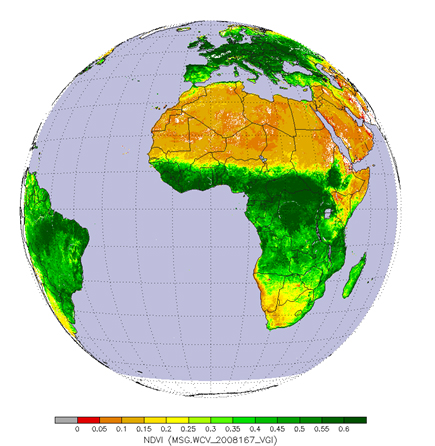
Figure 3.7: NDVI daily composite of SEVIRI full disk, June 15, 2008 (extracted from Yu,Y. et al. Development of Vegetation Products for U.S. GOES-R Satellite Mission, Presented on 4th Global Vegetation Workshop Univ. of Montana, Missoula, June 16-19 2009 )
3.2.4 - The middle-infrared region (MIR)
The middle-infrared region (1.301 - 2.5 μm) contains information about the absorption of radiation by water, cellulose and lignin and several other biochemical constituents. ( For further information see for ex. Curran,1989).
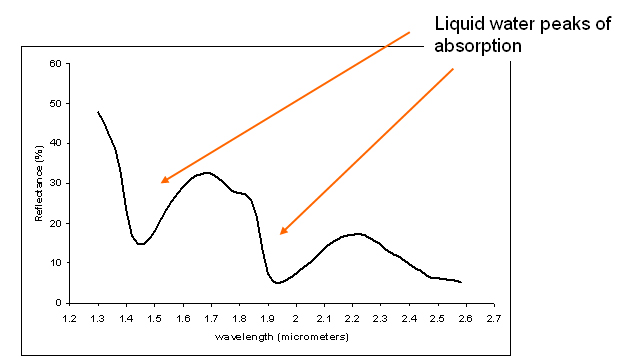
Figure 3.8: Reflectance spectrum for green grass, for MIR wavelengths
This region of the vegetation spectrum allows the identification of vegetation stress due to drought.