Chapter IV: Synoptic Applications of TPW Products
Table of Contents
- Chapter IV: Synoptic Applications of TPW Products
- Introduction
- Atmospheric Rivers - Horizontal Moisture Transport
- Heavy Snowfall Event in Slovenia and Southern Austria (30 January - 1 February 2014)
- Convection - Vertical Moisture Transport
- Example: 3rd August 2014
Introduction
Water vapour can be seen as the fuel which powers tropospheric processes. It can be transported over long distances across the planet and may release its latent energy when it condenses.
In the following chapters we will first have a closer look at the horizontal transport of water vapour within the Earth's troposphere with the help of TPW products and then investigate their benefits for predicting "moist" convection.
Figure 1: Morphed composite image loop of TPW (26 August 2014, 09 UTC to 29 August 2014, 08 UTC). Hurricane Cristobal moving north-east. Source CIMSS.
Atmospheric Rivers - Horizontal Moisture Transport
Atmospheric Rivers (AR), a term created at MIT in a paper by Zhu and Newell (1998), refers to the water vapour-rich part of the broader warm conveyor belt that is found in extratropical cyclones. The blended TPW product below (Figure 2) shows such an AR over the Atlantic. Because water vapour is transported in relatively narrow bands, the term Atmospheric River is quite descriptive.

Figure 2: The NOAA NESDIS operational blended TPW product. The red line circumscribes an atmospheric river heading towards Europe, 7 February 2014.
AR can be several thousand kilometres long but only a few hundred wide. Horizontal moisture transport combined with lifting processes often results in heavy precipitation events as will be shown in the next example. TPW products give complementary information on global repartition and origin of moist air masses and the way they are conveyed.
Heavy Snowfall Event in Slovenia and Southern Austria (30 January - 1 February 2014)
Initial Phase (29 January, 00 UTC - 30 January 12 UTC)
Figure 3: MSG SEVIRI IR10.8 µm loop (29 January 2014, 00 UTC to 30 January 2014, 12 UTC).
During the initial phase, we see the development and southward progress of a massive cold air outbreak over the Bay of Biscay and the Iberian Peninsula starting on 29 January. This is the starting situation for an exceptionally strong precipitation and snowfall event towards the end of January 2014 on the southern side of the Alps.
In the above satellite loop (Figure 3), we see the formation of a frontal system centered west of the Gulf of Genoa on 30 January. This kind of cyclogenesis is quite frequent during the winter season in this region and known by forecasters as having the potential to cause severe orographic rain or snowfall along the southern side of the Alps.
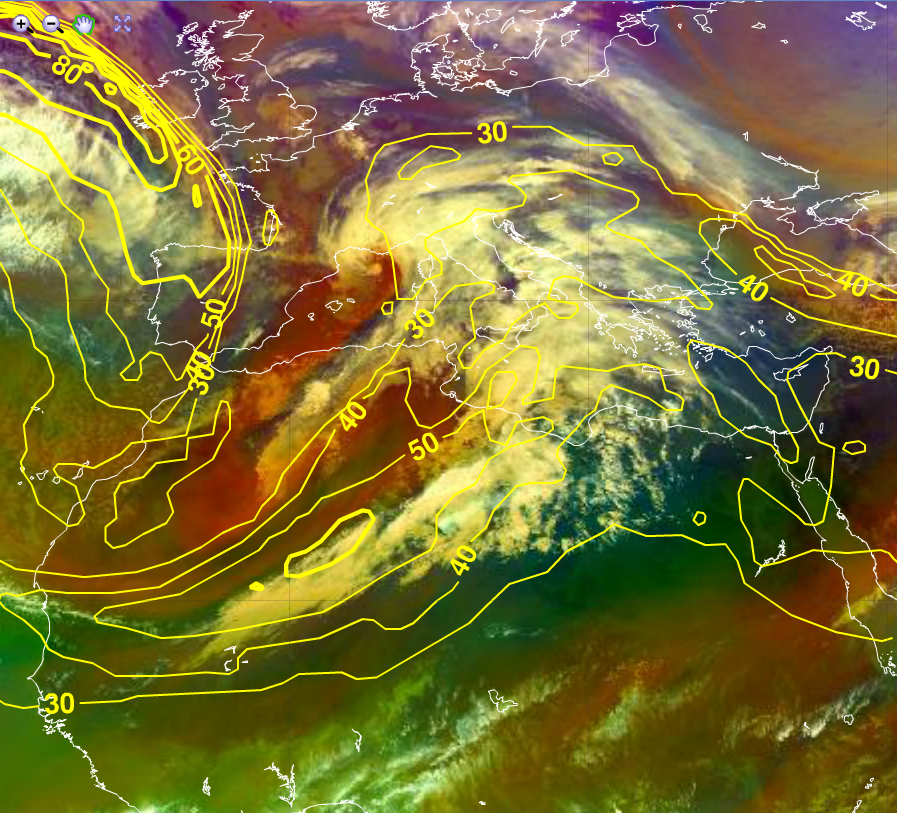
Figure 4: MSG Air Mass RGB with isotachs [m/s] at 300 hPa, 30 January 2014, 12 UTC.
As a consequence of the deepening of the surface low, the propagation of the system towards the east is slowed down. Moisture transport from the south towards the north increases with the strengthening of the low. Figure 4 shows a pronounced jet streak reaching from tropical Africa towards Italy. This impressive stream marks the upper limit of a moisture flow from moist tropical regions towards central Europe.
Culmination Phase (30 January, 13 UTC - 1 February, 23 UTC)
Figure 5: MSG SEVIRI IR10.8 µm loop (30 January 2014, 13 UTC to 1 February 2014, 23 UTC). The red line shows the batch of moist warm air causing high snowfall rates.
During the phase of maximum precipitation and snowfall activity, we can identify the rising warm and moist air masses over continental cold air over northern Italy, Slovenia and the southern part of Austria. The formation of a warm front is a clear sign for this process. On the first of February a second cold air outbreak over western Europe boosts the northward stream over central Europe.
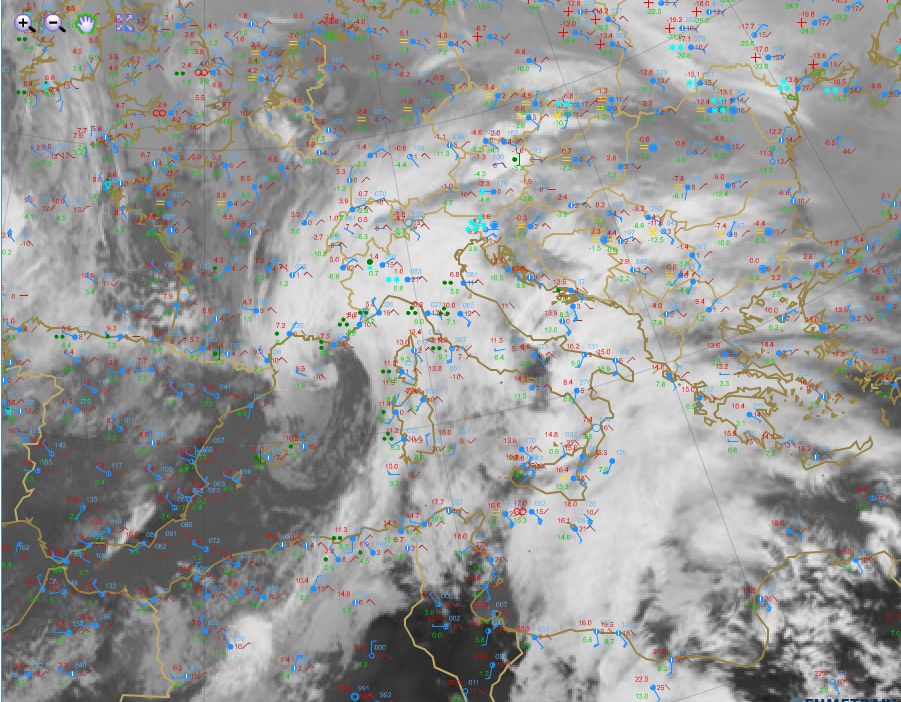
Figure 6: MSG SEVIRI 10.8 µm image and synoptic observations from 30 January 2014, 12 UTC. Click on the image to enlarge it.
The synoptic observations in Figure 6 show heavy rain from Sicily to northern Italy (green dots). In the high mountains of South Tyrol, Slovenia and Austria the precipitation comes as snow (cyan stars).The boundary between rain and snowfall can be identified in the 2 meter temperature chart (Figure 7).

Figure 7: The ECMWF 2 meter zero degree [°C] temperature isoline is depicted in magenta. Red isolines represent positive, blue isolines negative temperatures.
Initial Phase (29 January, 00 UTC - 30 January 12 UTC)

Figure 8: NOAA NESDIS operational blended TPW product loop (29 January 2014, 00 UTC to 30 January 2014, 12 UTC). The sketched red line delineates the southern extent of the trough.
In the initial phase, the operational blended TPW product shows the dry polar air mass (blue) extending from the British Isles far down to Morocco. On the eastern edge of the trough, we can see more humid air in cyan colours propagating towards the north. At this time of the year, the Mediterranean Sea hardly contributes to humidity due to low water temperatures. One may then wonder: where is the source of moist air bringing rain and snowfall to central Europe?
The above TPW product shows an easily identifiable region of moist air of tropical origins at the lower (southern) part of the image. As the cold air trough propagates very far into the south, cyclonic circulation taps into the reservoir of moist tropical air around and near the equatorial regions. The above TPW loop (Figure 8) shows a tongue of tropical air (green) advecting towards the north.
Figure 9: NOAA NESDIS operational TPW anomaly product loop (29 January 2014, 00 UTC to 30 January 2014, 12 UTC). The brown contour line shows the region of high TPW advected to the north.
The above TPW anomaly product loop (Figure 9) shows the cold and dry air propagating towards the south. Along its eastern part, we can identify a moist band with TPW values of about 150% above normal. The plume of tropical air over Africa, advected from the south, is well depicted towards the end of the loop exceeding values of 200% over normal.
Note
The region of moist tropical air identified in the absolute values of TPW (Figure 8) is not seen in the anomaly product (Figure 9) because the region around the equator is typically warm and humid at this time of the year. The TPW climatology used in the anomaly product tends to sweep this information out.
Culmination Phase (30 January, 13 UTC - 1 February, 23 UTC)
Figure 10: NOAA NESDIS operational blended TPW product loop (30 January 2014, 13 UTC to 1 February 2014, 23 UTC). The sketched red line delineates the propagation of moist and warm air towards the north.
From the initial phase on, we can identify a band of moist air along the eastern side of the cold air trough. During the culmination phase, the blended TPW product (Figure 10) shows a concentration of moist warm air (the moisture plume) emanating from the tropics and extending north along the eastern edge of the trough and heading towards Italy. The Mediterranean Sea's total atmospheric moisture (humidity) contribution to the overall moisture plume is much smaller than the one from tropical regions.
Figure 11: NOAA NESDIS operational TPW anomaly product loop (30 January 2014, 13 UTC to 1 February 2014, 23 UTC). The sketched brown contour line delineates the region of high TPW extending to the north.
The TPW anomaly product shows the propagation of moist air as it crosses the Sahara and the Mediterranean (yellow colours in Figure 11). This unusually high amount of TPW reaches the south face of the Alps by 1 February 2014. The advection of total atmospheric moisture is further enhanced by the approach of another cold front caused by a second cold air outbreak over western Europe. This approaching cold front can be tracked in the above loop as a band with unusually high TPW arriving from the west.
Addendum
The high amount of moisture being lifted along the south face of the Alps contributed to the extreme amount of precipitation. Moisture can be transported over long distances without changing its phase. The transition from sea level to elevated land or the forced lifting by orographic barriers may lead water vapour to condense when the air is near its saturation point.
This example shows that low level moisture can be transported over long distances and can be tracked easily by TPW products.
In this example, the rising of warm and moist air masses within the warm front, together with forced lifting by the Alps, led to extreme precipitation in Italy, Slovenia and Austria. Railroad connections were closed for several days and individual transport was difficult if not impossible on some traffic routes. Power lines were cut by trees falling on the lines under the weight of the snow.
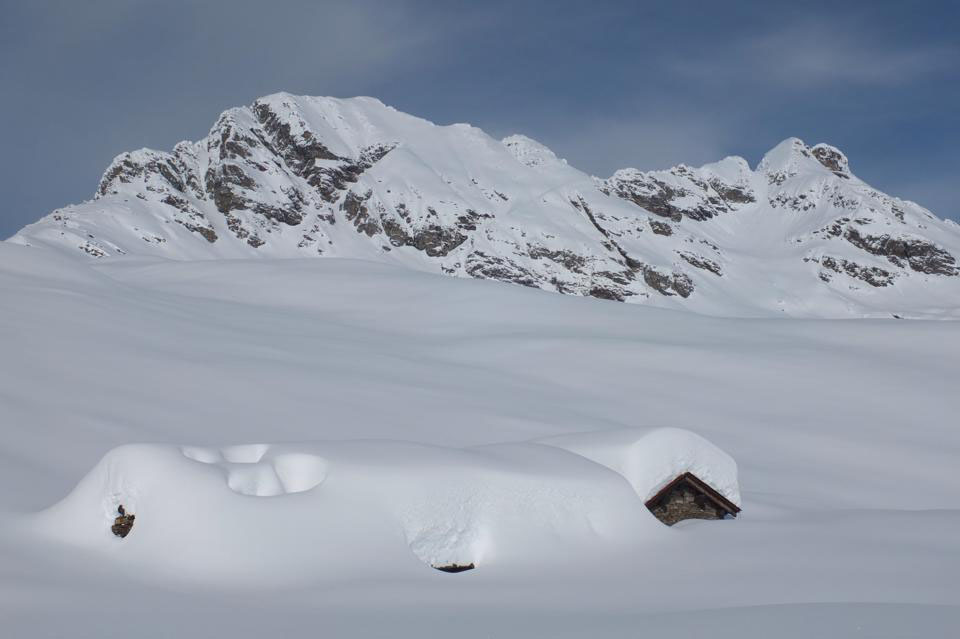
Figure 12: hoto of heavy snowfall in the Alps (Credit: L Silvanti, MeteoSvizzera)
Figure 13 shows the 24-hour accumulated precipitation from 06 UTC on 30 January to 06 UTC on 31 January 2014. The highest amounts of precipitation can be found in the tri-border region of Italy, Slovenia and Austria. Note the strong gradient parallel to the mountain crest.
Figure 13: Accumulated Precipitation [mm] over 24 hours (30 January 2014 to 31 January 2014, 06 UTC) by the Nowcasting System INCA.
As a result of the high amount of snowfall in the Alps, the risk of avalanches rose in the following days (Figure 14). Heavy snowfall combined with strong wind often increases the avalanche threat.
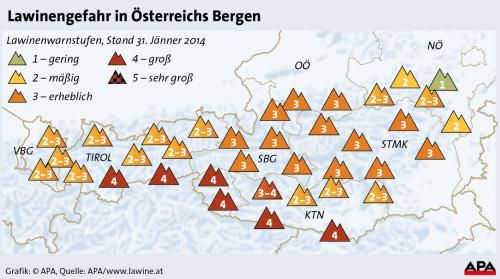
Figure 14: Avalanche risk for the region of the Austrian Alps reaching from 1 (low) to 5 (very high) for 31 January 2014.
Convection - Vertical Moisture Transport
As mentioned earlier, TPW products are often derived together with stability parameters. The vertical distribution of humidity and temperature needed to derive the TPW content also serves for deriving atmospheric stability.
Traditionally, stability indices are derived from temperature and humidity soundings by radiosondes. Vertical profiles provided by satellite instruments can fill the temporal and spatial gaps between radiosonde measurements.
Stability parameters and TPW products to forecast convection
TPW and stability parameters from geostationary satellite data over land and seas can be derived in cloud-free regions only. Satellite-derived stability indices are used to predict convection. To learn more about the GEO satellite stability product GII see: Global Instability Index.
Dry convection may start as soon as the ground heats up during the day and temperature stratification permits the vertical shift of air masses. Dry convection may also lead to strong winds caused by the relocation of air, but it seldom results in severe weather conditions. This changes drastically when humidity and condensation processes are involved as the release of condensation heat boosts the tropospheric processes.
Therefore, the intensity of severe thunderstorms depends on the moisture supply available to sustain convection. The preconditions for thunderstorms are given by tropospheric stability parameters, while the magnitude or severity of the event largely depends on TPW.
Water vapour imagery often provides a good estimate for convective initiation (see CAL on WV imagery). In cases with strong moist advection from the south, a sharp gradient of TPW on the western edge of the band with the highest moisture coinciding with a moisture gradient in a water vapour image can be a strong indicator of potential for heavy precipitation. Sharp or tight gradients make for particularly strong indicators. This gradient can also be applied to other GOES Sounder instability products like LI for pointing out areas with potential for severe weather. The gradient is typically located in an area between a baroclinic boundary and an upper level trough. It lies between the minimum and maximum values of TPW, possibly slightly toward the highest values of TPW and/or the most unstable area (highest negative LI's, for example).
Note
Neither stability nor TPW can predict the exact location of a thunderstorm. Convective initiation depends on several factors that either favor or inhibit lifting processes, such as orography, the general synoptic situation, wind and wind shear, capping inversions, etc.
Example: 3rd August 2014
Introduction
The selected case demonstrates the benefits of the GEO TPW product together with the GII analysis. The satellite loop below shows the development of convective cells on 3 August 2014 in hourly steps.
Figure 15: MSG SEVIRI 10.8 µm loop (3 August 2014, 00 - 23 UTC)
The current EUMETSAT GII product is aimed at helping forecasters to turn their attention to a certain region, which they can then monitor more closely with other means over the next several hours, such as satellite imagery, radar and lightning data. The MSG GII data have proven to provide lead times between 6 and 9 hours.
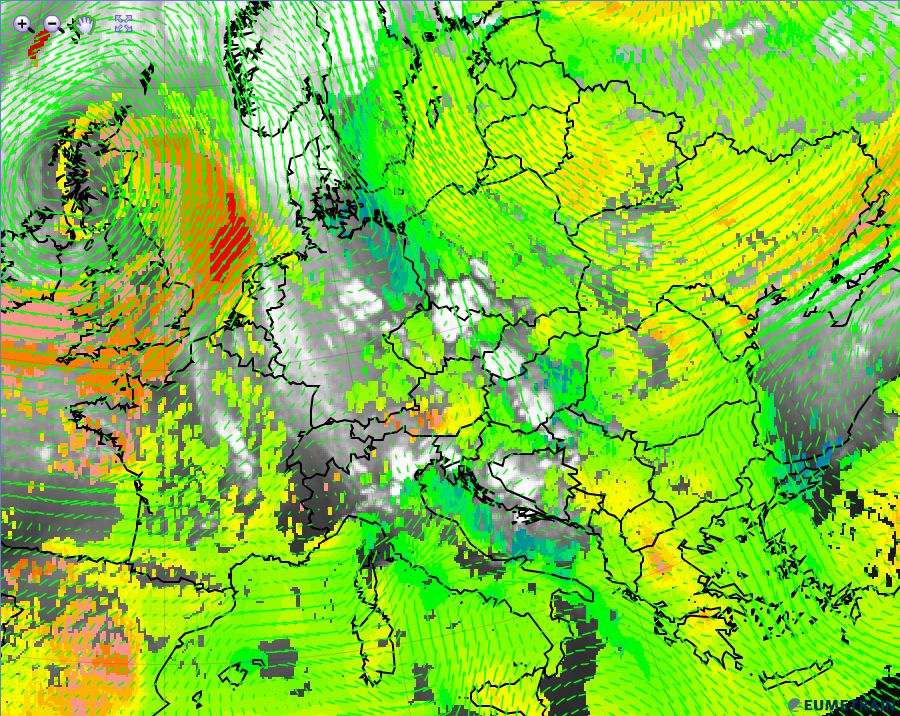
The synoptic situation over Central Europe on 3 August 2014 is characterised by weak pressure gradients near the surface and the absence of frontal zones. A low pressure system over the Irish Sea has only marginal influence on weather in Central and Eastern Europe.

Figure 16: MSG SEVIRI IR 10.8 m image with ECMW surface pressure in hPa(black) and 500 hPa geopotential height in decameters (green) on 3 August 2014, 06 UTC.
The next chapters will show the evolution of convection in the different regions of Europe on 3 August 2014 for 06, 12 and 18 UTC. A closer look will be given to both, the GII (Lifted Index) and the TPW product.
Convection hot spots can already be found at the beginning of the day in some regions of Europe (France, Italy and Scandinavia). More severe convection was expected with the ground warming up during the course of the day.
To give an answer to the question which regions in Europe present a favourable environment for the development of severe thunderstorms in the next 6 to 9 hours, we should have a look at the Lifted Index (LI) and the TPW product.
 |
 |
 |
 |
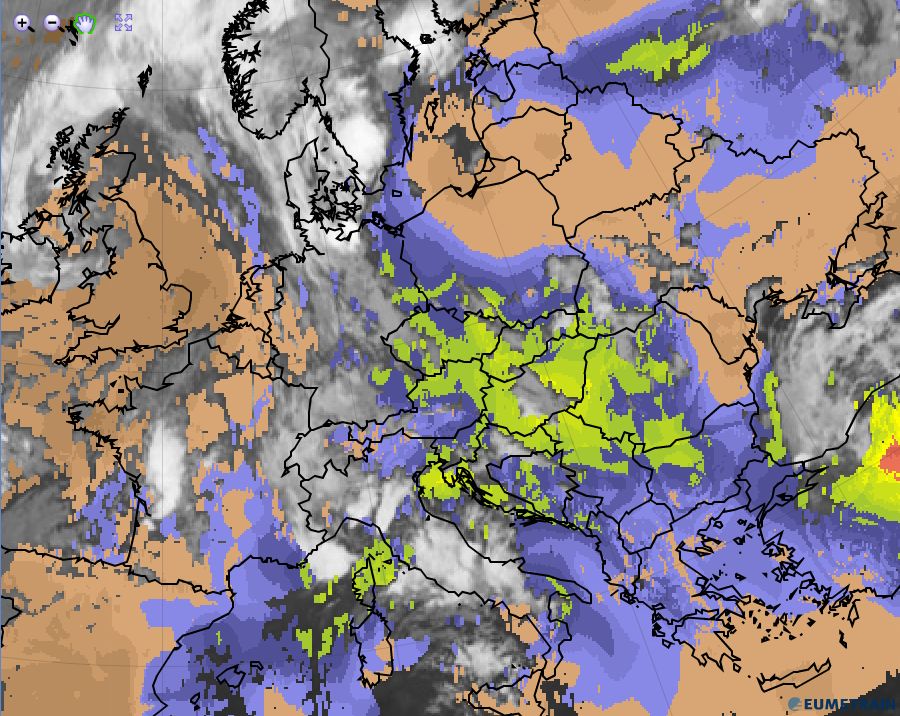
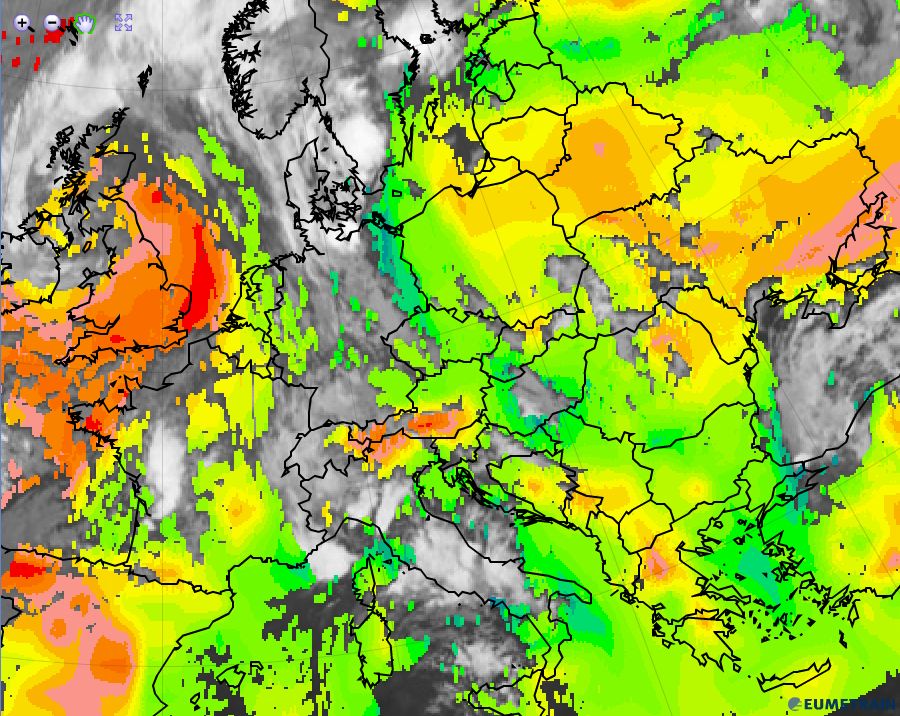
Figure 17a-17d: IR 10.8 µm with GII product (top left); IR 10.8 µm with TPW product (top right); WV 6.2 µm with TPW product and 850 hPa model wind (bottom left); Severe Storm RGB (bottom right) for 3 August 2014, 06:00 UTC. To enlarge an image, press on it.
Figure 17a:
Apart from the seas around Italy, where active convective cells can be found as early as 06 UTC, there is a broad line with low LI values (reflecting unstable air masses) that stretches from South Sweden to Greece. This line's lowest values reach from the Czech Republic and eastern Austria to Romania and Serbia. We can also observe an extended stable area over the British Isles (center of the low) and another one reaching from the Baltic States to the Black Sea.
Figure 17b:
The GEO TPW product at 06 UTC shows a high amount of precipitable water in the region corresponding to the lowest LI values. Hence, we can expect that once convection initiates in the instability band reaching from southern Sweden to Greece, the high amount of water vapour (moisture) would be readily available to produce heavy rainfall. Of special interest is a region in the eastern Alps (South Tyrol and southern Austria) with very low TPW values right in the middle of high TPW values and surrounded by active convective cells. As this minimum of TPW is not reflected in 6.2 µm WV images, the relatively low amount of moisture results from the elevated terrain.
Figure 17c:
The wind field at 850 hPa shows the advection of dry continental air from the Ukraine towards the Baltic States and Poland where we can observe a pronounced TPW gradient (red line).
Moist and warm air is advected from the Mediterranean Sea towards Italy where MCSs form when the moist air comes over land. The air stream is blocked by the mountain range and turns to parallel the Alps (blue arrow); the dry region in the south-eastern part of the Alps shows little or no wind. There is a high pressure zone at ground level (figure 16) right at the location of the TPW minimum. This high pressure zone seems to originate from the blocked air stream towards the southern flank of the Alps. An inversion at lower levels (figure 19, next chapter) combined with rather small wind speeds makes the southerly wind follow the Alps.
Figure 17d:
The Severe Storm RGB depicts the hot spots of convective activity at 06 UTC:
- Western France
- Italy
- South Scandinavia
The yellow-orange colour within Scandinavian MCS is a sign of high activity in contrast to the more reddish cells over Italy.
Summary:
At 06 UTC, satellite data shows ongoing convective activity over large parts of Europe. The GII image shows a wide region of instability with high TPW values reaching from southern Scandinavia to Greece. In contrast, dry air masses can be seen in TPW images extending east from Poland and over the southeastern Alps, Greece and Spain.
According to LI and TPW data at 06 UTC, convection is expected to extend over eastern Europe (moist and unstable region), while it should be suppressed over eastern Poland, Belarus and Ukraine and in a small window south of the Alps due to limited water vapour supply.
At 12 UTC we see the development of large convective cells (MCS) in the area indicated by LI and TPW 6 hours before (south-west Poland to Hungary). The IR-loop (figure 15) shows decaying convective cells in the Alpine region where low TPW values were identified. While mountains usually trigger convection, neither wind (blocking), neither stratification (inversion) nor available water vapour acts in favour of convection.
 |
 |
 |
 |
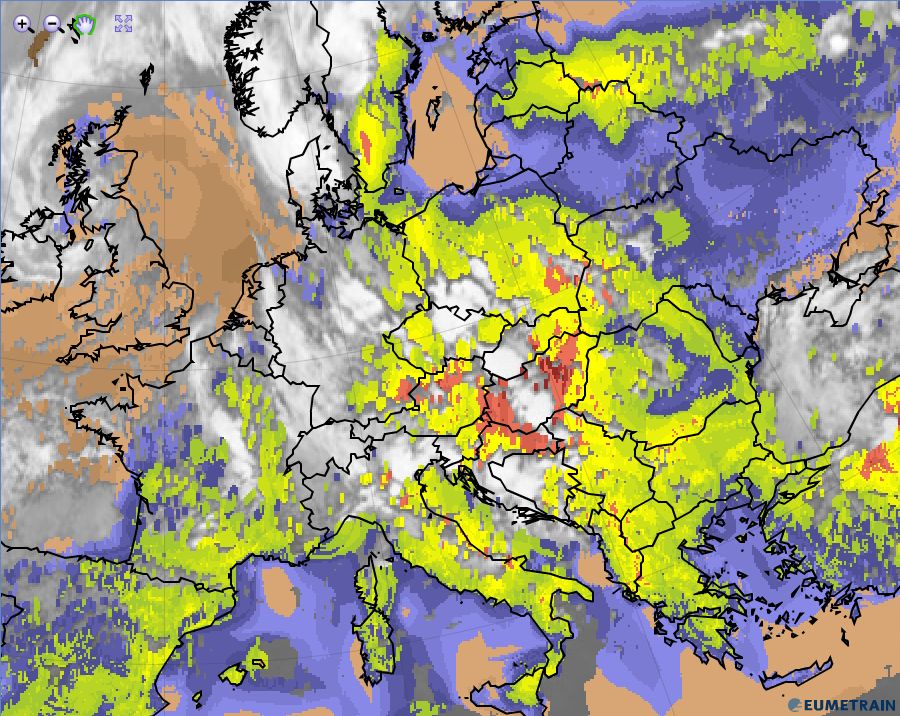
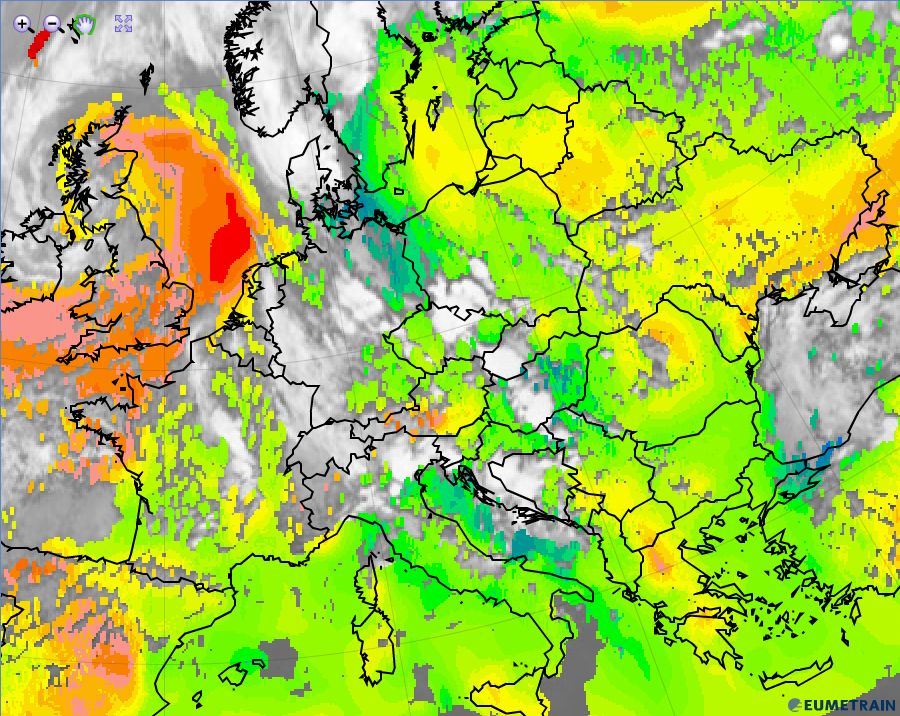
Figure 18a-18d: IR 10.8 µm with GII product (top left); IR 10.8 µm with TPW product (top right); WV 6.2 µm with TPW product and 850 hPa model wind (bottom left); Severe Storm RGB (bottom right) for 3 August 2014, 12:00 UTC. To enlarge an image, press on it.
Figure 18b:
While the LI product shows unstable stratified air masses over Spain and Greece at 12 UTC, the TPW field is very similar to the one at 06 UTC. TPW values are low in these regions and therefore can inhibit the development of thunderstorms.
Low TPW values match the rather stable region (Baltic States to Ukraine). In the small Alpine area with dry air, convection is damped and the transgressing convective cells seem to weaken (see Figure 20).
Figure 18c:
The convective line (Poland to Hungary) is well reflected in WV imagery at 6.2 µm.In the Alpine region we still see a cloud window with very low TPW values. While model winds at 850 hPa indicate a mountain overflow, the satellite loop still shows a bypassing of the flow. Radiosonde data from Udine (Figure 19) shows a capping inversion at 800 hPa. Convection concentrates over northeast Italy, Slovenia, Croatia and Montenegro.
Figure 18d:
The Severe Storm RGB shows intense convection over the following regions:
- South Scandinavia
- Germany
- France
- Poland to Hungary
- North of the Adriatic Sea (Italy to Montenegro)
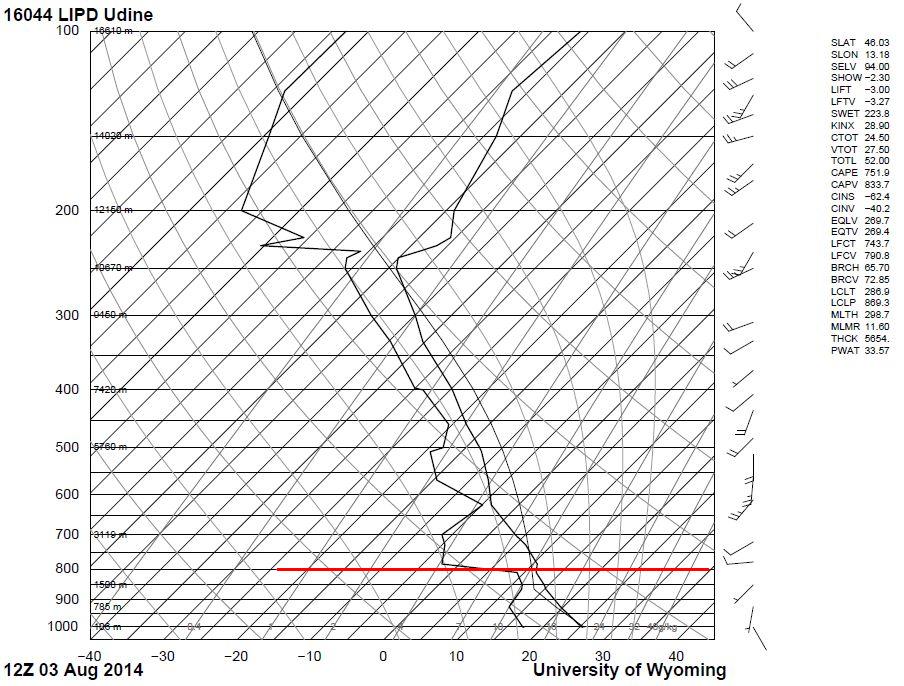
Figure 19: 12 UTC radiosonde data from Udine (NE-Italy) station (3 August 2014). The red line marks the inversion height.
Summary:
At 12 UTC, the LI product shows wide spread instability over the European continent. Nevertheless, the availability of water vapour (TPW) sets limits to the development of convection in some regions.
In the Alpine region, blocking, inversion and low TPW values lead to the inhibition of thunderstorms as can be seen in the cell track image (Figure 20).
For completeness it should be mentioned that many variables contribute to initiating and intensifying convection, which can lead to heavy rains. Likewise, there are many variables that can inhibit cloud formation or convective development. Forcing mechanisms are also very important. Example mechanisms include negative LI values, jet interaction, vorticity advection (small comma clouds, for example), diffluence, deformation, etc.
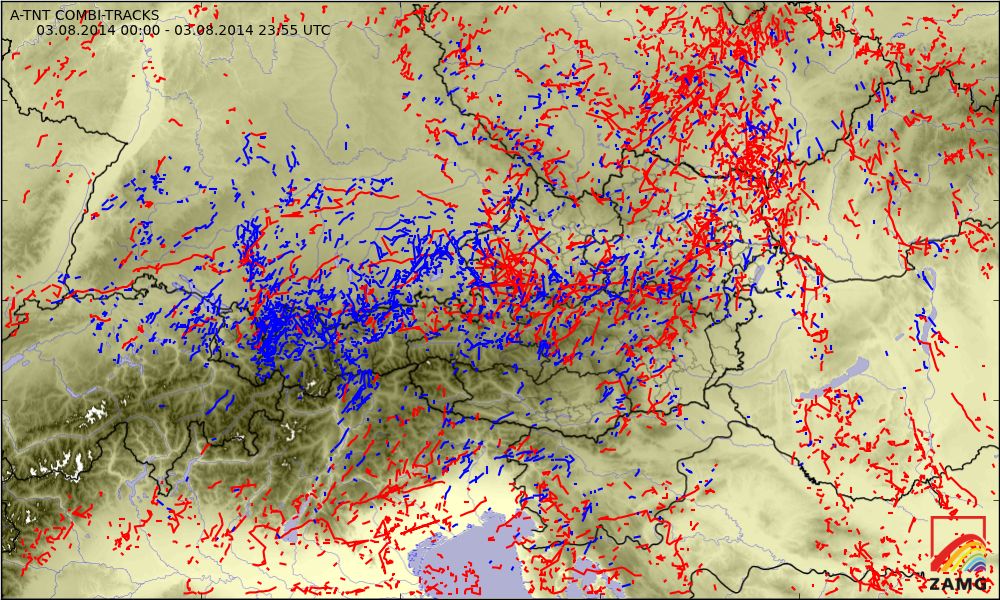
Figure 20: Convective cell tracks from Radar and lightning data for 3 August 2014. Red lines represent cells with confirmed lightning, blue tracks represent cells with rain only.
The late afternoon and evening hours usually mark the peak of convective activity and the time when convection forecasts issued the previous morning are verified.
Figure 21: IR 10.8 µm satellite image from 3 August 2014, 18 UTC and 5 minutes interval lightning data superimposed.
Figure 21 shows lightning activity over central Europe on 3 August 2014 at 18 UTC. The area of instability derived from the LI image and TPW product provided a good forecast for the regions where convective activity actually developed during the day
On the other hand it also showed where the development of thunderstorms was suppressed by a relative minimum/low TPW. Those regions remained largely free of convection all day long though air masses were or became unstable.
-
The region from the Baltic States to the Ukraine:
Dry, stable air was advected continuously from Russia. Although stratification became unstable in the course of the day, major convective cell did not develop. -
Spain and Greece:
While Greece already showed negative LI values at 06 UTC, both regions showed low TPW values and remained free of convection. Increasing instability at 12 UTC did not lead to convection in the afternoon. -
Alpine region (South Tyrol and southern Austria):
This small area in the eastern Alps was probably the most interesting region during this day. Although surrounded by intense convection, it remained largely free from convective activity. This can be seen in figure 22, where the IR image depicts a cloudy but not convective sector. In this case, low TPW values may have resulted from the higher terrain, and the low TPW values may have been one factor inhibiting convection, though probably not the main one. It is possible that a larger impact on convective inhibition came from the broken to overcast cloudiness - remnants from the previous evening's convection - which did not clear much throughout most of the day.
Figure 22: IR satellite image from 3 August 2014, 18 UTC and 5 minutes interval lightning data superimposed. The red line contours the region with low TPW values and inhibited convection.
Conclusion:
In this case the combined use of stability parameters and the TPW product was helpful for predicting areas with convective development.
Among the multitude of factors influencing convective initiation, the availability of sufficient moisture to sustain convection is one of the crucial ones. In this case satellite-derived TPW products were certainly a useful tool for forecasters. However, other factors that may have an effect on TPW have to be considered as well: on one hand, instability parameters like LI, and on the other, shortwave forcing, diffluence and deformation depicted in satellite images and loops.
Note
Neither TPW nor LI are an indication of inhibited or strengthening thunderstorm development by themselves. Any such development will involve a complex balance of both factors; both TPW, LI and their trends need to be taken into account.