Introduction
The storms, which occurred on August 15th 2010 in parts of central and eastern Europe, were interesting from many aspects, some of which are described briefly below. Given the highly variable appearance and characteristics of these storms, this date was selected as the second CWG golden case, to be examined in detail and to be used for testing various convection-related algorithms.
This case initially attracted our attention because of the severe hailstorm in Prague in the early evening, which caused an estimated 180 million EUR damage to property in less than one hour. This alone would not be a reason for focusing on this case; the main reason was the appearance of this storm's cloud top. From the MSG satellite perspective the storm could haveeasily been overlooked due to its relatively warm cloud top and small size, as seen in the 19:00 UTC IR10.8 BT image. The Prague hailstorm, indicated in the MSG image by a red arrow, shows up much better in the NOAA17 AVHRR band 4 image, scanned exactly at the same time. In this NOAA17 image, the left panel shows the storm using the standard IR-window BT enhancement (200-240K), which shows a cold U-shaped pattern in the cloud tops, despite the overall warm temperatures. This well-known indicator of possible storm severity shows up much better in the right panel, which uses a shifted temperature range of the BT enhancement, 250-215K. It will be interesting to see how this storm is interpreted by various SAFNWC products (due to its warm cloud-top temperature). A time-lapse movie of the storm's passage above Prague can be found here. Whether this storm was a supercell or not remains (at the time of writing this Introduction) unclear.
The evolution of that day's storms above central and eastern Europe can be followed with the following Meteosat-8 Rapid Scan animations:
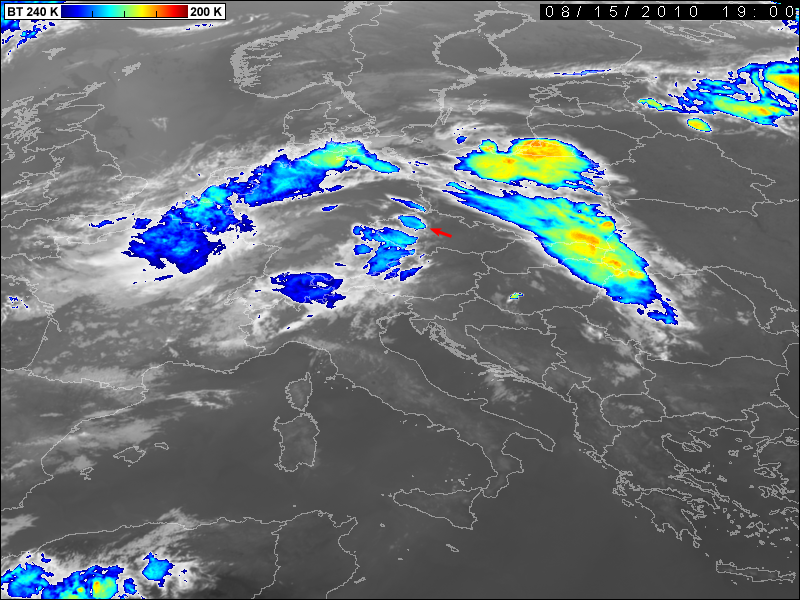
Figure 1: Meteosat 8 RSS - Enhanced IR10.8 BT (standard color enhancement)
Meteosat 8 infrared 10.8 μm is shown, but the images have been artificially color enhanced using the color scheme from blue to turquois to yellow to red, applied over fixed intervals between the temperatures 200 and 240 K. This will improve the discrimination of where most ice particles are formed during the several convective stages. The rapid scan satellite images are presented in a sequence of 5 minutes.
Figure 1: Meteosat 8 RSS - HRV (downscaled to the same size/resolution as all the other loops)
This chapter will show the HRV images of August 15th. The high resolution channel allows for very good monitoring of the convective development in smaller scale cells in particular. The satellite images are presented and described in a 15-minute sequence. Try to focus on subtle signals such as overshooting tops (which cast shadows) and V-shaped storms.
Figure 1: Meteosat 8 RSS - WV7.3 (black and white)
The WV7.3 provides information about the moisture of the lower layers of the troposphere. Convection is likely to occur in areas with low static stability. In these areas there is warm (and relatively moist) air in the lower troposphere, with cold (and drier) air above.
Figure 1: Meteosat 8 RSS - Airmass RGB
The key to this RGB is that the brightness temperature difference (BTD) of the two water vapour channels 6.2 and 7.3 is shown in red, the BTD of the infrared channels 9.7 (Ozone channel) and 10.8 are shown in blue, and finally the WV channel 6.2 is shown in green.This channel combination is used to identify different airmasses. Polar and tropical airmasses are pictured in blue and green, respectively.
Figure 1: Meteosat 8 RSS - Severe Storm RGB
The Severe Storm RGB makes use of the NIR1.6 and IR3.9 μm channels. Both of these channels provide information on the microphysics within the clouds. For example, with this RGB we are able to discriminate between smaller and larger ice particles. This is useful for detecting convection. Cells that are bound to severe updrafts will likely be characterised by smaller ice particles, as there is less time available for the ice particles to collide and form bigger particles. As soon as a convective cell has reached its mature stage you will find larger ice particles.
Figure 1: Meteosat 8 RSS - Brightness Temperature Difference WV6.2 - IR10.8
The BTD of the WV and the IR channel is commonly used for detecting overshooting tops. The method is based on the fact that the coldest overshooting tops exhibit the largest positive values of BTD in the case of MSG satellite defined BT (WV6.2) - BT (IR10.8). However, as already indicated by Schmetz et al. (1997), the method is likely to fail when too high overshooting tops are involved, given their height reducing the total amount of moisture above them.