Mature Phase
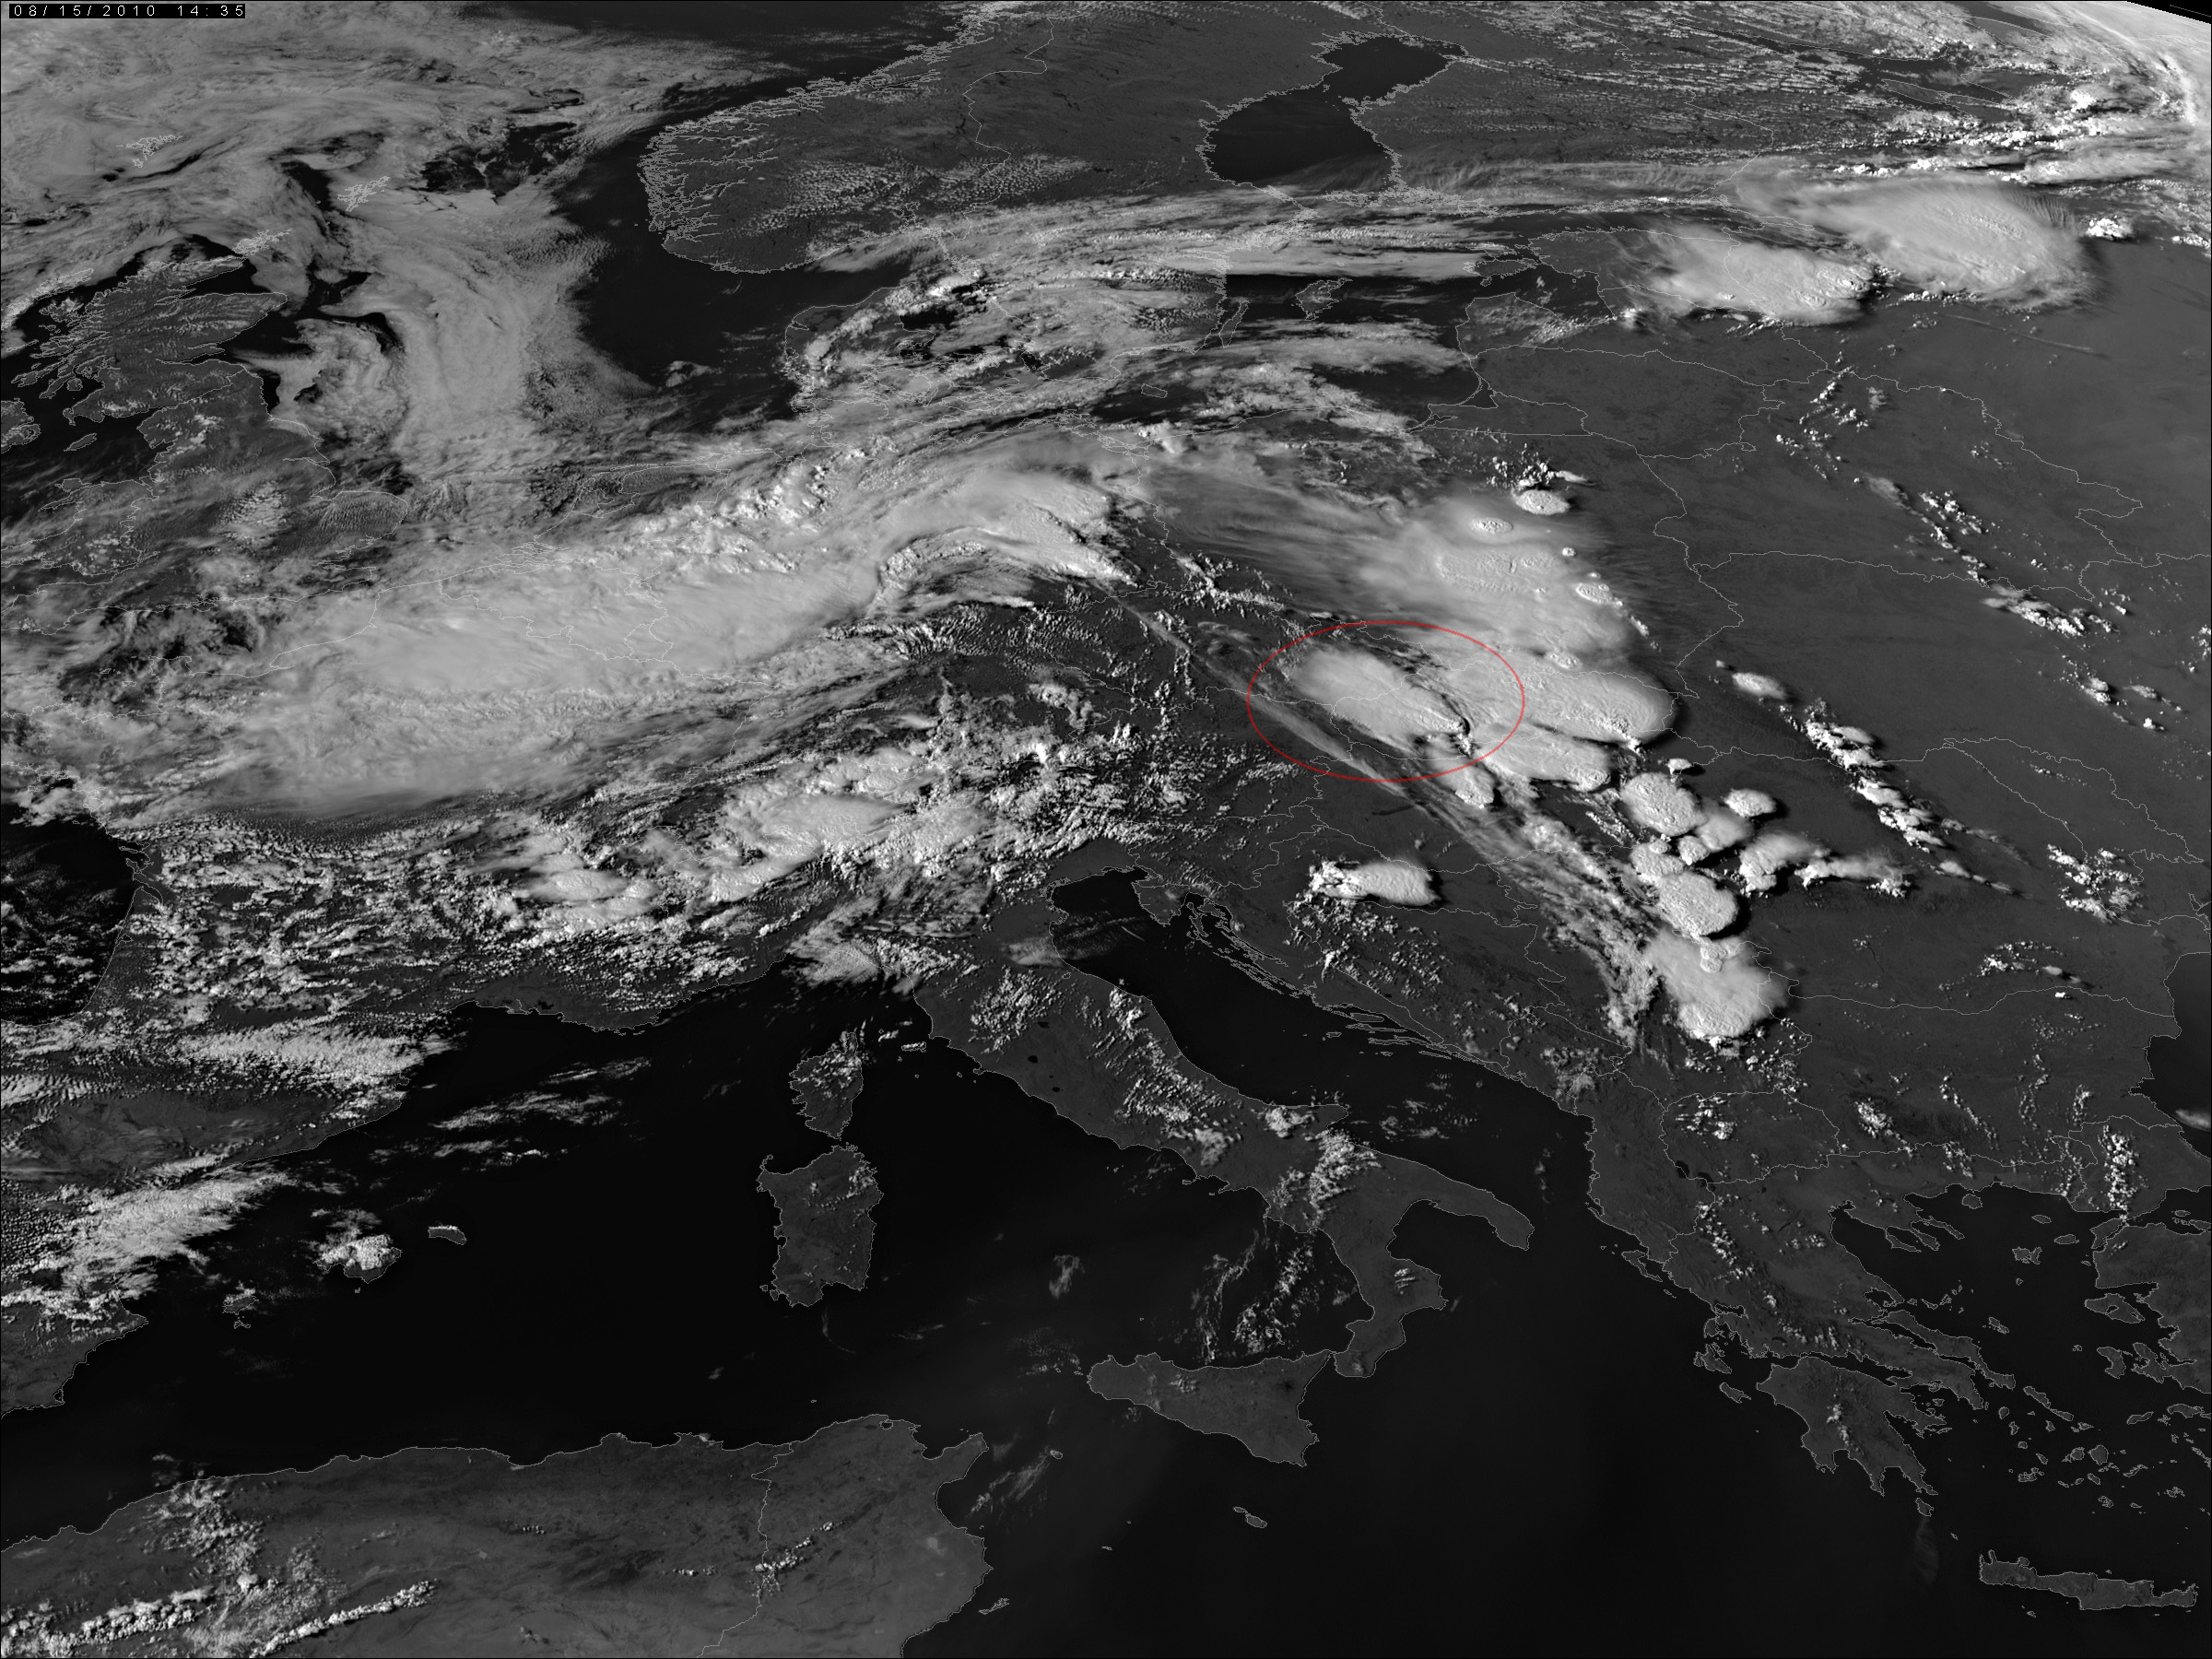
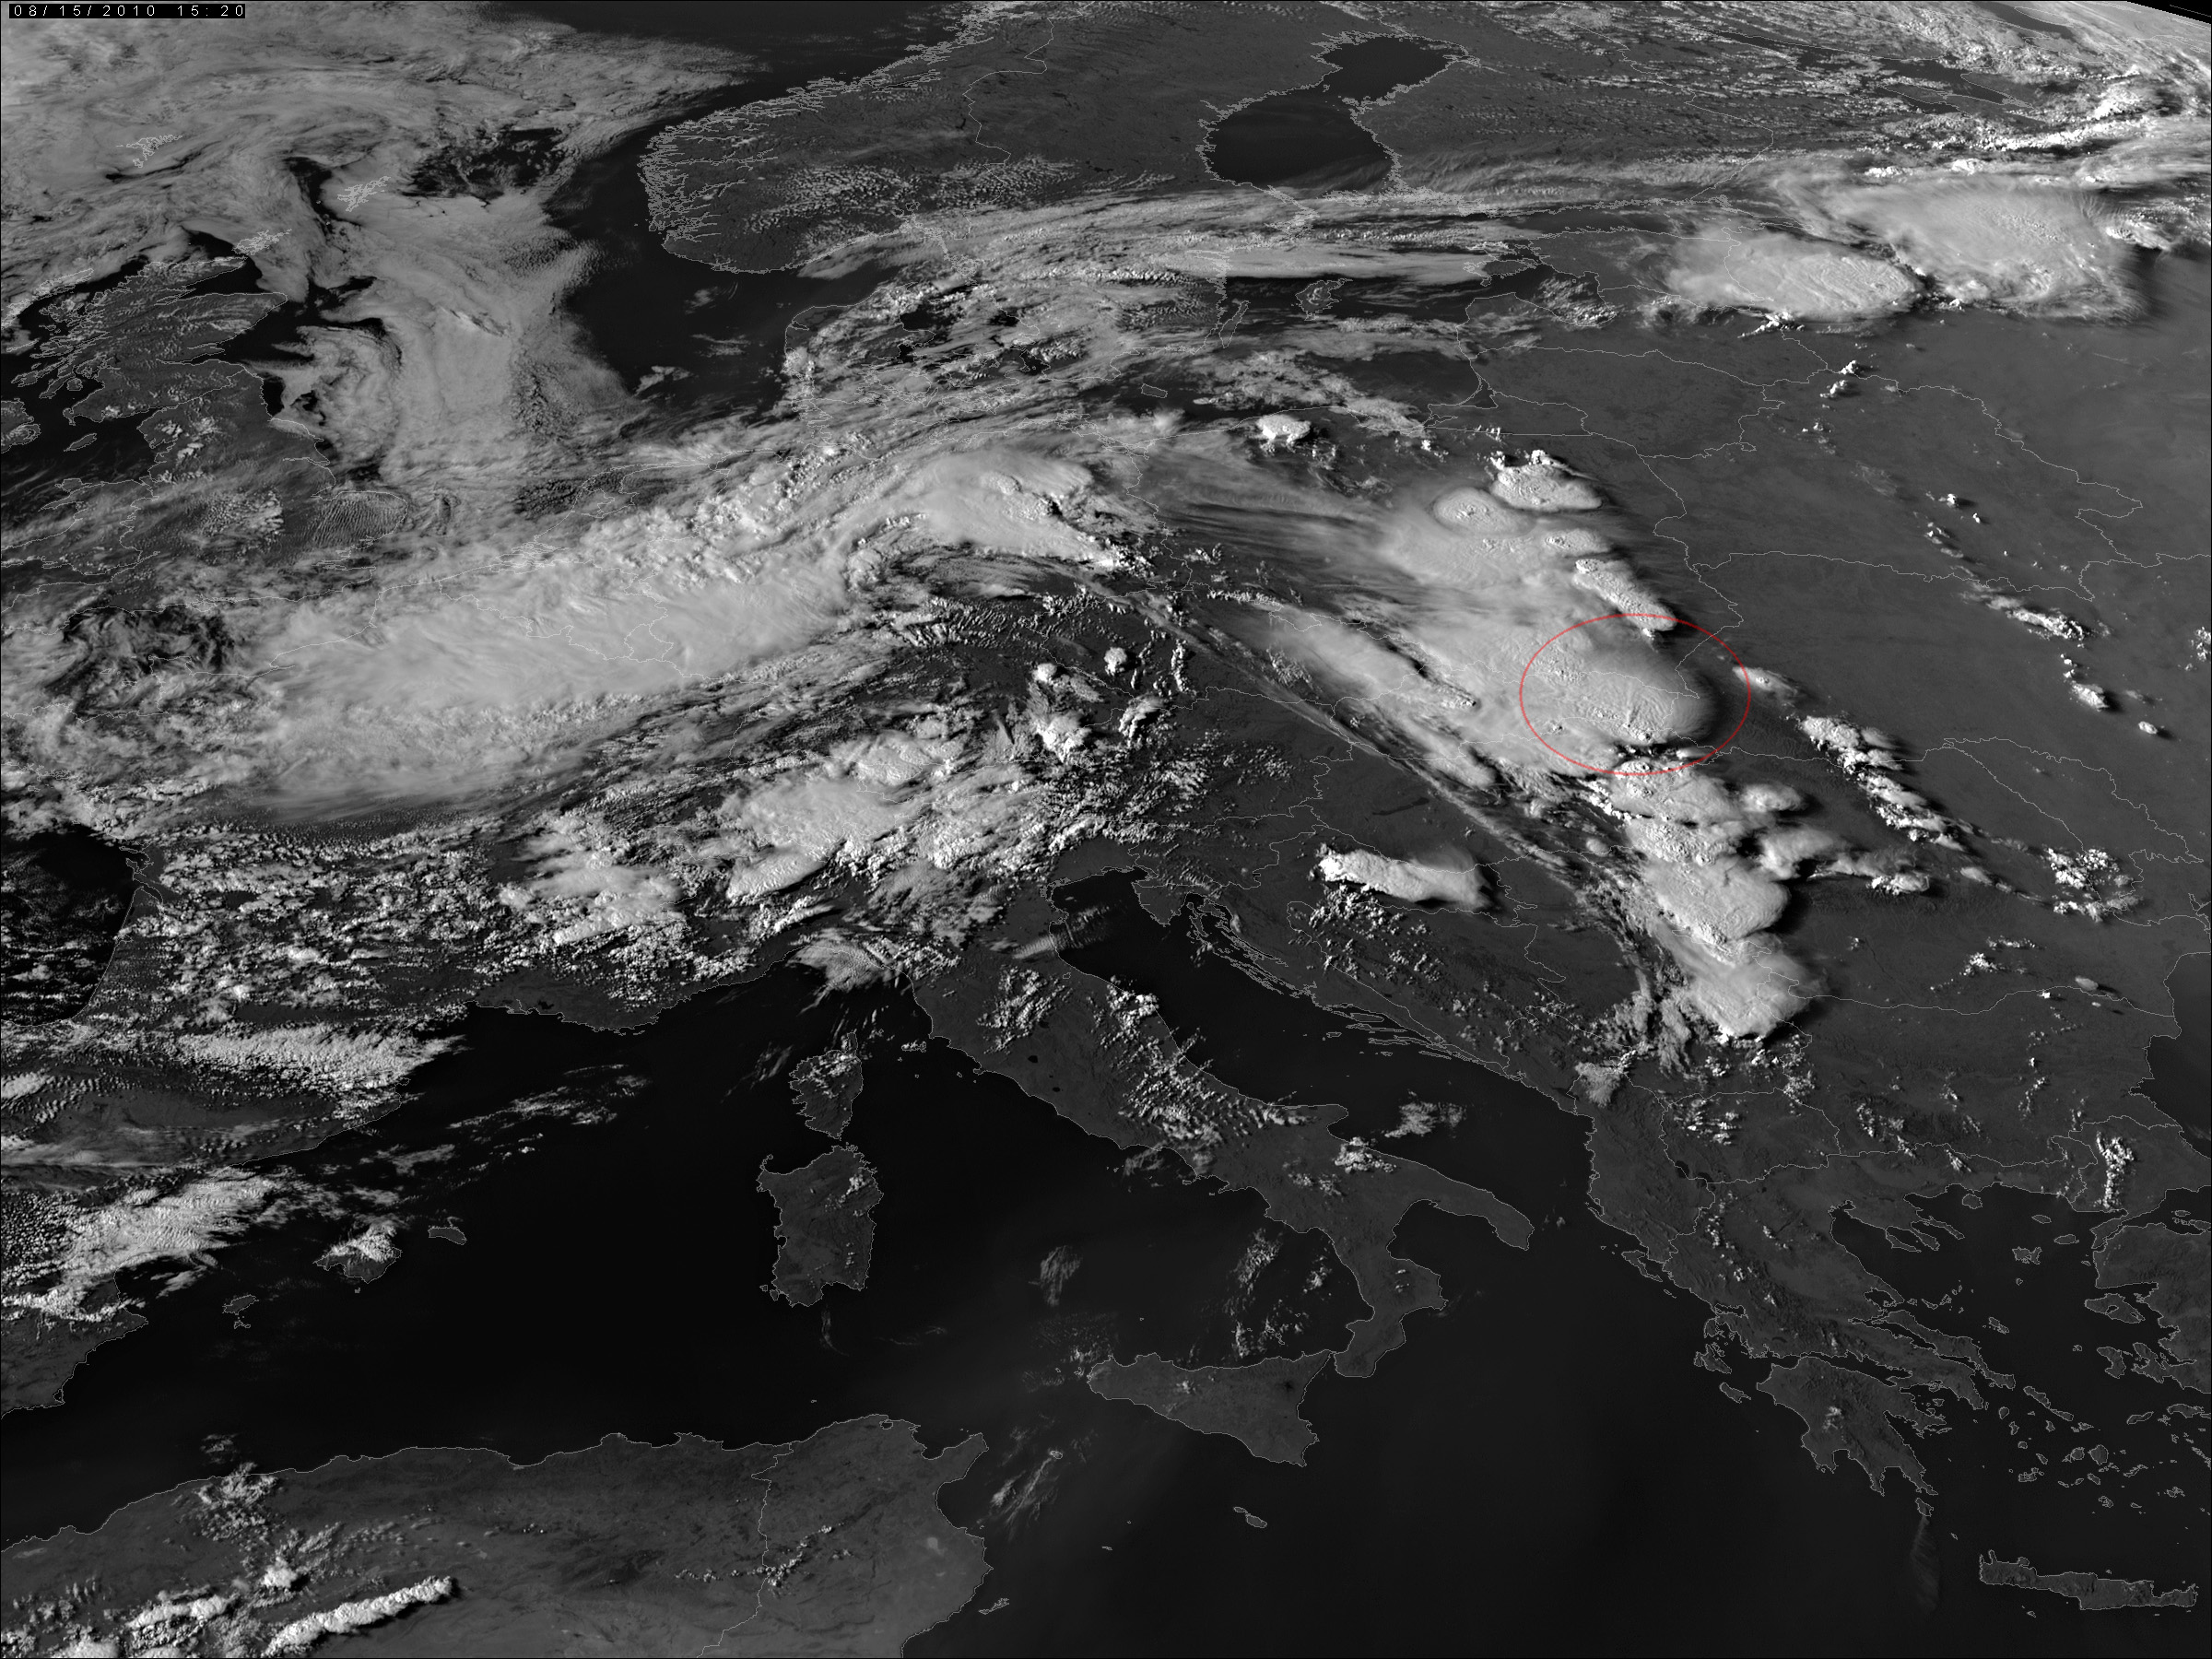
The Enhanced IR10.8 loop shows that many of the storms of that day have developed distinct cold rings or cold U-shapes at their tops. In most cases it was impossible to categorize these unambiguously; moreover, several "transitions" between these forms occurred. It is possible to check the occurrence of severe weather in the affected areas using the ESSL/ESWD database and a map of severe weather reports from that day, which confirm that many of these storms were indeed severe.
At first sight the other animations show only the general appearance of these storms and their environment. However, several areas warrant further examination. For example, the Storm RGB (confirmed by the IR3.9 images, not shown here) documents that some of these storms have "blasted up" several spots of higher reflectivity material, which were advected far downwind from the place of their origin. It may be interesting to study how the storm(s) appear in other bands and products at the time of the "puff", and if there was any link between these "puffs" and reports of severe weather.
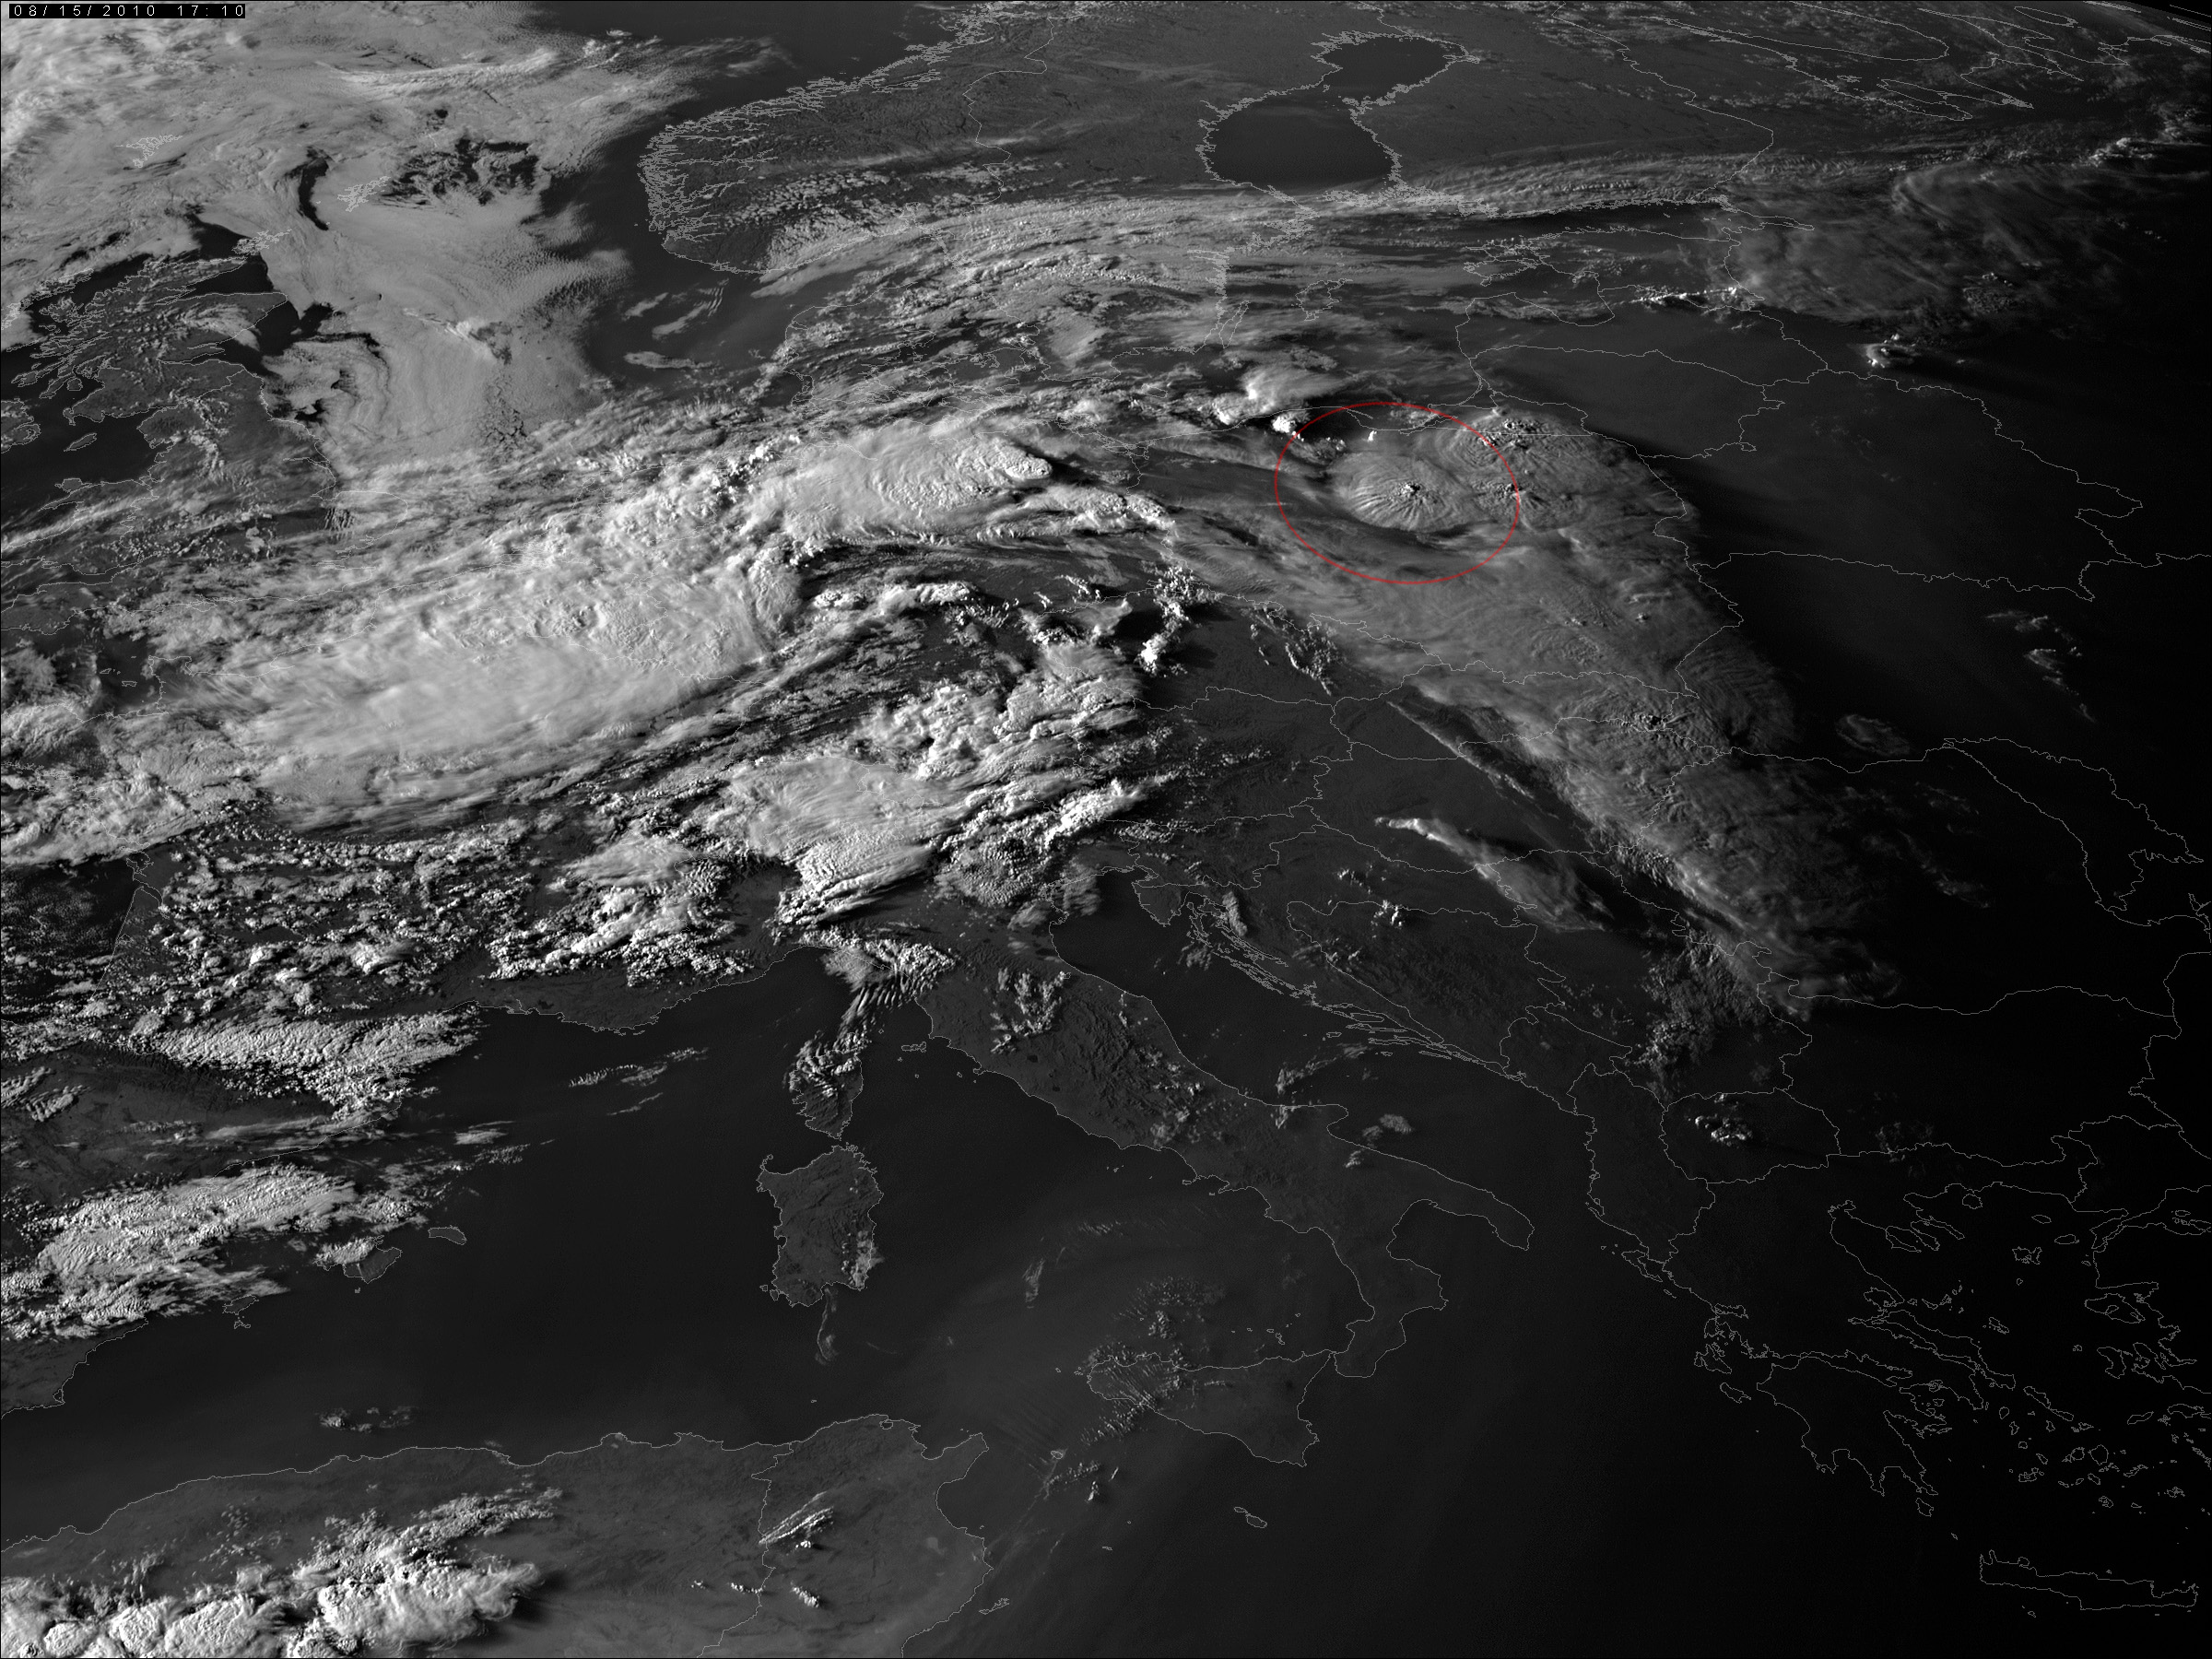
Some of these storms produced distinct overshooting tops, which formed above-anvil plumes. The best examples of these are this one and this one. It would be interesting to study different aspects of these, such as their lifetime, their relation to IR10.8 BT minima, their detectability in the BTD WV6.2-IR10.8 product, the increased IR3.9 reflectivity of the storm, etc. One of the most exciting of these storms is this one, which form a "radial cirrus" around the huge overshooting top and is greatly illuminated by the setting Sun.
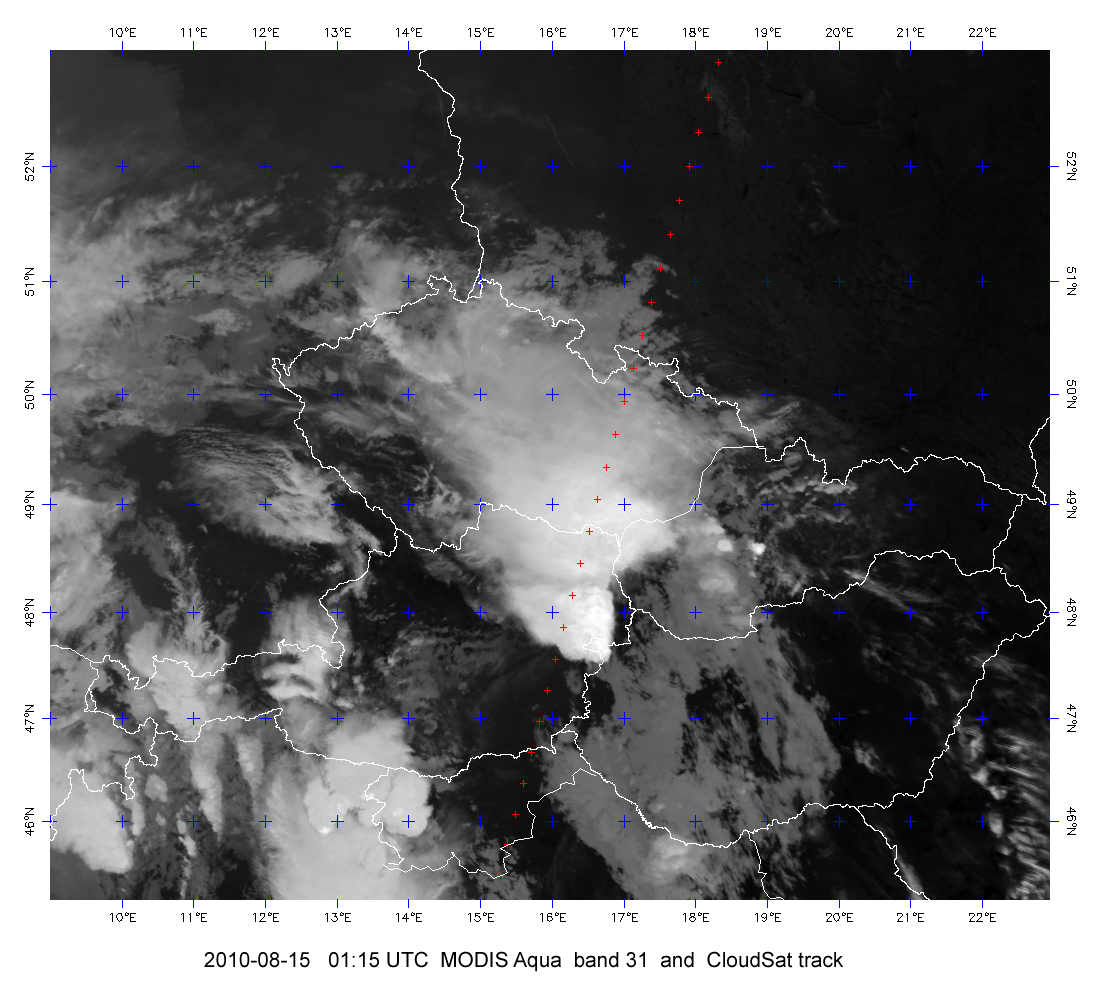
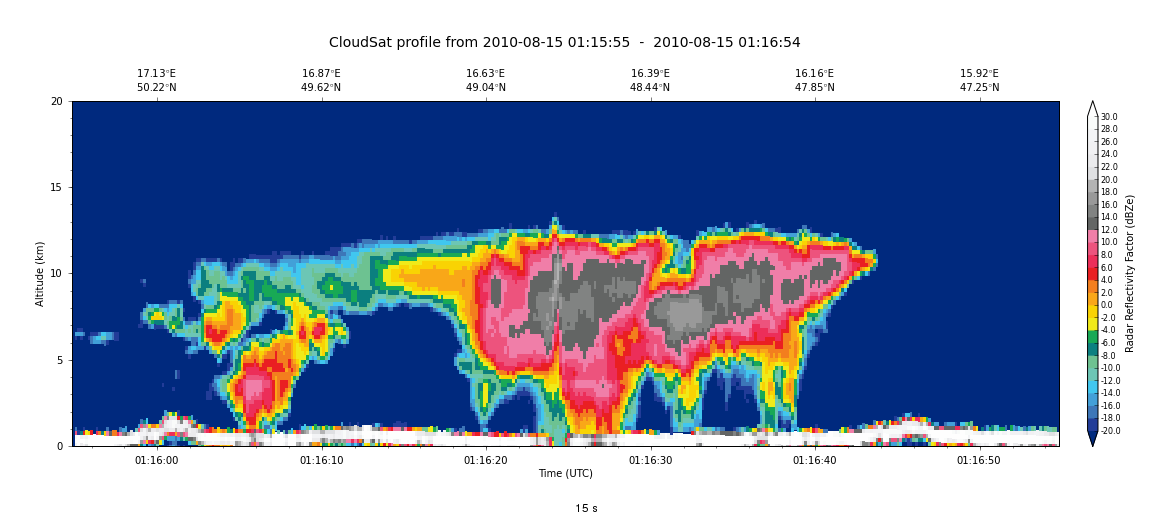
Finally, there are about 15 passes of these storms by polar orbiters - NOAA and MetOp with AVHRR instrument, and Terra and Aqua with MODIS instrument. In the 01:15 UTC overpass Aqua/MODIS captures already weakening storms above eastern Austria and the Czech Republic, while CloudSat provides a vertical profile of these. This allows the validation of the satellite-derived cloud-top products (namely CTH) using the CloudSat observations, and its favorable location allows it to compare the CloudSat profile with those derived from the operational weather radars within the area.
For this case study the convective rainfall rate product of the nowcasting SAF can also help to estimate the precipitation rate associated to convective clouds.
Figure 4.1: NWCSAF Convective Rainfall Rate - 15 August 2010 0000 to 2345UTC (source: EUMETSAT/AEMET)
In the above animation one can see the numerical calibrated product (in mm hr-1) divided into classes in the image format. The rainfall associated with the cold front is clearly identified. Embedded convective cells are observed with the highest values of rain rate depicting the cold U-shape storm. As CCR has a poor nighttime algorithm, its performance began to deteriorate when the thunderstorms developed near Prague around 18 UTC. The warmer cloud tops associated with this development lead to the incorrect assumption that only around 3mm hr-1 were recorded.