Geopotential is the potential of the Earth's gravity field. For convenience it is often defined as minus the potential energy per unit mass, so that the gravity vector is obtained as the gradient of this potential, without the minus.
Geopotential height is a vertical coordinate referenced to Earth's mean sea level — an adjustment to geometric height (elevation above mean sea level) using the variation of gravity with latitude and elevation. Thus it can be considered a "gravity-adjusted height". One usually speaks of the geopotential height of a certain pressure level, which would correspond to the geopotential height necessary to reach the given pressure. Expressed in geopotential decameters (gpm.).
Streamlines are a family of curves that are instantaneously tangent to the velocity vector of the flow. These show the direction an air parcel will travel in at any point in time.
Deformation band or Hyperbolic zones
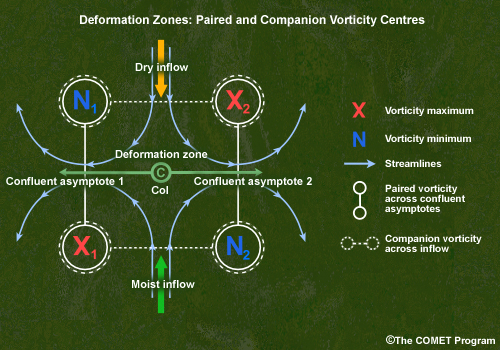
A deformation zone is a region of significant stretching in the atmosphere. The stretching is often caused by airstreams flowing toward each other and then fanning out as they meet. Deformation is a primary factor in frontogenesis and frontolysis.
The full frontogenesis function Ft consists of three components: Ft = Fh + Fv + Fq, where Fh is frontogenesis caused by horizontal wind field, Fv frontogenesis by vertical motions and Fq frontogenesis by diabatic heating. The contribution from Fh is necessary for the formation of synoptic scale fronts. It can be expressed as:
where Dtot is the total deformation, D is the horizontal wind divergence and b the angle between the axis of dilatation and the isentropes (isolines of equivalent potential temperature or theta-E). Frontogenesis can occur when cos2b > 0, which means that 2b < 90° or b < 45°. Frontolysis can occur when 45° < b < 90°. Frontogenesis is strongest in the confluence zone, and zero in the saddle point, where there is no wind.
The effect of vorticity on the deformation field is shown the following diagram:
Isotachs at 300 hPa (m s-1) indicate lines of equal wind speed. It show the position of Jet streak.
Cyclonic Vorticity Advection (CVA) is the result of more cyclonic values of vorticity advecting into lower values of vorticity.
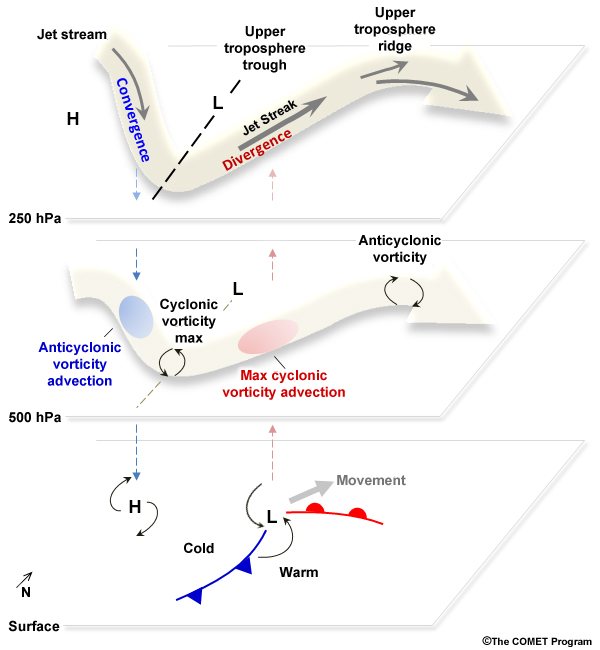
In the following figure is a conceptual model of a midlatitude cyclone at the surface, 500 hPa, and 250 hPa. Note the alignment of the surface low pressure center with mid-level (500 hPa) cyclonic vorticity advection and upper-level (250 hPa) divergence (cyclonic vorticity advection at 250 hPa). When cyclonic vorticity advection between 250 and 500 hPa is positive (PVA or CVA) rising motions will appear.
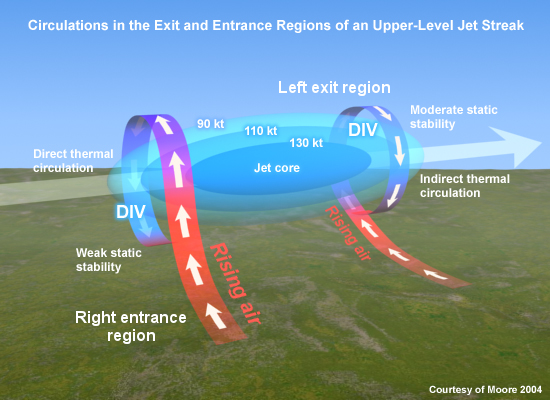
The following figure shows a conceptual model of jet streaks and the generation of ascent flow in left exit and right entrance regions because positive (cyclonic) vorticity advection:
Cyclonic vorticity advection in the mid-upper troposphere increases flow into the surface low. Upper-level waves become intense with meridional orientation, when cold, sinking air is moving towards the equator and warm, rising air is moving poleward. The cold air advection amplifies the upper-level wave, which enhances upper-level divergence and intensifies the surface low.
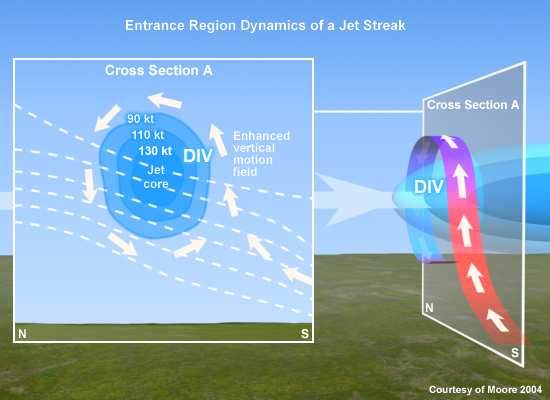
Divergence in the entrance region of the jet streak induces low-level convergence, acceleration of the wind at low-levels, and rising motion along sloped isentropic surfaces towards the divergent region. The following conceptual diagram shows the secondary circulation associated with the entrance region of an upper-tropospheric jet streak. Vertical motion is due to sloped ascent of the accelerating low-level wind towards the upper-level divergence in the jet entrance region.
Relative vorticity (RV) is the vorticity of the air velocity field relative to the Earth. This is often modeled as a two-dimensional flow parallel to the ground, so that the relative vorticity vector is generally perpendicular to the ground, and can then be viewed as a scalar quantity, positive when the vector points upward, negative when it points downwards. Therefore, vorticity is positive when the wind turns counter-clockwise (looking down onto the Earth's surface). In the Northern Hemisphere, positive vorticity is called cyclonic rotation, and negative vorticity is anticyclonic rotation; the nomenclature is reversed in the Southern Hemisphere.
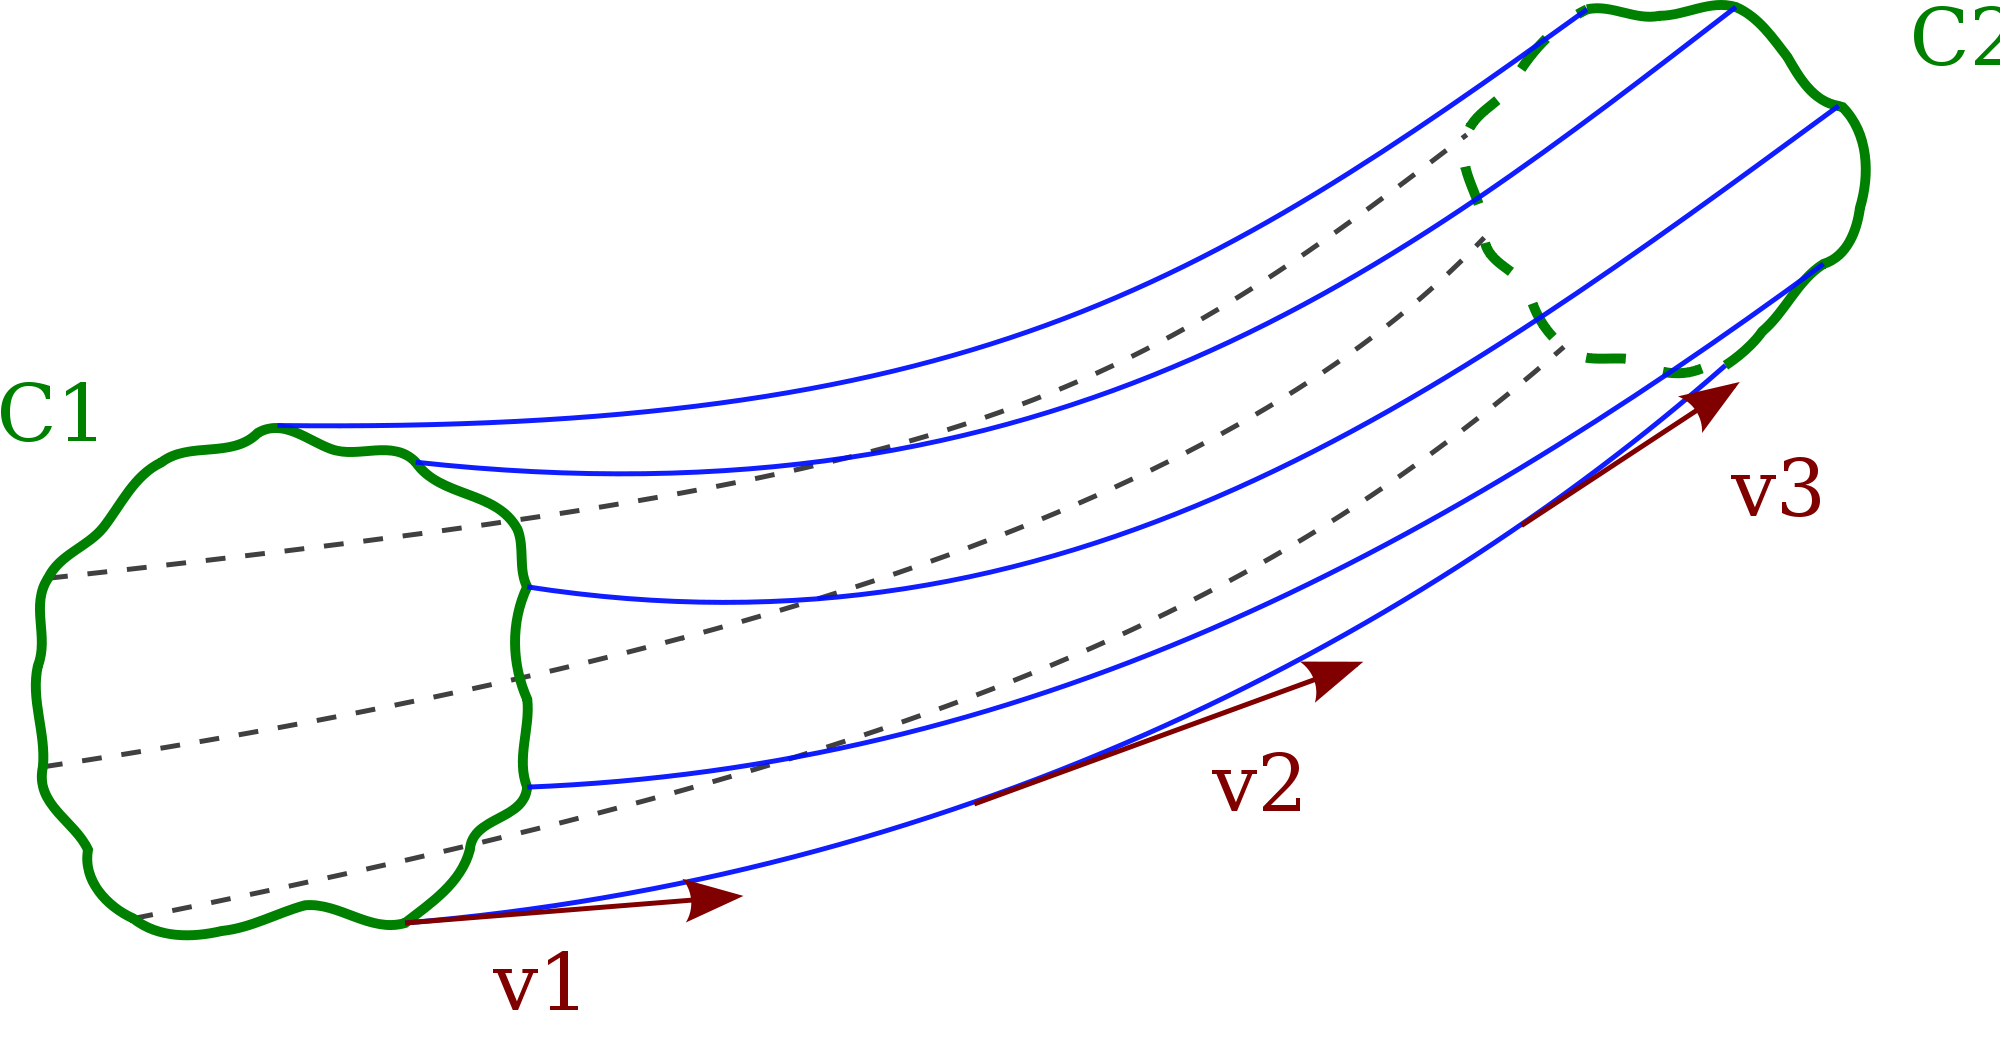
Potential vorticity (PV) is a quantity which is proportional to the dot product of vorticity and stratification that, following a parcel of air or water, can only be changed by diabatic or frictional processes. It is a useful concept for understanding the generation of vorticity in cyclogenesis (the birth and development of a cyclone).
Carl-Gustaf Rossby first introduced potential vorticity in his 1936 paper "Dynamics of steady ocean currents in the light of experimental fluid mechanics". This work was based on an analysis of a shallow water model of the Gulf Stream. The concept was developed further, within a few years of Rossby's seminal paper, by Hans Ertel. The definition follow as: the absolute vorticity on an isentropic (constant potential temperature) surface, multiplied by the static stability. Mathematically, Ertel's form of potential vorticity is given by the equation:
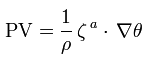
where  is the fluid density,
  is the absolute vorticity and
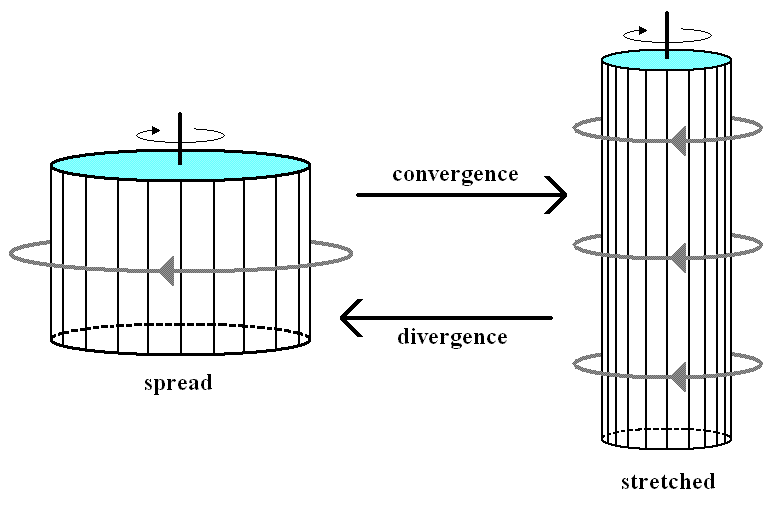
  is the gradient of the potential temperature. It can be shown through a combination of the first law of thermodynamics and momentum conservation that potential vorticity can only be changed by diabatic heating (such as latent heat released from condensation) or frictional processes. This conservation is the atmospheric equivalent to inertia. A spinning ice skater with her arms spread out laterally can accelerate her rate of spin by contracting her arms. Similarly, when a vortex of air is broad, it is in turn, slow.
When the air converges, to maintain potential vorticity, the air speed increases, resulting in a stretched ring vortex. Divergence causes the vortex to spread, slowing down the rate of spin.
There is a strong relationship between a dark Stripe in WV imagery and potential vorticity.
Values of PV less than 1.5 PVU (potential vorticity units) are typically associated with tropospheric air and values greater than 1.5 PVU are typically associated with stratospheric air. Centers of higher potential vorticity ( >1.5 PVU) are called “potential vorticity anomalies”, or “PV anomalies” for short. A distinction can be made between positive PV anomalies (associated with cyclonic disturbances) and negative PV anomalies (associated with anticyclonic circulations/ridges).
Values of 1.5 PVU (potential vorticity units) of the potential vorticity indicates the tropopause. A dark Stripe, as mentioned here, is a PV-anomaly.
The descending air with high values of PV penetrates into the (potentially) unstable layers in the lower part of the troposphere. PVA in front of the PV-anomalies enhances the convection, the convection could be dry but also moist, resulting in showers. This mechanism causes a strong variation in upward and downward motion near the surface and leads to extremely gusty winds.
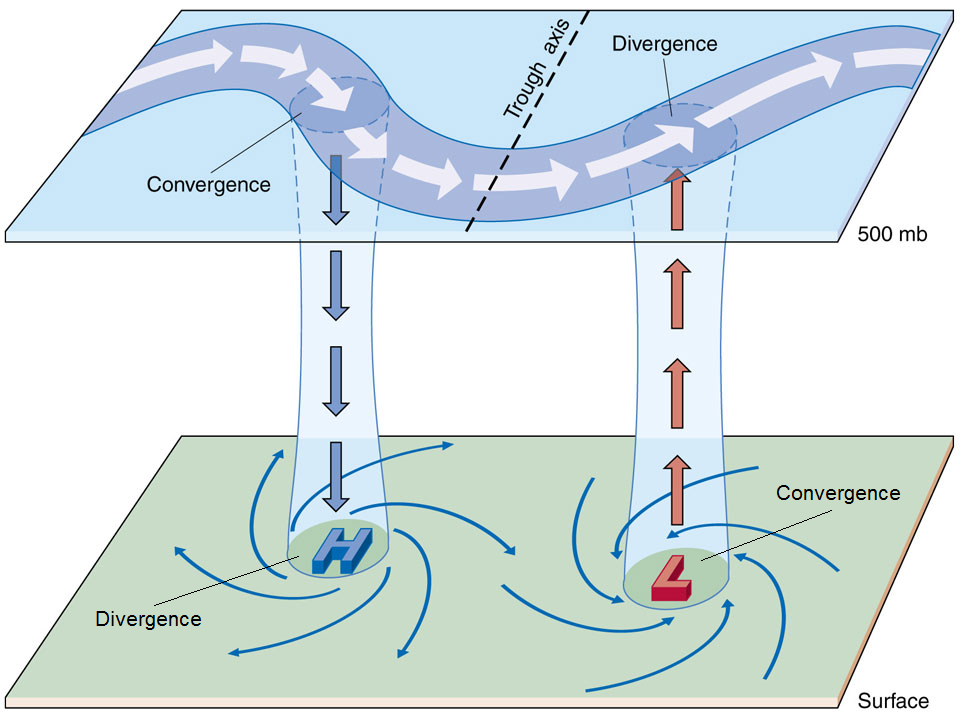
Divergence and Convergence roughly determine where air will be sinking or rising. Rising air is associated with clouds and precipitation; sinking air is associated with clear and calm conditions. Divergence refer to positive values and convergence are the negative ones.
The potential temperature of a parcel of fluid at pressure P is the temperature that the parcel would attain if adiabatically brought to a standard reference pressure  , usually 1000 millibars. The potential temperature is denoted θ and, for a gas well-approximated as ideal, is given by

where T is the current absolute temperature (in K) of the parcel, R is the gas constant of air, and cp is the specific heat capacity at a constant pressure.
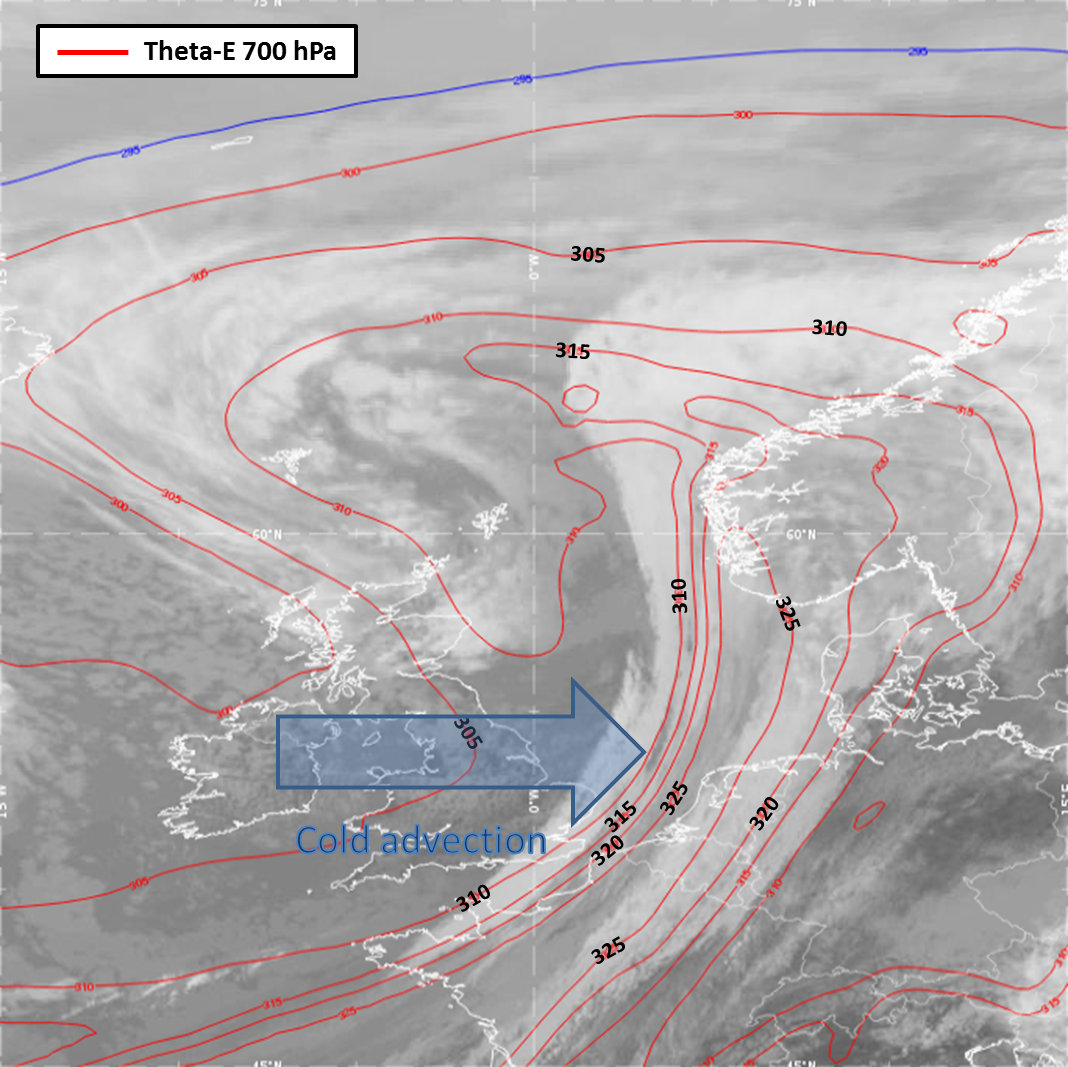
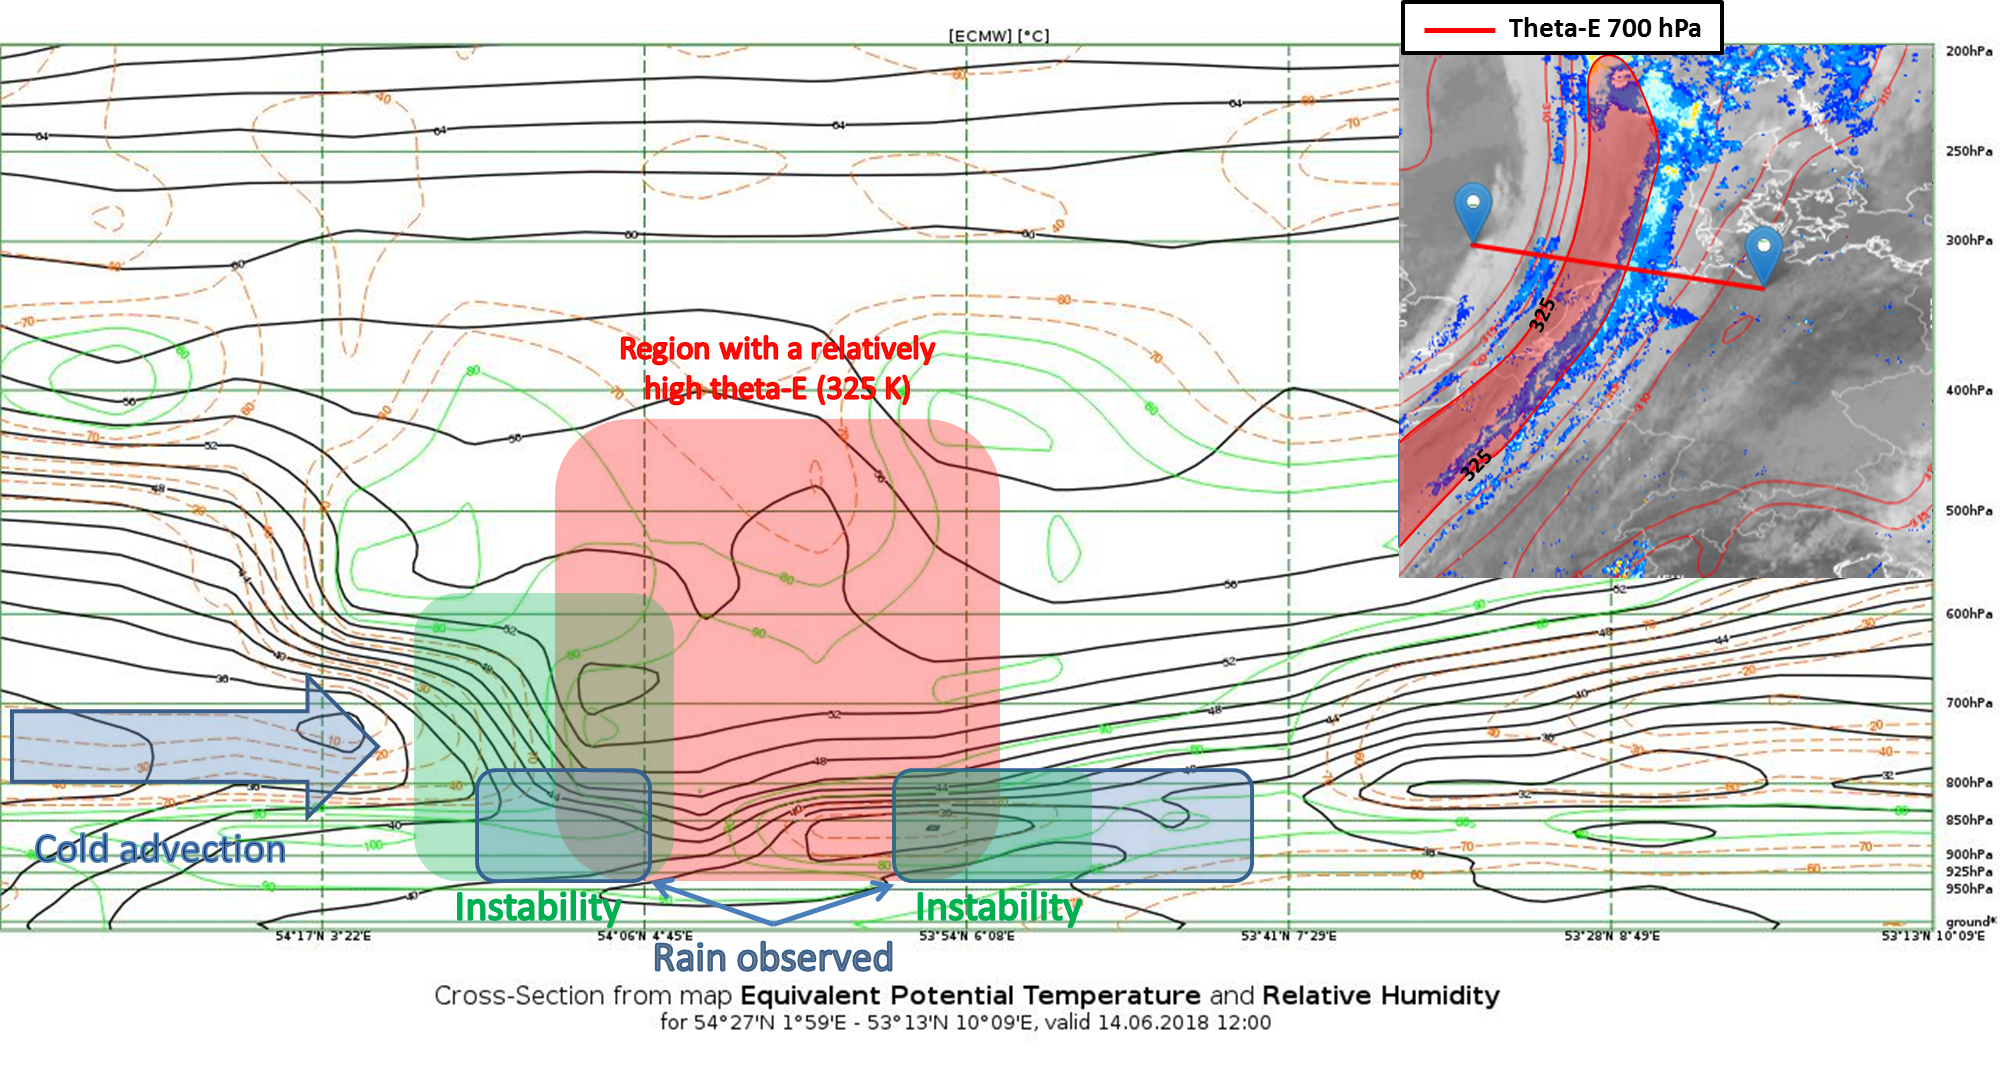
Equivalent potential temperature, commonly referred to as theta-E is the temperature a parcel of air would reach if all the water vapor in the parcel were to condense, releasing its latent heat, and the parcel was brought adiabatically from the 850 hPa level to a pressure of 1000 hPa. In stable conditions, increases with altitude. If decreases with height, convection can occur . The comparison of the equivalent potential temperature of parcels of air at different pressures provides a measure of the instability of the column of air.
A region with a relatively high theta-E is often the region with the most instability. Warmer low level temperatures and higher low level dewpoints increase instability.
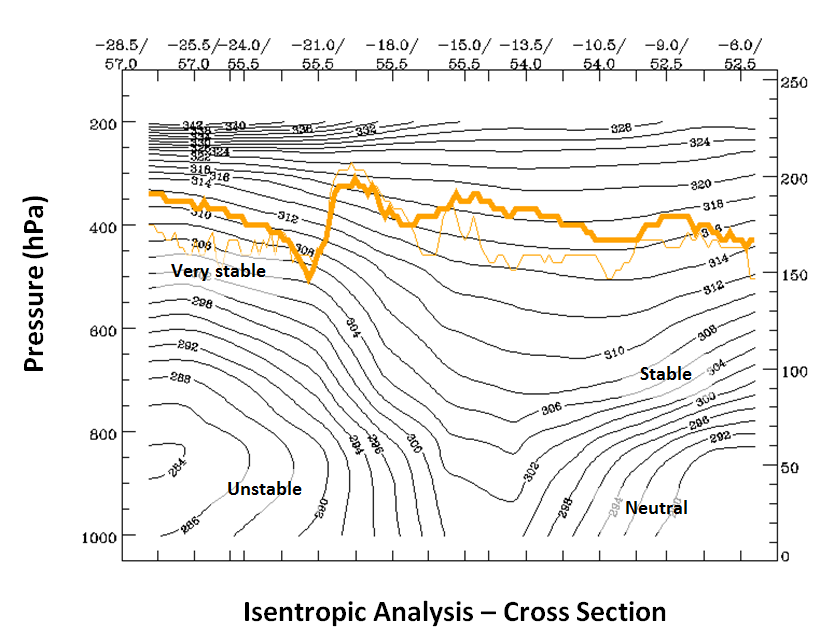
ISENTROPES are the isolines of potential or equivalent potential temperature. For synoptic scale motions, in the absence of diabatic processes, isentropic surfaces are material surfaces. The advantages of analyzing atmospheric processes in isentropic coordinate system are:
- The fact that atmospheric variables tend to be better correlated along isentropic surface than on constant pressure surface.
- The vertical spacing between isentropic surfaces is a measure of the dry static stability.
- The slope of an isentropic surface is directly related to the thermal wind.
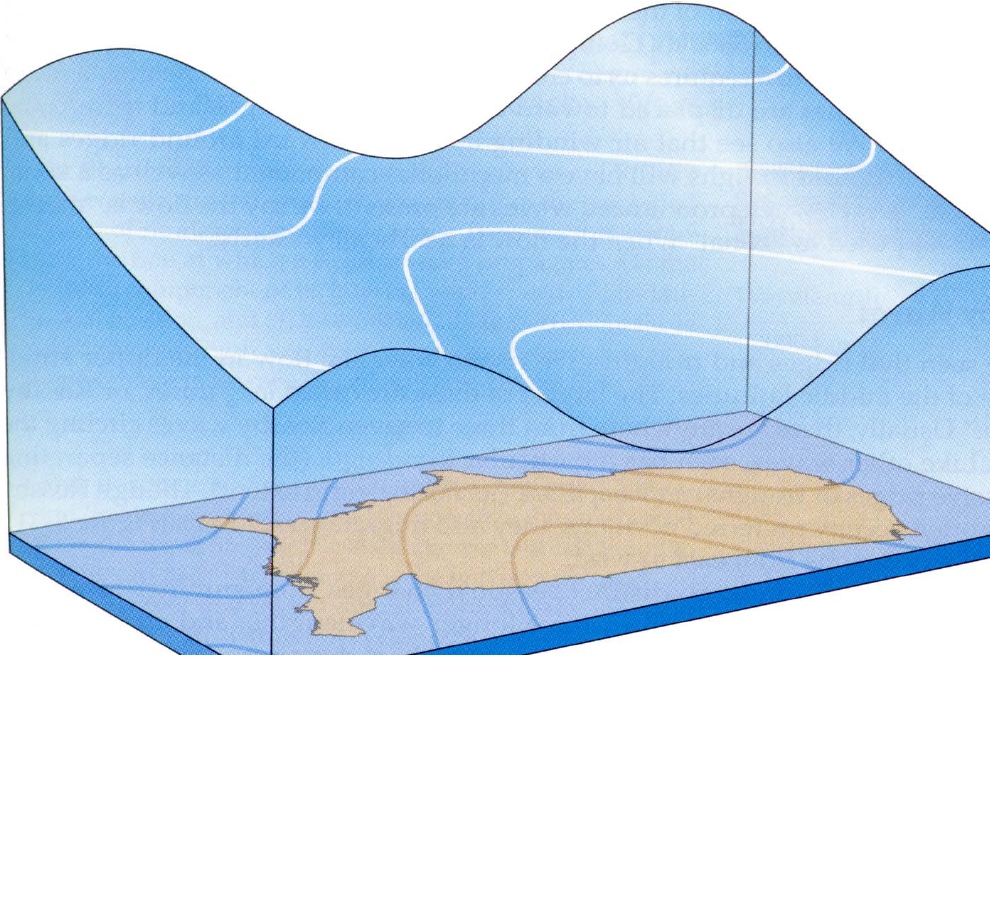
In the same way that sounding enables us to see the stability of the air column above one point, the cross section of the isentropes gives a quick overview of the stability of the atmposphere over larger area. The distance between the isentropes is a measure of static stability. In the following sketches four possible stability regimes are represented:
The vertical motion has a theoretical connection to other meteorological parameters, which individually may be indicative of special cloud areas and configurations. The resulting values of vertical motion expressed as omega are a composite of several processes; this is mathematically described in the omega equation. Satellite meteorology has shown that not only the resulting complete omega field fits to cloud systems but that single contributors are connected with different cloud configurations which are characteristic of the different processes. Therefore even the analysis of these single parameters can be a valuable tool for satellite meteorology. The equation below is a presentation of the omega equation where the connection between the contributions to vertical motion and the characteristic cloud configurations can be discriminated. Omega and W have opposite sign. Thus, updrafts are omega negative values and downdrafts are the positive ones.
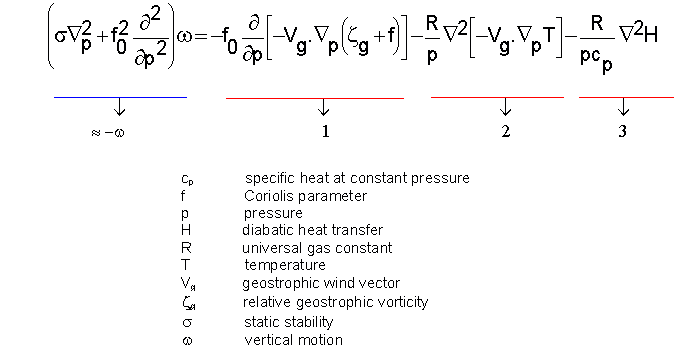
- Term (1) contains the vertical variation of Vorticity Advection. PVA → ΔZ ↓ → Adiabatic Cooling → Rising motion.
- Term (2) contains the Laplace operator of Temperature Advection. Warm Advection → ΔZ ↑ → Divergence → Rising motion.
- Term (3) contains the Laplace operator of diabatic heat changes.
The QG omega equation is a diagnostic equation:
- The equation does not predict future vertical motion patterns.
- The forcing functions (Terms 1 and 2) produce instantaneous responses.
Use of the QG omega equation in a diagnostic setting:
- Diagnose the synoptic–scale vertical motion pattern, and assume rising motion corresponds to clouds and precipitation when moisture is available.
- Compare to the observed patterns. It can infer mesoscale contributions.
- Helps distinguish between areas of persistent light precipitation (synoptic-scale) and more sporadic intense precipitation (mesoscale).
More infomation in this document
The dew point is the temperature to which air must be cooled to become saturated with water vapor.
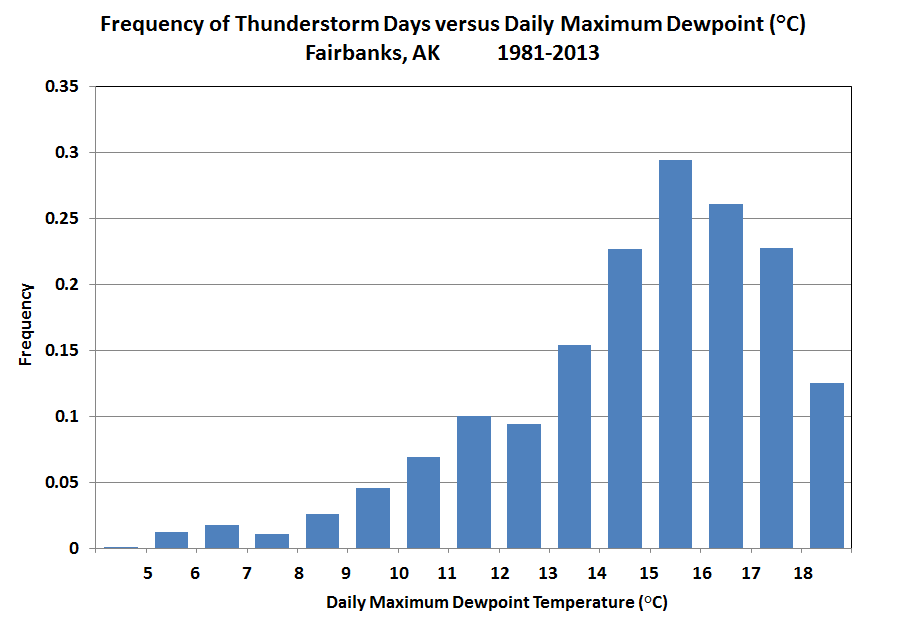
The surface dewpoint needs to be 12-13 ºC or greater for a surface based thunderstorm to occur. A dewpoint of less than this value is unfavorable for thunderstorms because the moist adiabatic lapse rate has a more stable parcel lapse rate at colder dewpoints. Dewpoints at the surface can be less than 12-13 ºC in the case of "elevated thunderstorms".
As an exemple, majority of thunderstorms in Fairbanks (Alaska) occur when daily maximum dewpoints are near 15-16 °C. There is a threshold at 12-13 ºC when frequency noticeably rises.
Elevated convection is the convective lifting of air that initially begins to rise starting above the planetary boundary layer. When a front is involved (cold, warm, dryline) the parcels lift from the top of the front. On a sounding, a temperature inversion often marks the vertical depth of the front. Wind and dewpoint changes in the vertical can also help locate the vertical frontal boundary.
Many of the indices (CAPE, LI, and others) assume parcels of air begin to rise from the surface. In a situation where "elevated convection" occurs, the convective surface will be higher in the troposphere and often just above an inversion, as mentioned earlier.
Thermal Front Parameter (TFP) is a widely used parameter for frontal analysis. It is computed from the second derivative of temperature in space.
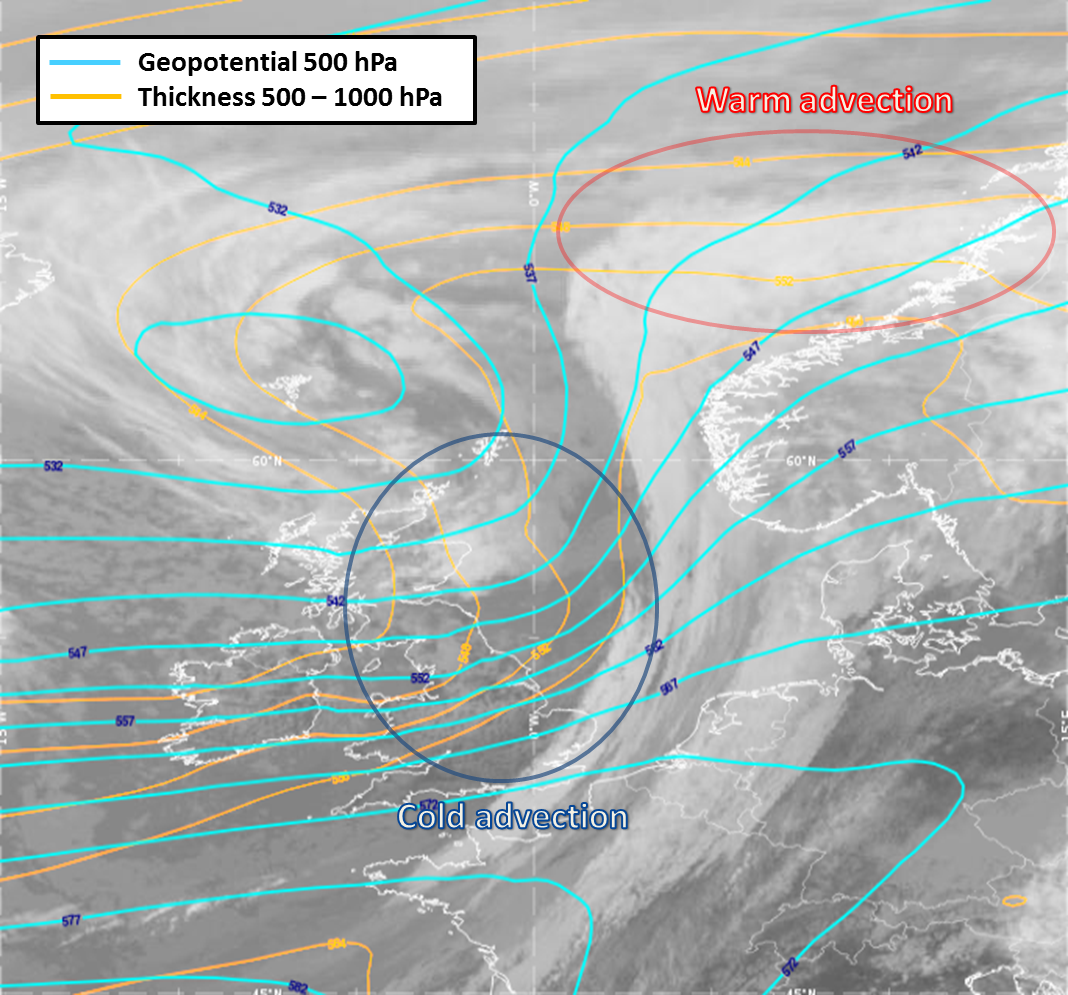
There are relationships between the thickness 500 - 1000 hPa and the TFP. As can be seen from the following diagram the maximum of the TFP field which is the location of the front can be found on the warm side of the zones of high thickness gradients because there the change of the thickness gradient is a maximum.
Thickness is a measure of how warm or cold a layer of the atmosphere is, usually a layer in the lowest 5 km of the troposphere; high values mean warm air, and low values mean cold air.
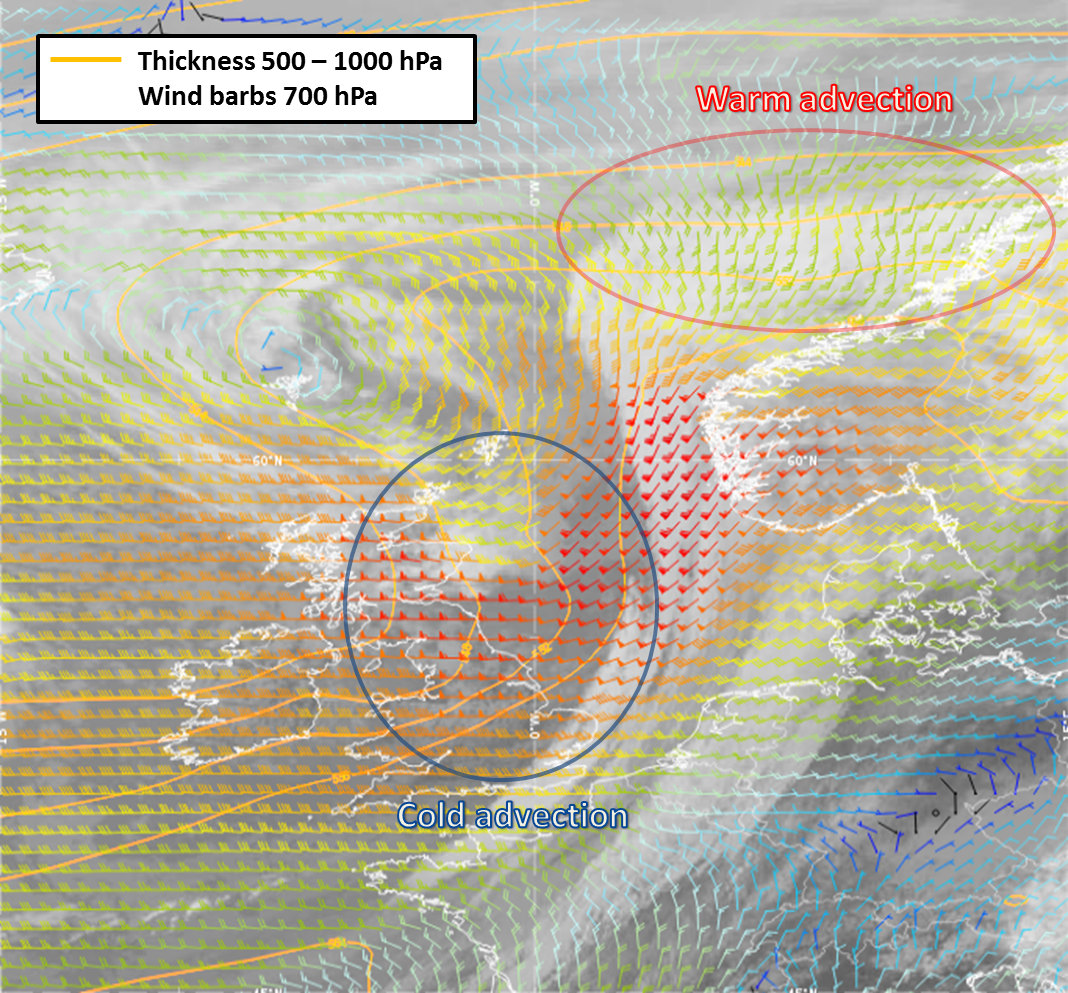
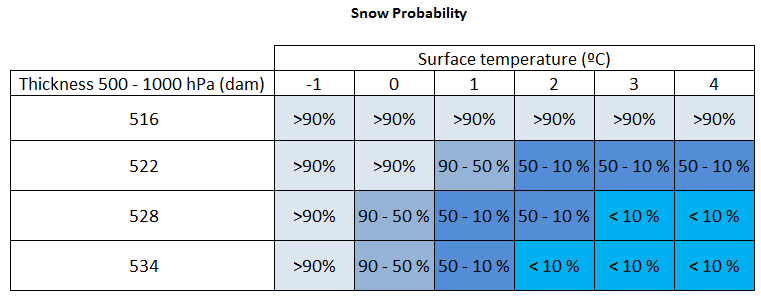
Rain and snow are equally likely when the 500-1000 hPa thickness is about 5225 gpm (or 522 dam). Rain is rare when the 500-1000 hPa thickness is less than 5190 gpm (or 519 dam). Snow is extremely rare when the 500-1000 hPa thickness is greater than 5395 gpm (or 540 dam).
Furthermore, low tropospheric thickness 850-1000 hPa gives an indication of the temperature at the lowest layers of the troposphere. The precipitation phase and lower tropospheric thickness are closely related: the likelihood for mixed phase precipiation (rain with snow) is highest at 1295m. Above 1295m the likelihood for rain increases rapidly , while below 1295m the snow is the most probable precipitation type.
More infomation in this document
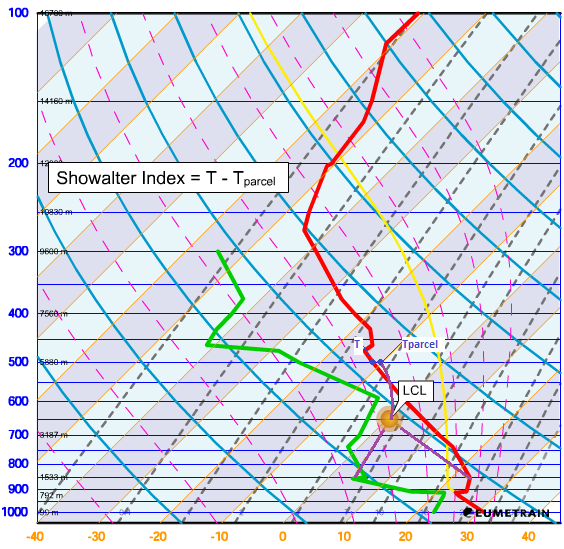
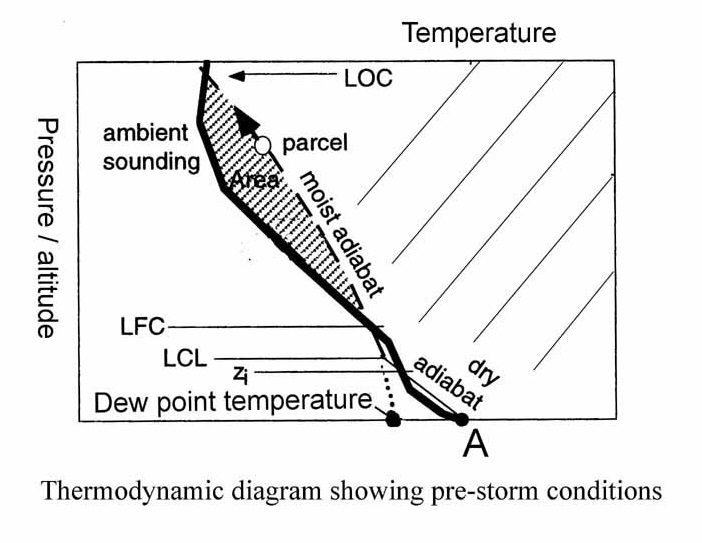
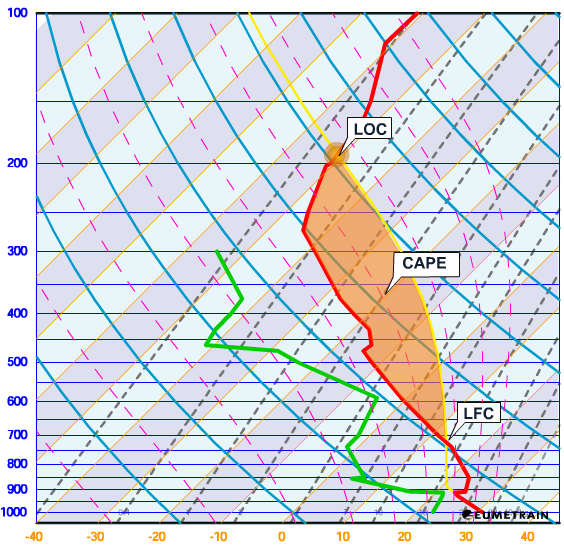
CAPE which stands for Convective Available Potential Engergy (CAPE) is defined as the vertically integrated positive buoyancy of a rising parcel.
In the image it is seen as the orange area between the level of free convection (LFC) and the limit of convection (LOC). CAPE is a good indicator of general instability, and convection tends to be more vigorous with higher values. The CAPE in this convective event indicated a value of 3624 J Kg-1 which reflects an extremely unstable situation.
Showalter Index Showalter is calculated using the environmental temperature and the dew point at 850 hPa and environmental temperature at 500 hPa. The index is derived from an air parcel which is lifted dry-adiabatically from 850 hPa level to the lifted condensation level (LCL). From the LCL it rises up to 500 hPa along the moist adiabat. The resulting Tparcel is subtracted from the actual 500 hPa temperature.
- > 3 Thunderstorms unlikely.
- 0 to 3 Isolated Thunderstorms.
- -3 to 0 Numerous Thunderstorms.
- < -3 to 0 Numerous Thunderstorms.