Chapter IV: Austria
Table of Contents
- Chapter IV: Austria
- Austria - Forecast for 10 and 11 March
Austria - Forecast for 10 and 11 March
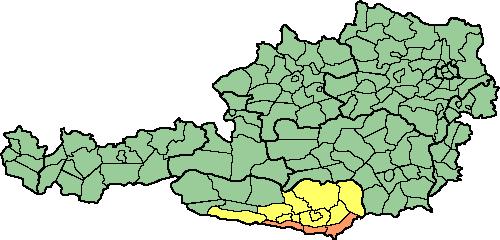
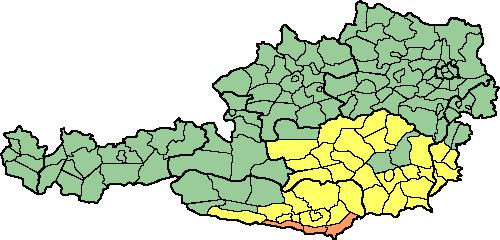
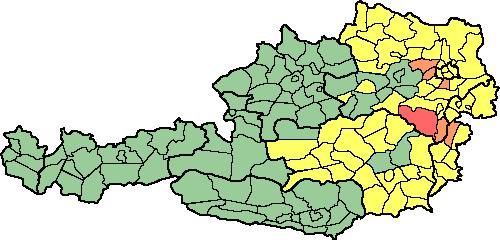
The ZAMG forecast from 9.3.2010 for the following days: Until the morning of the 10 March only slight snowfall for the south of Austria is forecasted. During the day of the 10th more strong snowfall propagate northward due to the Mediterranean Low. Until the 11 March snowfall in the whole country, also in the north of the Alps is expected. These days Maximum Temperatures up to +3°C are possible. The ZAMG Snow Warning System (Fig 4.1/2/3) on the 9.3 first warns for heavy snowfall in Carinthia with fresh snow of up to 35cm in 48h. On the 10.3 and 11.3 also a Snow Warning for Styria, Burgenland, Lower Austria and Vienna was added with up to 35cm fresh snow.
Figure 4.1: Snow warning: 9.3 16UTC for 10.3 to 12.3 0UTC MAX: 35cm
Figure 4.2: Snow Warning: 10.3 12UTC for 10.3 to 12.3 MAX: 35cm
Figure 4.3: Snow Warning: 11.3 8 UTC for 10.3 to 12.3 MAX: 30cm
The Ensemble Prediction System Aldin-LAEF (Fig 4.5), developed by the ZAMG, forecasts with high probability around 15mm up to 22mm precipitation in the discussed period e.g. for Graz and Klagenfurt. A challenge for the forecaster is the relation between the liquid water equivalent [mm] and the snowfall [cm]. For this problem many slightly different conversions for this problem are described in the literature. Fig 4.4 shows a conversion table which supports combined with the precipitation forecast the warning of snowfall up to 35cm. In order to verify this conversion in the next chapters a conversion coefficient from this special event was calculated.
Figure 4.4: Conversion Table - Precipitation [mm] to Snow [cm]; (Case Study: Heavy Snowfall Austria; Sabrina Kappel)
A first hint that it is possible that not all precipitation will fall as snow shows the LAEF 2m temperature. In all 4 representative cities, positive temperatures are possible. More details of this will be described in the verification chapter. The predicted Wind speed up to 10m/s mainly in the region around Vienna and Eisenstadt increases the chance on positive temperatures du to turbulent mixing.
Figure 4.5: Aladin-LAEF EPSgram (run 20100309 12UTC)
Austria - Verification
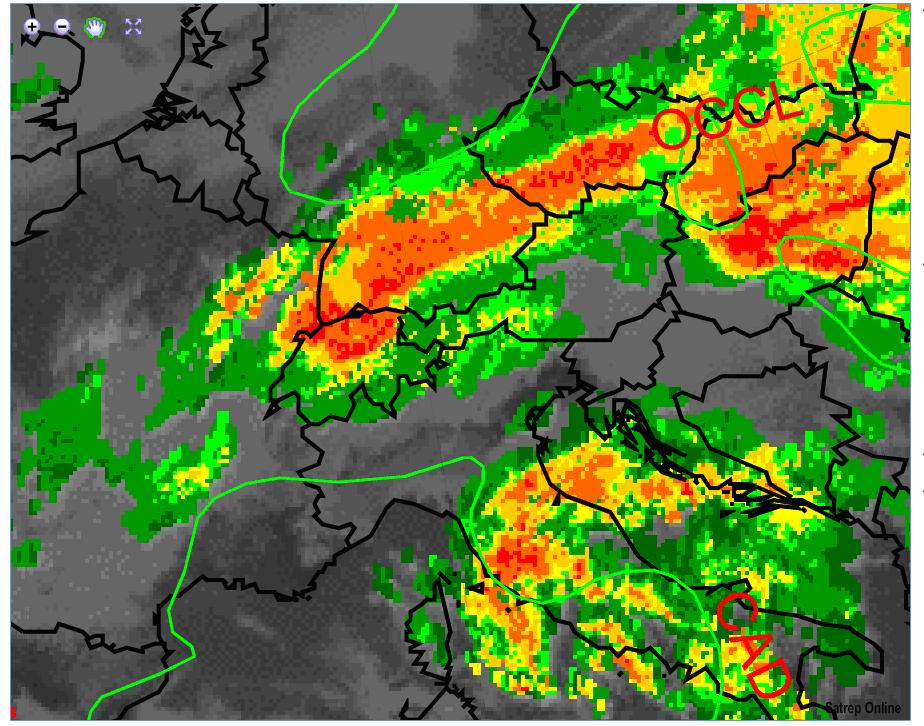
On the 10 March at 12 UTC the Occlusion brings in Austria heavy snowfall mainly over the south of the Alps. But also in the north, assisted by the northern baroclinic zone (Fig 4.6). Identified by the NWCSAF: clouds with high probability for precipitation in these regions;
Figure 4.6: 10.3.2010 12UTC - MSG IR 10.8 with overlay NWCSAF Precipitating Clouds and SatRep; green lines: ECMWF Equivalent Thickness
Until the 11 March 12UTC the Occlusion with clouds of high probability for precipitation crossed the Alps (Fig 4.7). The gradient of the equivalent thickness is decreasing, so the whole system is weakening fast.
Figure 4.7: 11.3.2010 12UTC - MSG IR 10.8 with overlay NWCSAF Precipitating Clouds and SatRep; green lines: ECMWF Equivalent Thickness
Figure 4.8: INCA 24h RR Analysis [mm] - Image 1: 9.3. 6UTC; Image 2: 10.3. 6UTC; Image 3: 11.3. 6UTC; Image 4: 12.3. 6UTC; (push the STOP (beginning) button to start with the fist image, then click step forward for the next images)
Figure 4.9: 24h Fresh Snow Report [cm] - Image 1: 9.3. 6UTC; Image 2: 10.3. 6UTC; Image 3: 11.3. 6UTC; Image 4: 12.3. 6UTC; (push the STOP (beginning) button to start with the fist image, then click step forward for the next images)
For this event a detailed comparison of the 65 fresh snow reports [cm] (Fig 4.9) with the INCA precipitation analysis [mm] (Fig 4.8) was done. For each snow report an INCA RR equivalent was searched and a conversion factor was calculated. The result is a mean conversion factor from 1.2 which is independent from temperature. That means 1mm liquid precipitation (in this event) is equivalent to 1.2cm fresh snow. This supports the often used generalisation: 1mm to 1cm.
The heavy snowfall which was expected from the forecasters and the established NWP's not completely occurs. In large parts of Carinthia the awaited fresh snow appears. In the very south in some places up to 30cm were measured. In Styria and basically in Lower Austria and Vienna this snow event was overestimated. On the one hand the used NWP´s computed too much precipitation in this region, on the other hand the snowfall limit was calculated to low. While snowfall down in the lowlands was expected by some NWP's, the precipitation in many regions falls as liquid rain.
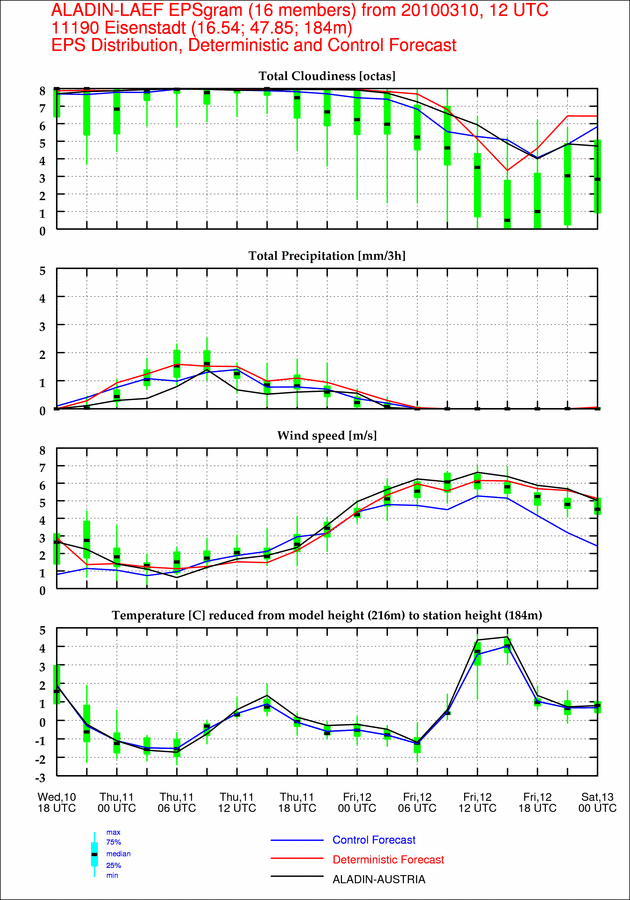
On the 11.03.2010 6-15cm fresh snow for large parts of East Austria for the period from 11.03.2010 6UTC to the 12.03.2010 6UTC with a snowline at ground level were forecasted. The verification (Fig 4.9; 12. March 6UTC) shows that nearly no fresh snow occurs in this region. The precipitation intensity was lower as from some NWP's estimated and the snowline was higher as predicted. The Aladin-LAEF EPSgram from 10.03.2010 12UTC (Fig 4.10) shows that the most precipitation should fall as snow, but it is very close and the possibility for rain was given. On the 12. March the advected warm Mediterrean air reaches the ground with stronger wind and as result with temperatures up to 4°C.
Figure 4.10: Aladin-LAEF EPSgram (run 20100310 12UTC) for Eisenstadt
Fig 4.11: By comparison between the two Temps from Graz from the 9th and 10th we see the heavy WA between 300 and 800 hPa in 24h. On 10 March at 03UTC the sounding over Graz shows a strong frontal zone between 750 and 800 hPa. The hodograph shows still WA in all heights. If the front will reach the ground the temperatures near the ground will increase into positive zones between 0° and 10°C, and the precipitation will fall as rain. In the winter season the advected warm air often does not reach lower levels but with enough wind or enough forcing it is definitely possible. On the 13 March at 03UTC we see, that the described process appears, with exception of the flat surface inversion which dissipate over the day.
Figure 4.11: Soundings Graz
Fig 4.12: The hodograph over Vienna on the 9 March 0UTC shows WA in most heights of the troposphere. This is verified by the increased temperature profile from the 10 March. Still WA is shown by the clockwise change in wind direction with height. Similar like on the sounding over Graz (one day before), on the 11 March at 12 UTC over Vienna the sharp frontal area is located between 700 and 800 hPa. With the close up of the surface front from the south and enough wind in lower levels, positive temperatures are possible. But this was not good enough forecasted by some NWPs. On the TEMP from the 12 and 13 March 12UTC we can see the verification of this presumption. By these sufficient positive °C temperature, we see in the measurements, it's not a surprise that the precipitation can fall as liquid rain, but it is easy to be wise after the event.
Figure 4.12: Soundings Vienna
