Chapter III: Fire Detection and Monitoring
Table of Contents
- Chapter III: Fire Detection and Monitoring
-
- Introduction
-
- Night Microphysics RGB
-
- RGB HRV from MSG/SEVIRI
-
- Moderate Resolution Imaging Spectroradiometer (MODIS)
-
- FRP-PIXEL product
Introduction
MSG/SEVIRI satellites have several channels suited to the remote detection of forest fires. The IR 3.9 µm channel is widely used for fire detection and fire products due to its responsivity to temperature and sub-pixel response (for further details see http://www.eumetrain.org/resources/forest_fires.html). On the other hand, visible images are adequate for detecting smoke. Several RGB composites are also suitable for detecting hot spots. When using geostationary satellites such as MSG, the high temporal resolution is useful in monitoring the fire's life cycle. Conversely, polar-orbiting satellite images such as those provided by MODIS or AVHRR sensors allow an easier detection of hot spots and smoke plumes due to the higher spatial resolution. However, their low sampling frequency makes these satellites unsuitable for following the life cycle of detected fires. The Caramulo fires were suited to studying the strengths and drawbacks of different remote sensing techniques in fire monitoring.
Night Microphysics RGB
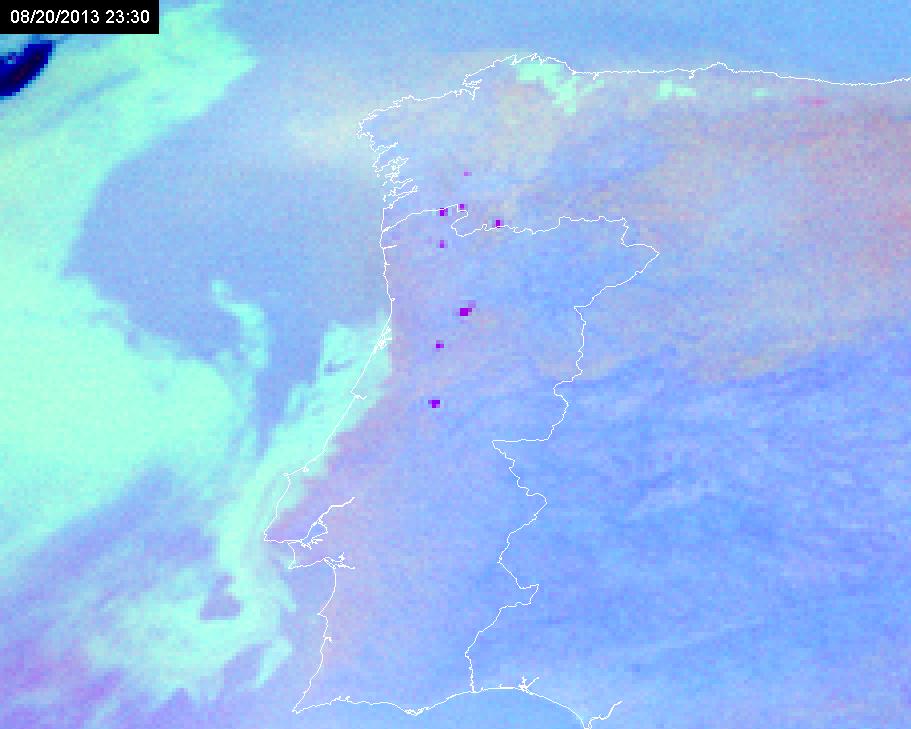
One of the biggest fires in Caramulo started as the result of arson. The first hot spot is visible on the Night Microphysics RGB at 20 August 2013 at 23:30 UTC (Figure 6). The Red beam is associated to the difference of IR 12.0 µm and IR 10.8 µm, the Green beam to difference between IR10.8 µm and IR3.9 µm and the Blue beam to the IR10.8 µm channel. The magenta color results from high values on the red and blue beams and low values on the green beam.
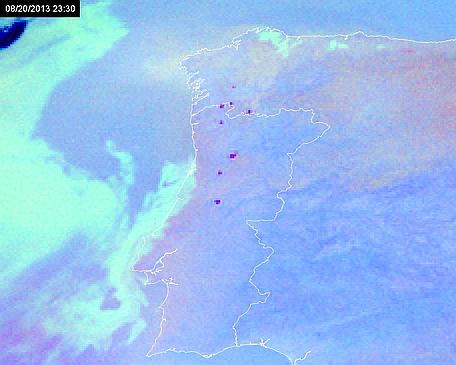
Figure 6: MSG Night Microphysical RGB, 20 August 2013 at 23:30 UTC. Magenta pixels indicate the fires. Source: IPMA.
The main advantage of this RGB is that it allows the detection of hot spots during the night, when VIS images are not available.
RGB HRV from MSG/SEVIRI
The high temporal sampling of geostationary satellites maximizes the probability of early detection of the smoke plume. The HRV RGB has HRV as the red and green components and IR10.8 as the blue one, and provides high resolution information of the smoke plume. On 21 August the smoke plumes became visible around 15:30 UTC (Loop 1). At this time the wind was blowing from the west and the smoke plume, although observable, was not easily distinguishable against the land surface.
Loop 1: HRV RGB from MSG/SEVIRI on 21 August 2013 from 15:00 UTC to 18:00 UTC, smoke plume visible from 15:30 UTC on
- Chapter III: Fire Detection and Monitoring
- Introduction
- Night Microphysics RGB
- RGB HRV from MSG/SEVIRI
- Moderate Resolution Imaging Spectroradiometer (MODIS)
- FRP-PIXEL product
Introduction
MSG/SEVIRI satellites have several channels suited to the remote detection of forest fires. The IR 3.9 µm channel is widely used for fire detection and fire products due to its responsivity to temperature and sub-pixel response (for further details see http://www.eumetrain.org/resources/forest_fires.html). On the other hand, visible images are adequate for detecting smoke. Several RGB composites are also suitable for detecting hot spots. When using geostationary satellites such as MSG, the high temporal resolution is useful in monitoring the fire's life cycle. Conversely, polar-orbiting satellite images such as those provided by MODIS or AVHRR sensors allow an easier detection of hot spots and smoke plumes due to the higher spatial resolution. However, their low sampling frequency makes these satellites unsuitable for following the life cycle of detected fires. The Caramulo fires were suited to studying the strengths and drawbacks of different remote sensing techniques in fire monitoring.
Night Microphysics RGB
One of the biggest fires in Caramulo started as the result of arson. The first hot spot is visible on the Night Microphysics RGB at 20 August 2013 at 23:30 UTC (Figure 6). The Red beam is associated to the difference of IR 12.0 µm and IR 10.8 µm, the Green beam to difference between IR10.8 µm and IR3.9 µm and the Blue beam to the IR10.8 µm channel. The magenta color results from high values on the red and blue beams and low values on the green beam.
 |
| Figure 6: MSG Night Microphysical RGB, 20 August 2013 at 23:30 UTC. Magenta pixels indicate the fires. Source: IPMA. |
The main advantage of this RGB is that it allows the detection of hot spots during the night, when VIS images are not available.
RGB HRV from MSG/SEVIRI
The high temporal sampling of geostationary satellites maximizes the probability of early detection of the smoke plume. The HRV RGB has HRV as the red and green components and IR10.8 as the blue one, and provides high resolution information of the smoke plume. On 21 August the smoke plumes became visible around 15:30 UTC (Loop 1). At this time the wind was blowing from the west and the smoke plume, although observable, was not easily distinguishable against the land surface.
| Loop 1: HRV RGB from MSG/SEVIRI on 21 August 2013 from 15:00 UTC to 18:00 UTC, smoke plume visible from 15:30 UTC on |
Moderate Resolution Imaging Spectroradiometer (MODIS)
The high spatial resolution of the MODIS on NASA's Aqua satellite allows an easier detection of the fire smoke plume (Figure 8) although the low temporal sampling doesnt allow following its life cycle.
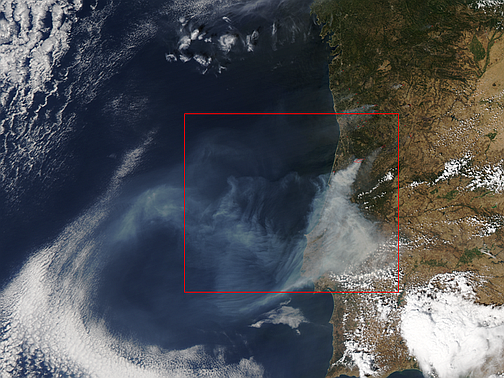
| Figure 7: This MODIS image shows the Caramulo fire on 29 August 2013. The fires are outlined in red, and dense smoke is drifting west over the Atlantic Ocean. Source: NASA Earth Observatory. |
FRP-PIXEL product
The FRP-PIXEL product is computed by the LSASAF and allows estimating the fire radiative power in a given pixel. It is computed from the brightness temperatures of IR3.9 µm IR10.8 µm and the differences between these channels. In addition, several conjectural tests are performed applying the so called MIR method. This method assumes that FRP is proportional to the difference between the observed fire pixel radiance in the MIR channel (IR3.9 µm) and the "background" radiance that would have been observed at the same location in the absence of fire. For the Caramulo the FRP for the fire life cycle (Figure 8) was 3680MW which corresponded to a total of Fire Radiative Energy of 1030x108 MJ.
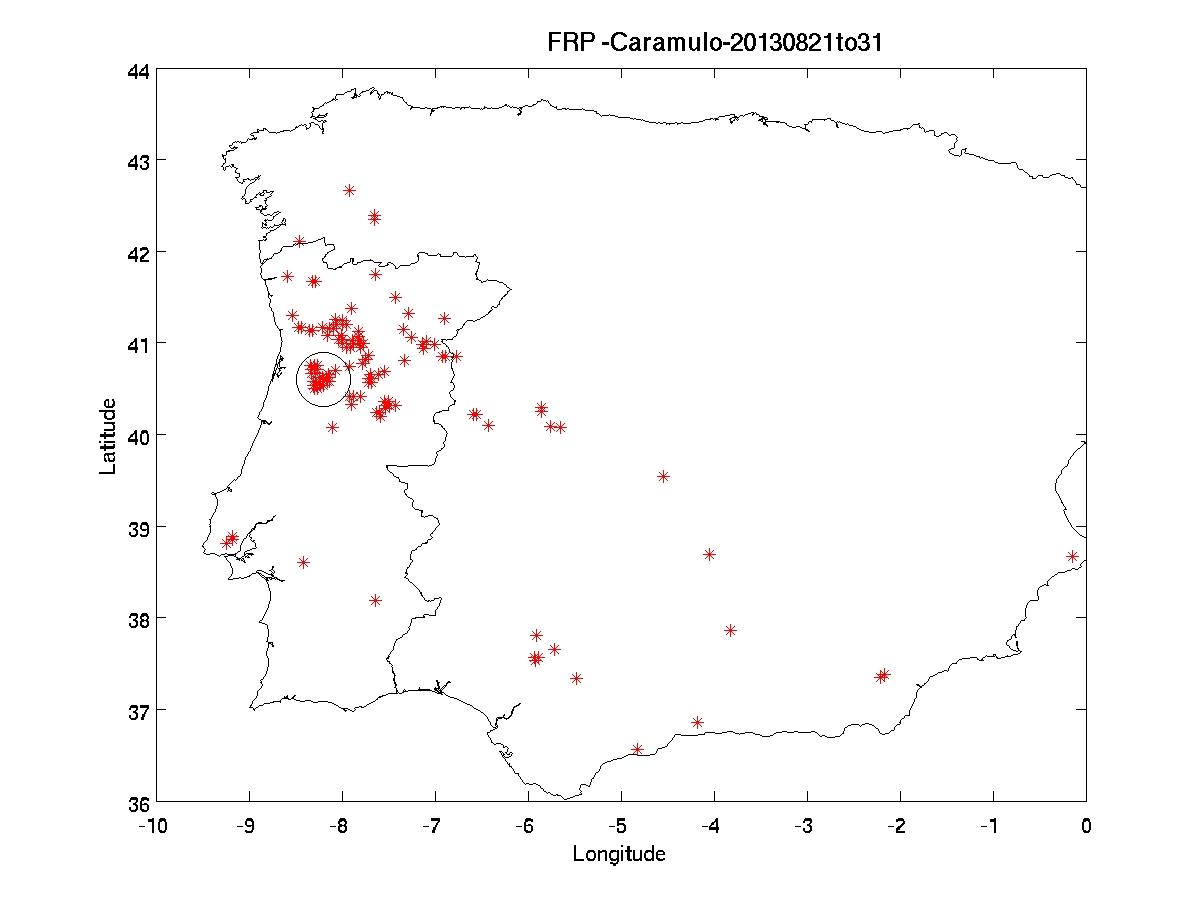 |
| Figure 8: Hot spots obtained from LSA SAF FRP-PIXEL between 21 and 31 August 2013. The Caramulo fires are marked with a circle. |