Dear forecaster, your shift is over now!
Thank you for advising the pilot and making a difficult and responsible decision.
If you want, you can now go through this feedback page in order to review the case.
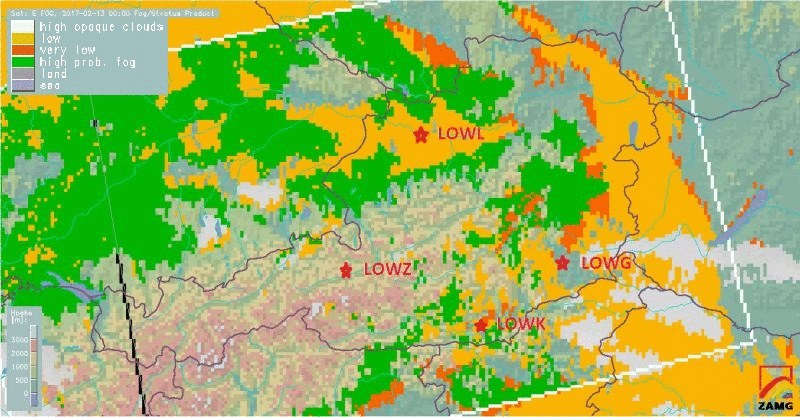
To start with, we use satellite based data to get an overview of the cloud and fog situation in the very morning, here the cloud type fog product at 03 UTC:
 |
 |
Figure 1
The simulator data first leads you through the larger-scale synoptic patterns. Note here how the upper layer high pressure system moves from Scandinavia to the south, towards Austria. Higher pressure generally means sinking air masses, hence descending dry air from higher levels. This plays a role for our fog situation because a) there is synoptic movement and b) the moist (foggy) air gets slowly replaced by dryer air north of the Alps.
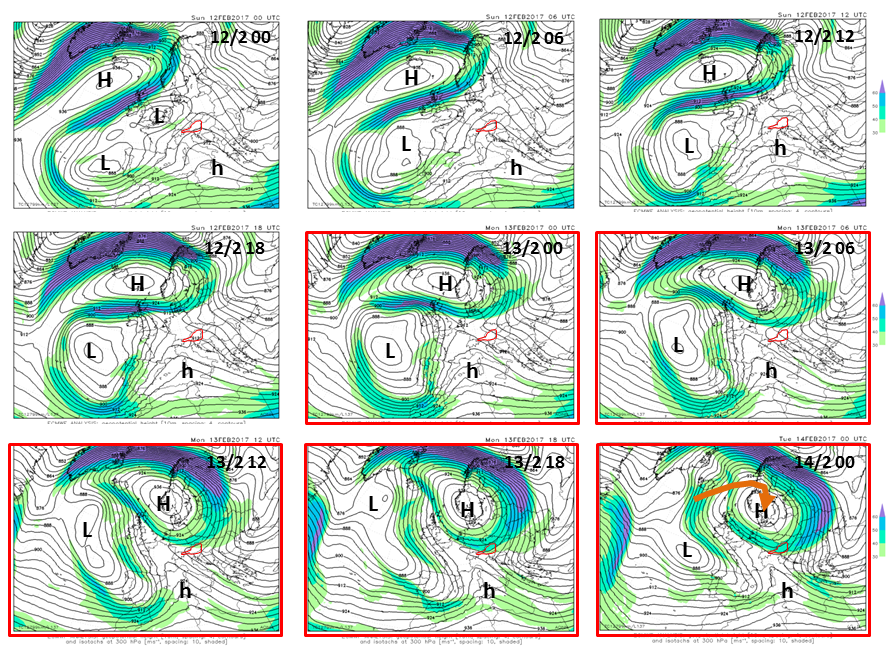
Figure 2
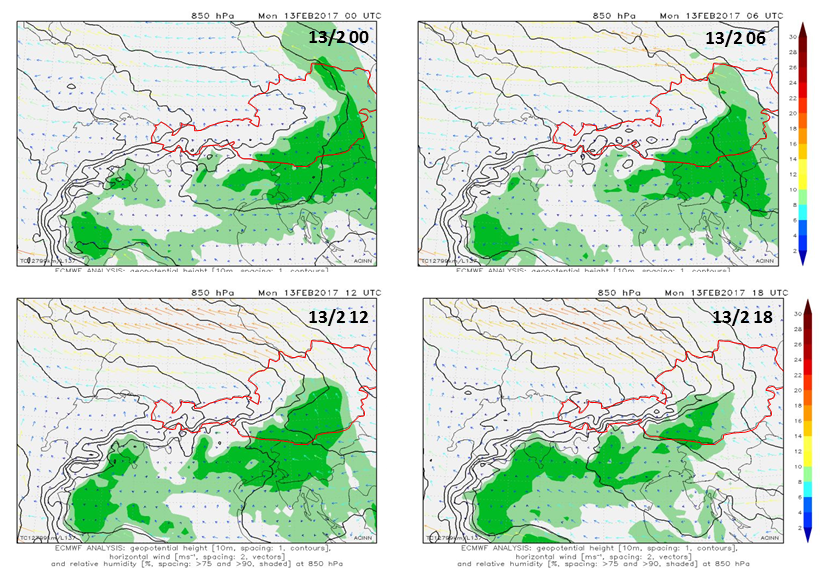 |
Although this humidity forecast charts are valid for the level of 850 hPa and not for the surface, the temporal development demonstrates the advection of dry air from the north-east. Be aware that this process happens above the inversion layer! Also wind arrows are included but the (coarse) model resolution of ECMWF has to be considered. |
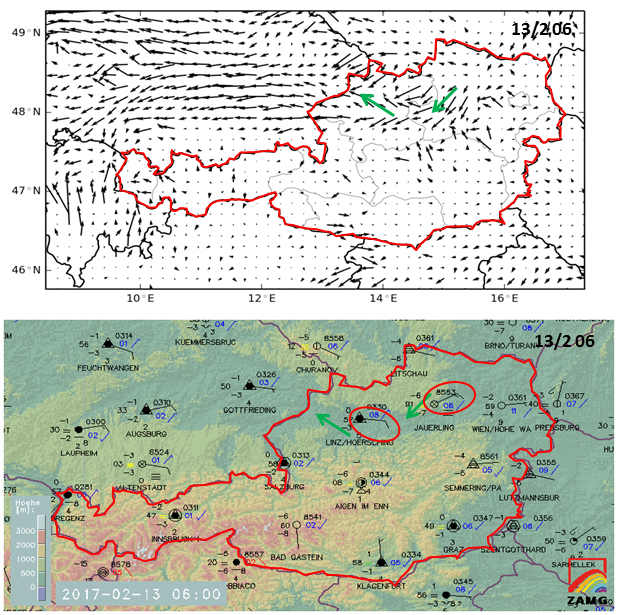 |
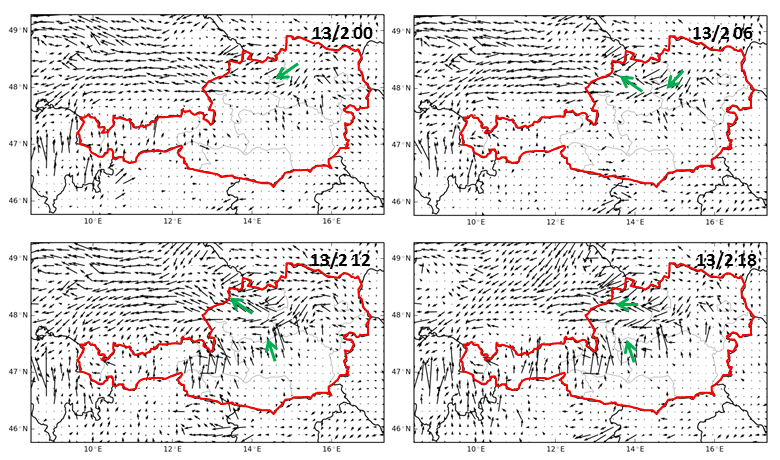
In comparison, take the wind field of the regional model. It shows moderate winds north of the Alps (north-easterly and south-easterly direction) and weak winds south of the Alps with no specific direction. Also higher wind speeds with southerly directions are forecasted for the mountainous areas. The green arrows indicate the major wind directions. |
Figure 3a-3b
 |
We can verify the regional model with the synop observations: For most of the time steps the predicted wind directions match with the observed ones quite well, as you can see in this example. This can be used in order to put more trust into future time steps (e.g. 07, 08, 09 UTC). Why is the wind direction and velocity important for this case? The combination of the dry air advection that is discussed above and the surface wind seem to have a notable influence on the fog or low stratus movement although the dry air advection takes place in upper levels (850 hPa). |
Figure 4
This matter can be highlighted by satellite images:
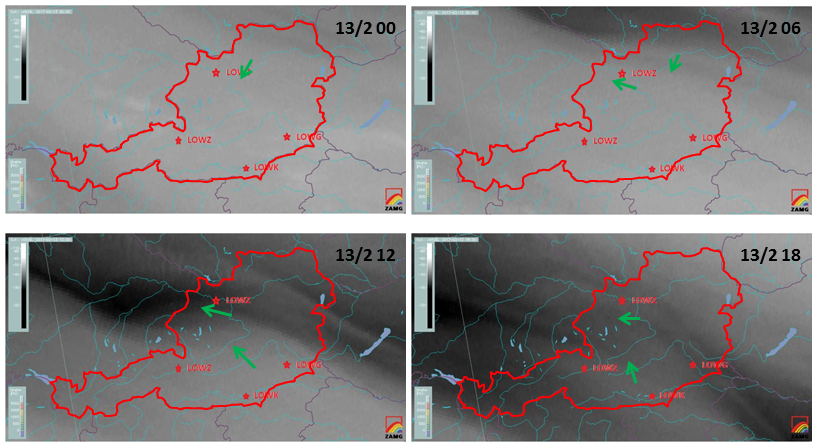
Figure 5
The satellite water vapour (WV 6.2) images from 00 UTC to 18 UTC (images above) show the advection (and subsidence) of dry air in the north-eastern parts of Austria.
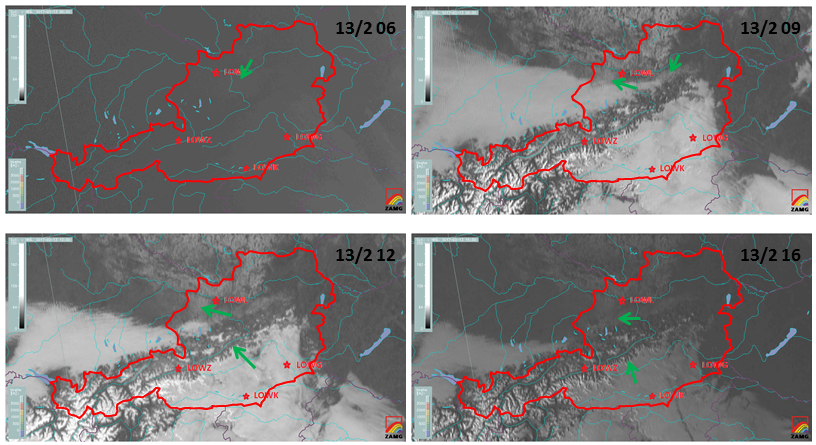
Figure 6
Also the high resolution visible channel (HRV) depicts this movement on the ground between 06 UTC and 16 UTC.
 |
|
Figure 7
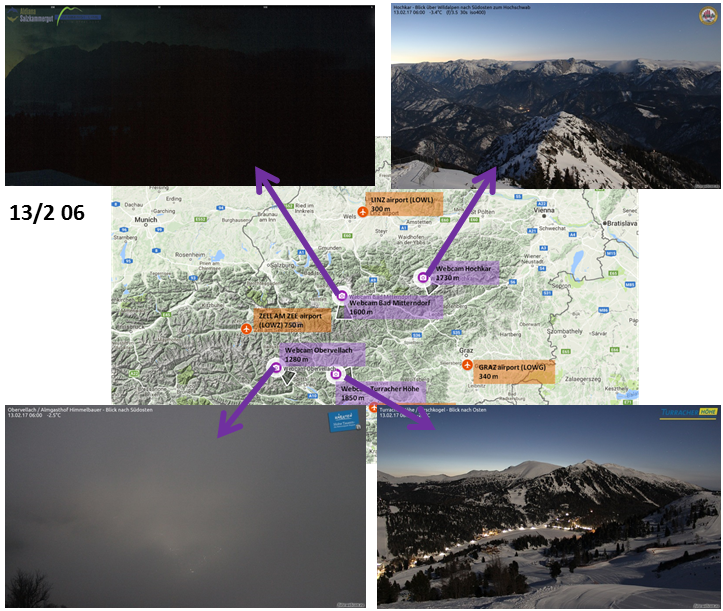
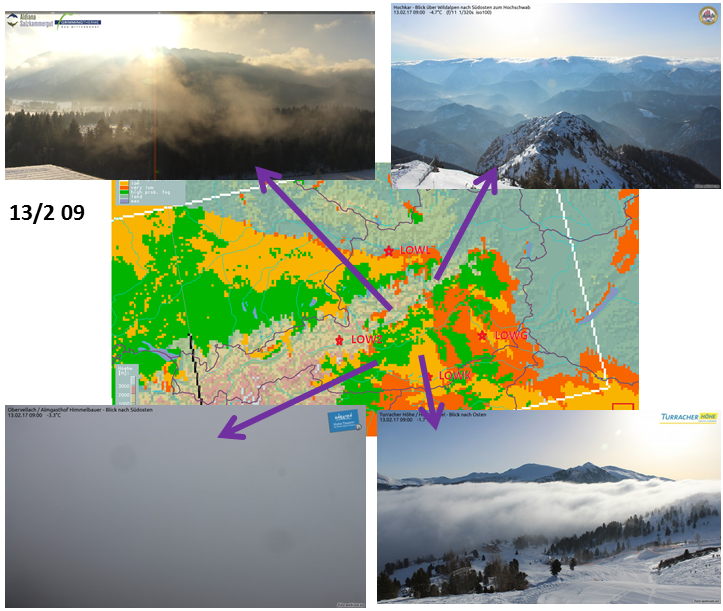
The cloud type fog product is very useful in order to detect areas with current fog or low stratus. This overview from February 13 00 UTC to 21 UTC reveals the development and movements quite well, although it has to be mentioned that some images between 05 and 07:15 UTC are missing or buggy.
While the northern fog layer moves (or dissolves) rather rapidly till the afternoon, there is much less progress in the south, most likely due to very weak wind speeds and little synoptic forcing.
Eventually, the airport of Klagenfurt (LOWK) does not become free of fog till the end of the day and also Graz (LOWG) remains foggy until 20 UTC. So, the only remaining option on that day is the flight from airport Linz (LOWL) to Zell am See (LOWZ).
The following webcam snapshots from 06, 09, 12 and 15 UTC round out the scenario of dissipating fog in the north and stagnating or densifying fog in the south.
 |
 |
 |
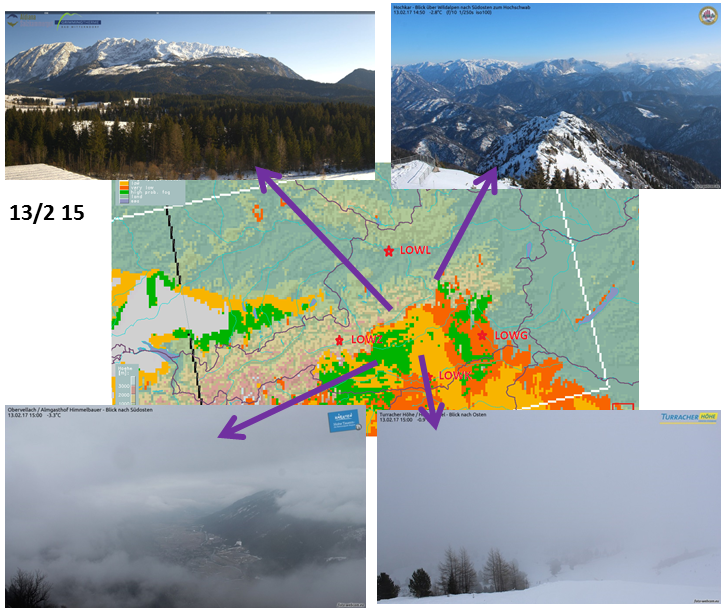 |
Figure 9a-9d
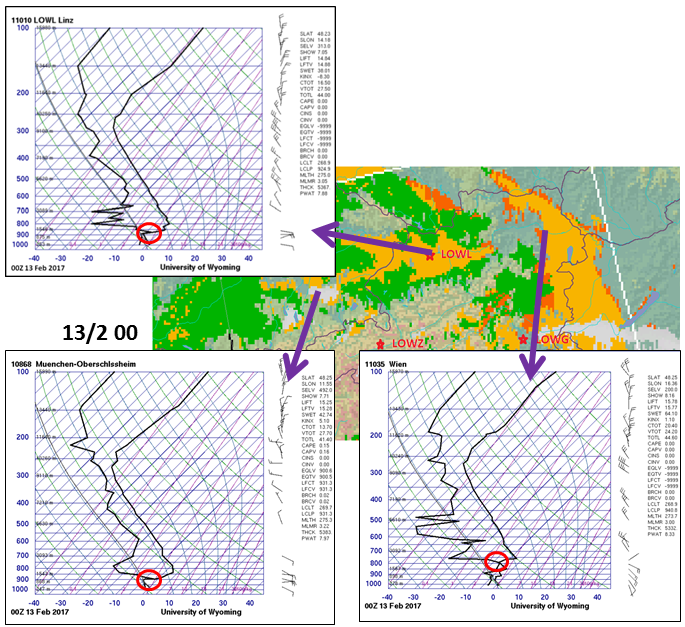
Eventually a look at the radiosoundings at two different time steps (00 and 09 UTC) reveals the dry air intrusion in Vienna and Munich. The 00 UTC measurements are included in the 09 UTC radiosoundings as green and red dotted lines which makes it easier to compare over time. The closer the two lines are the moister is the air at the corresponding level.
Unfortunately there is no second launch in Linz.
The red circle indicates the level with saturated air (temperature line and dew point temperature line one above the other).
Of course this is only a small fraction of what can be extracted from a radio sounding profile. In our case it is also interesting to look at the wind speeds at different heights and the temperature and dew point temperatures at the ground.
 |
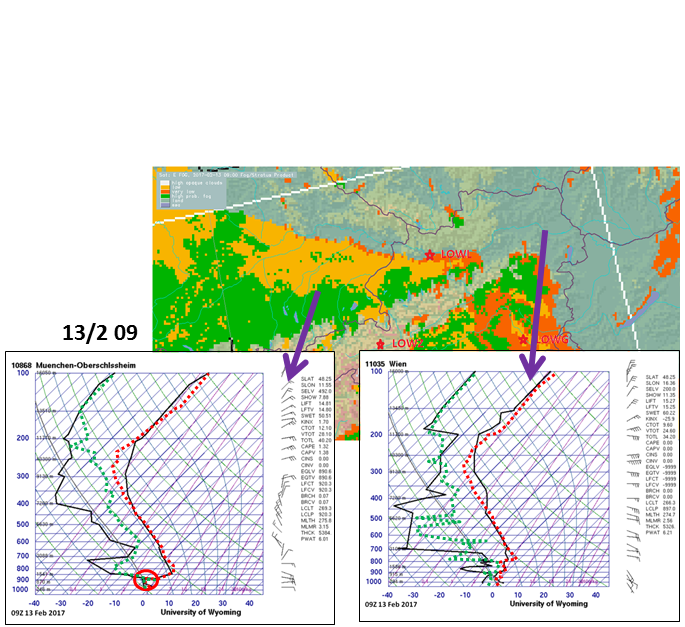 |
Figure 10a-10b
==================================================================
* TECHNICAL NOTE: For the best interactive experience throughout this module please use the most recent versions of Firefox or Internet Explorer browser!