Dear forecaster,
Thank you for completing this night shift from 1800 hours to 0300 hours in the office in Munich.
Here is a short piece of feedback about the weather situation during this time, how it develops during the night and what is the outcome in the morning.
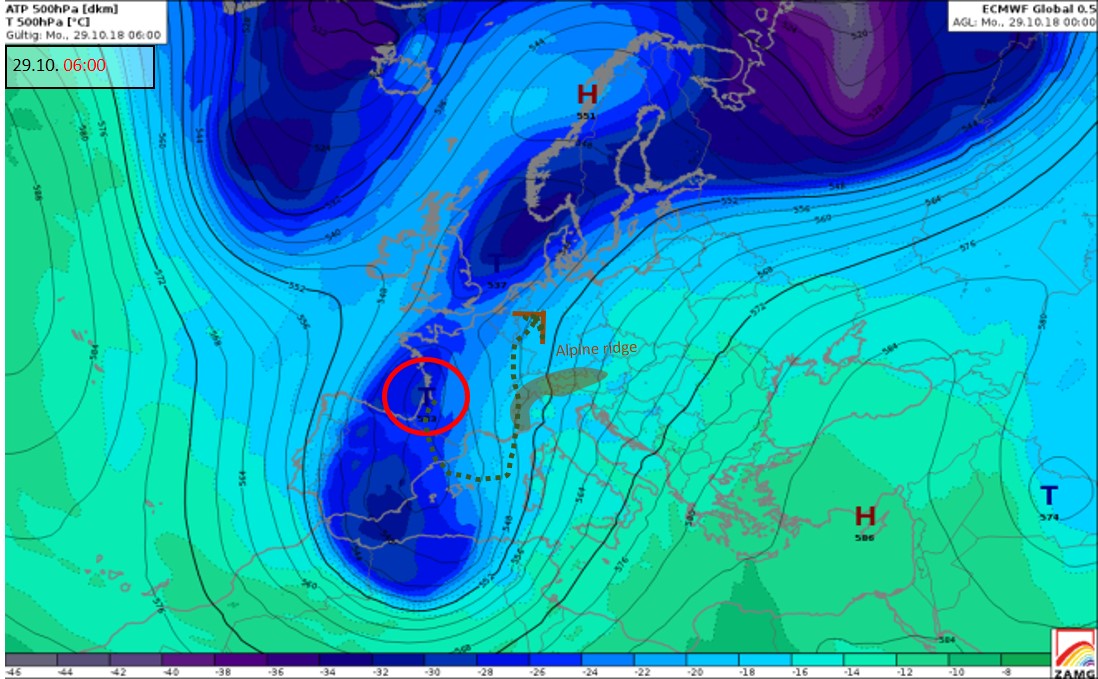
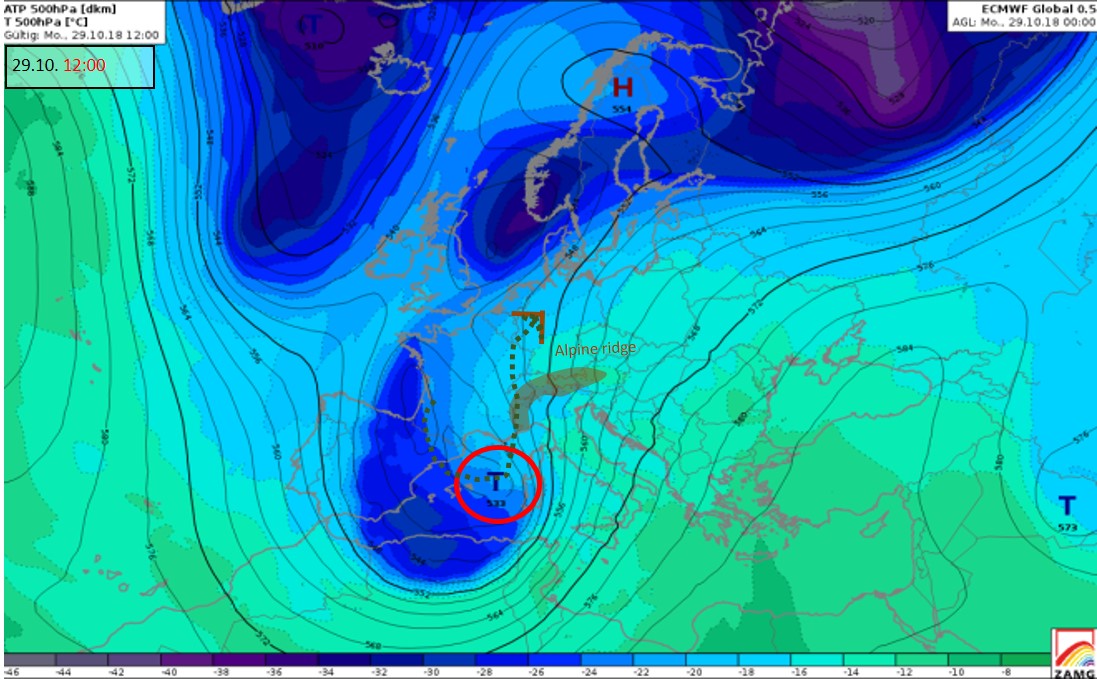
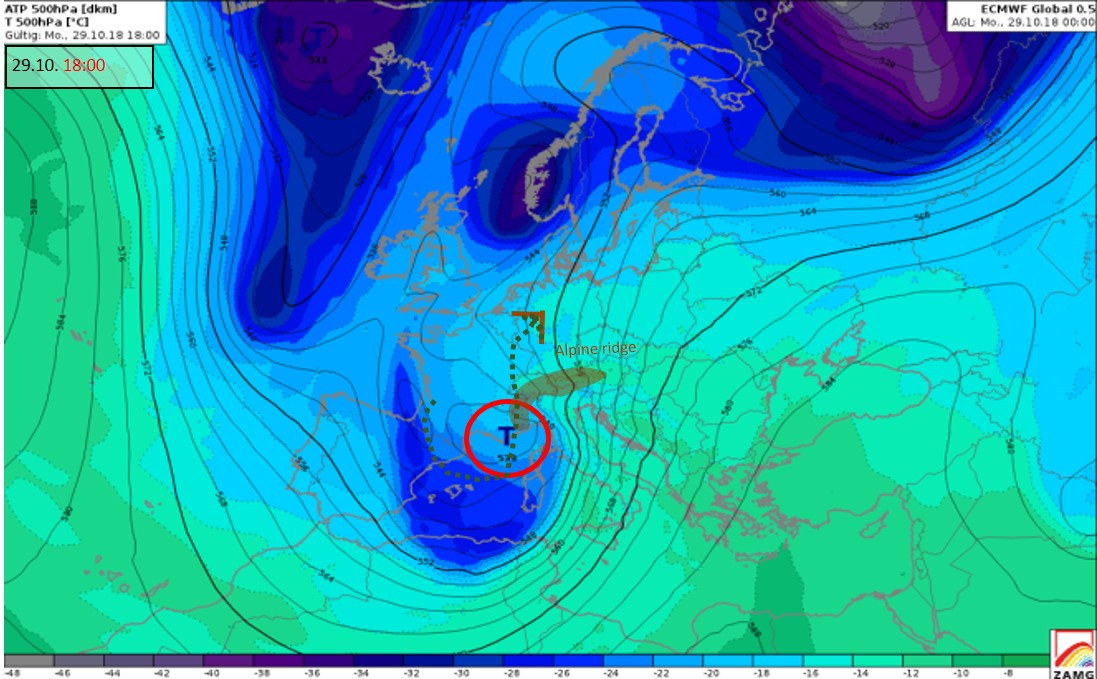
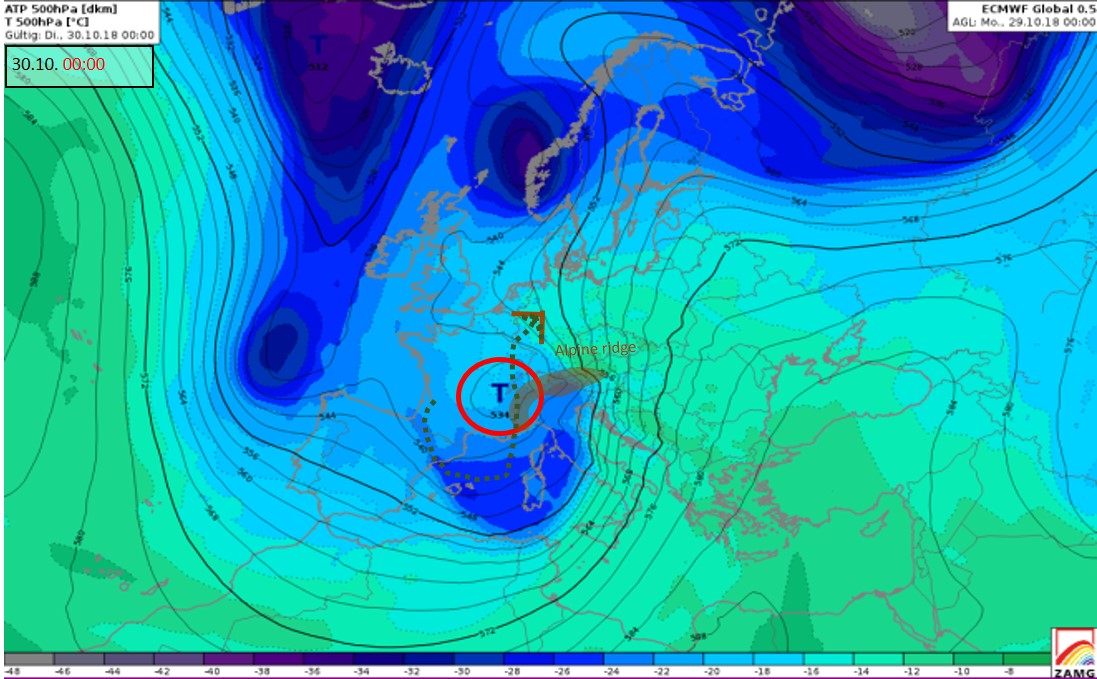
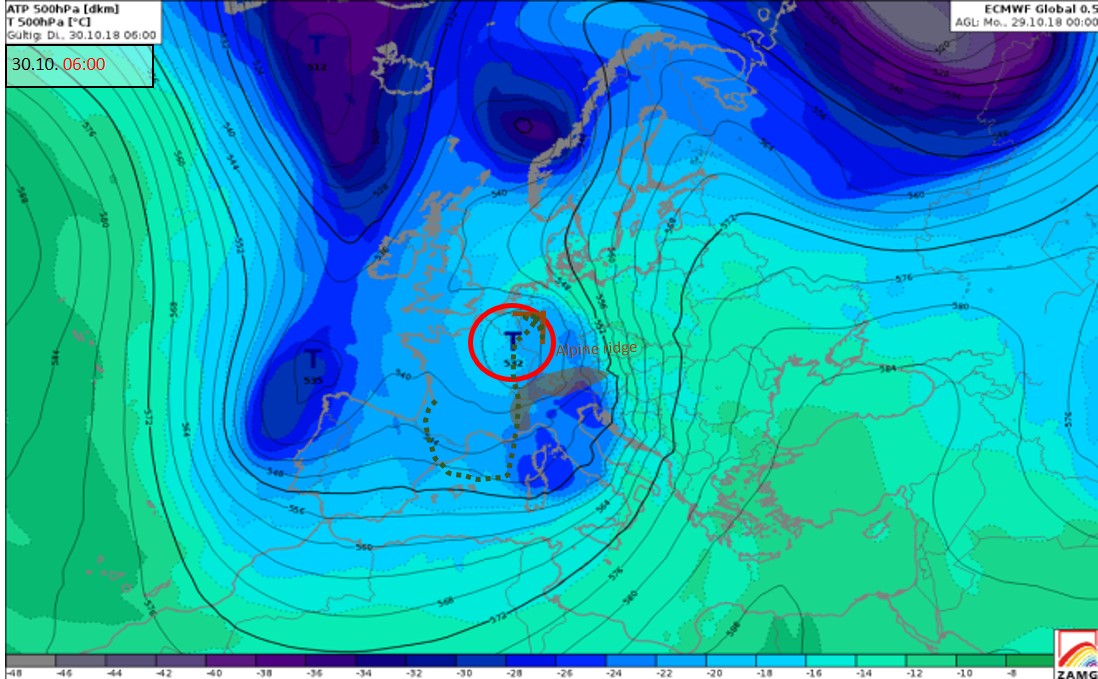
Large-scale weather pattern
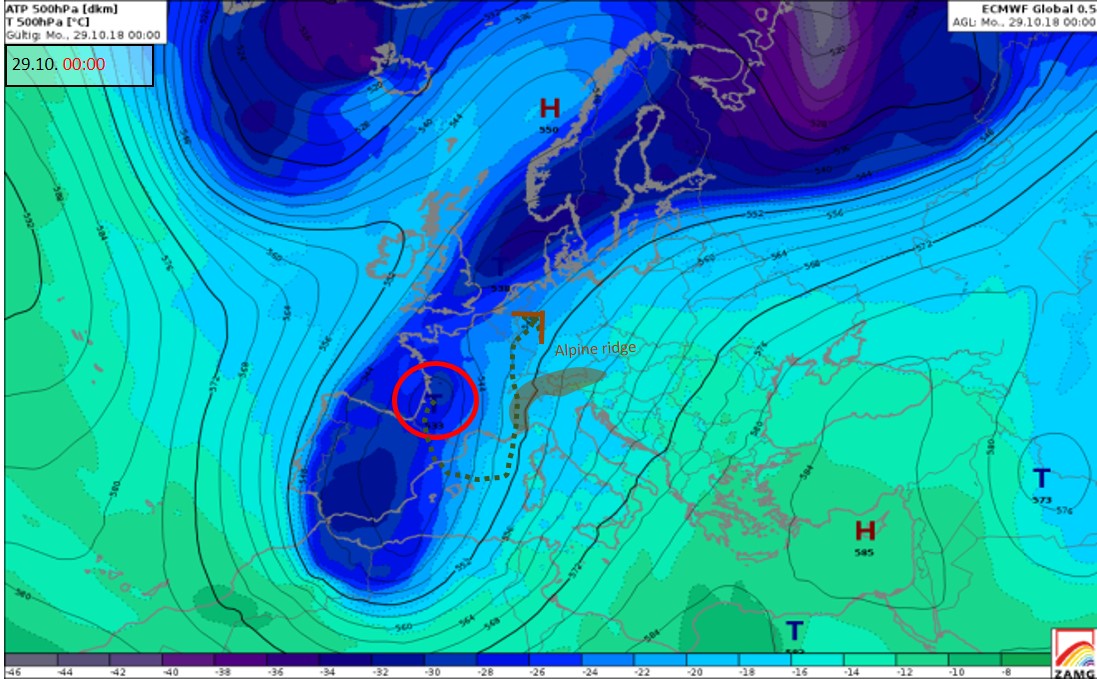
Figure 1: ECMWF geopotential height & temperature at 500 hPa, 29 October 00:00 UTC - 30 October 06:00 UTC. Cold front passes Alps from southwest, low moves north of the Alps.
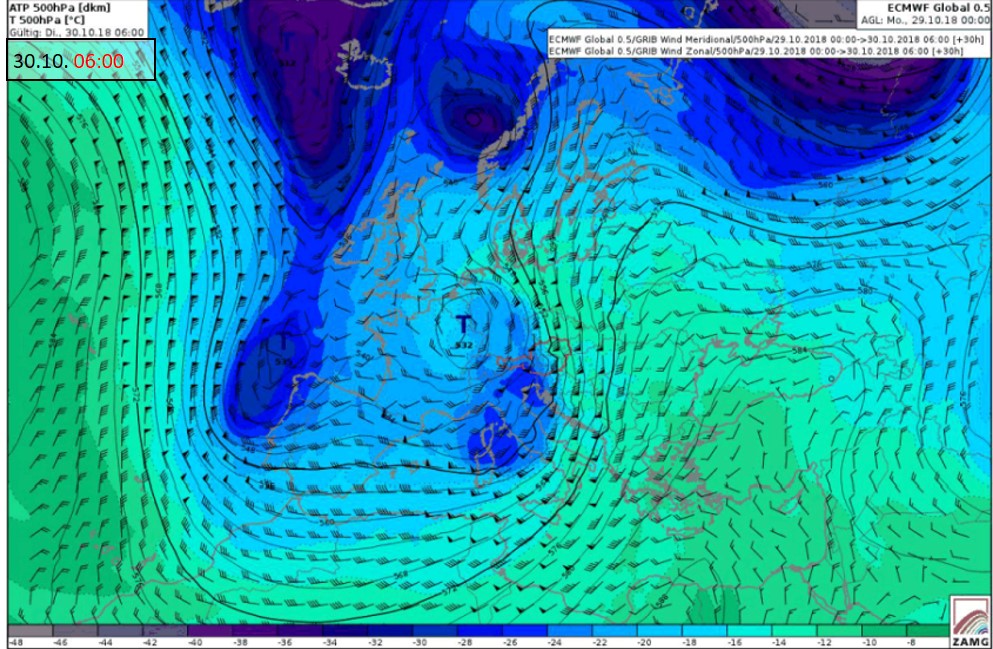
The ECMWF forecasted geopotential height and temperature at 500 hPa is a very good place to start, to find out what is going to happen within the next few hours.
At the beginning of the day (29.10. 00:00) a very steep trough lies over Scandinavia down through northern France, Spain and into north Africa. On the leading-edge it contains a cold front that bends towards the northeast in the following time steps (dark blue zone). Therefore the cold front extends and crosses the Alps from the south.
This is rather unusual - very often the cold fronts approach from northerly or westerly directions. At the same time this trough causes a well pronounced southerly flow across the Alps (the geopotential isolines are quasi-perpendicular to the Alpine ridge) at 500 hPa, e.g. 29.10. 18:00.
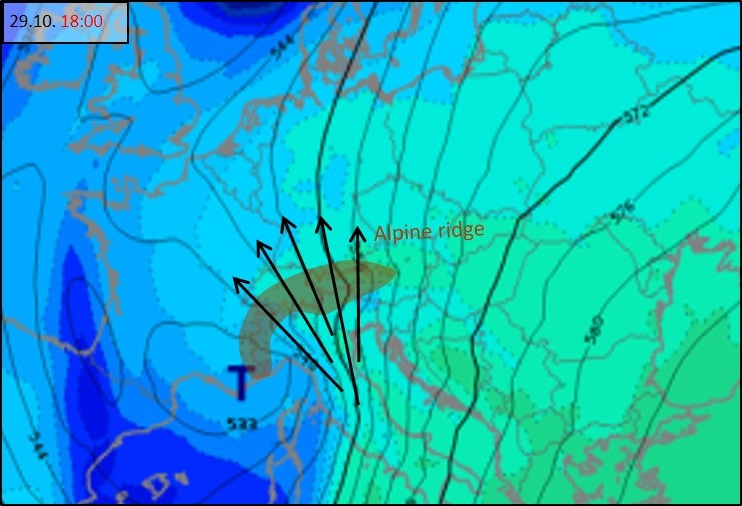
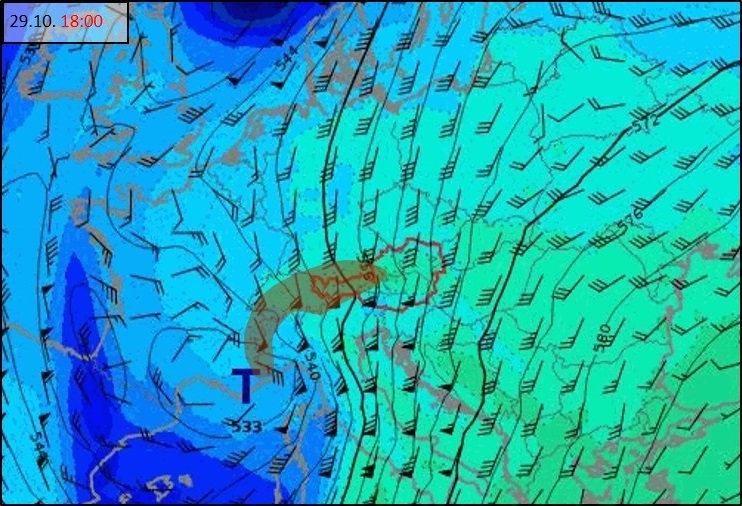
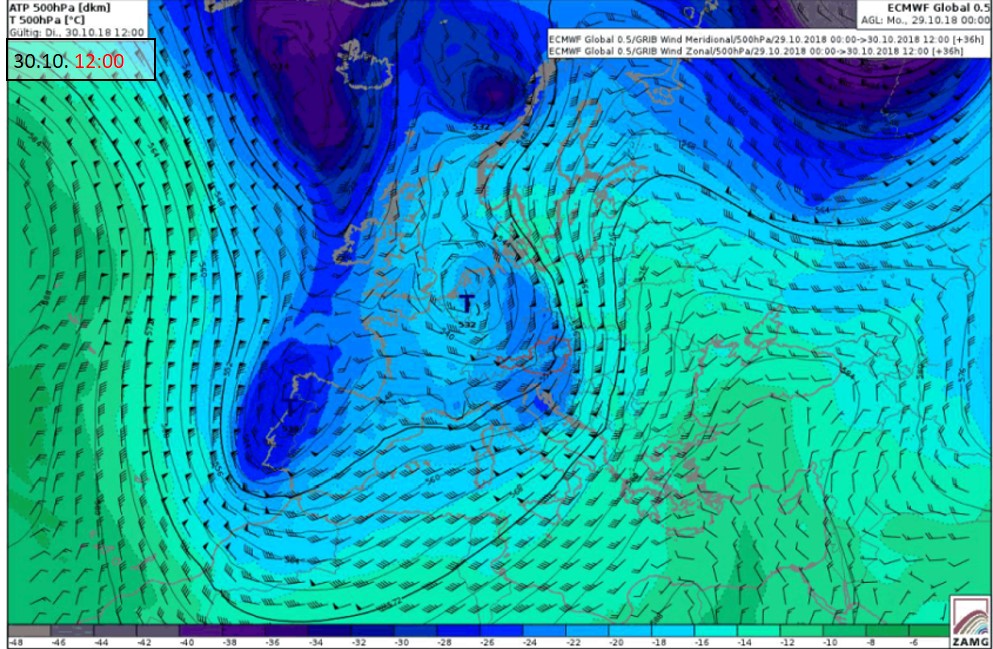
Figure 2 a) & b): ECMWF geopotential height, temperature at 850 hPa and the wind barbs at 500 hPa
The cold front is very clearly visible on the satellite images, here as an example the 24-hour microphysics RGB at 21:00:
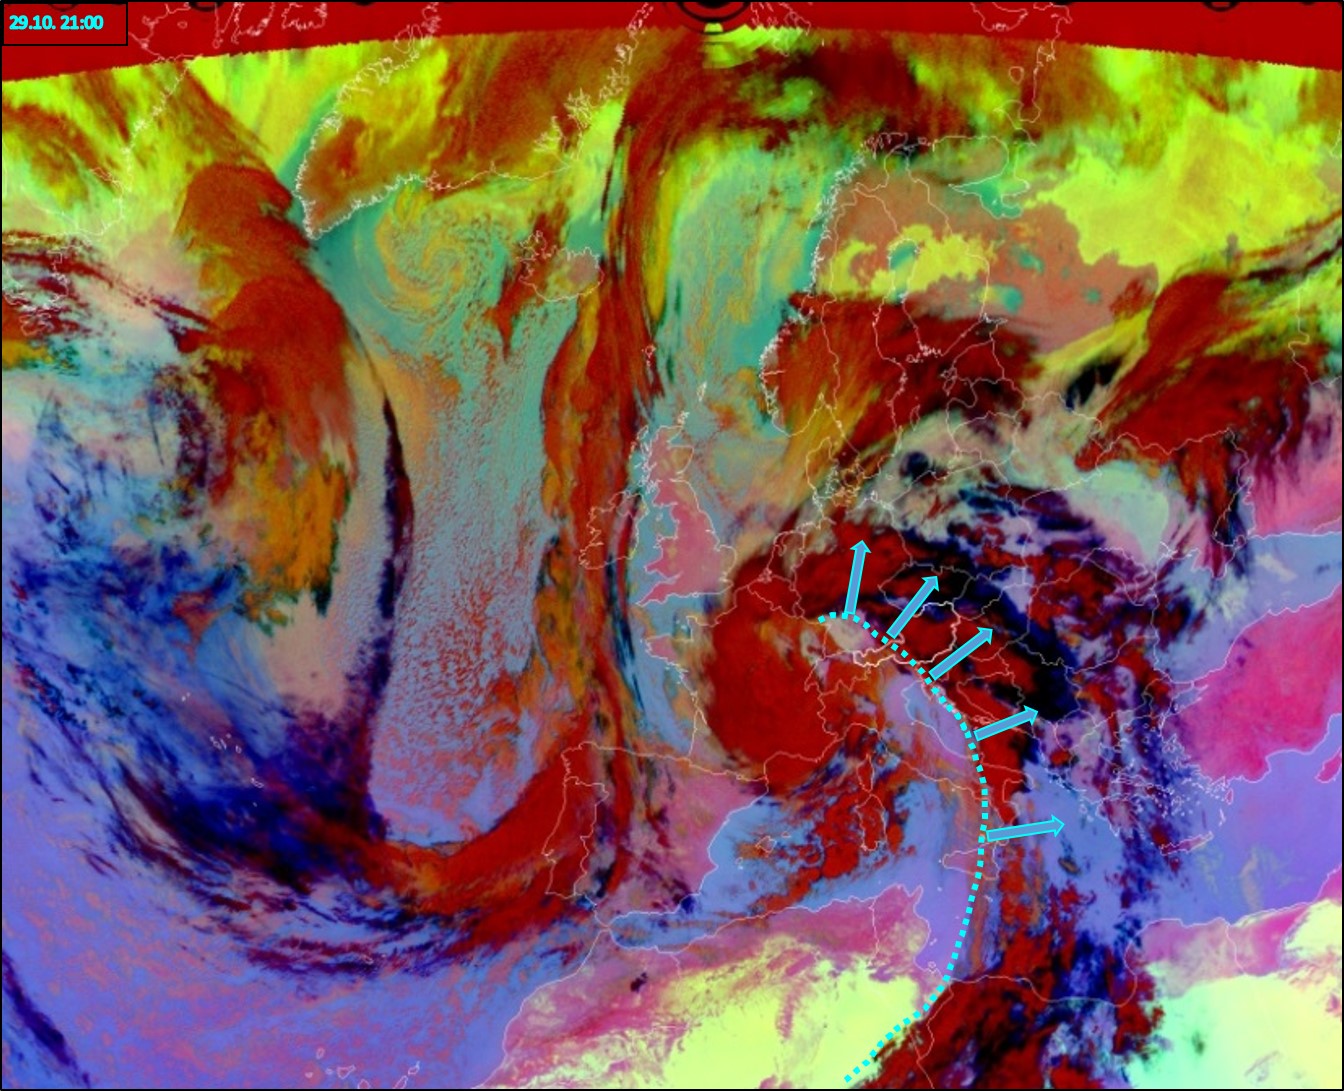
Figure 3: 24-hour microphysics RGB, 29 October 21:00 UTC. The cold front passes the Alps.
Before the cold front crosses the Alps (until 21:00), the weather stations in the region register the following weather features (see here an example of Lofer):
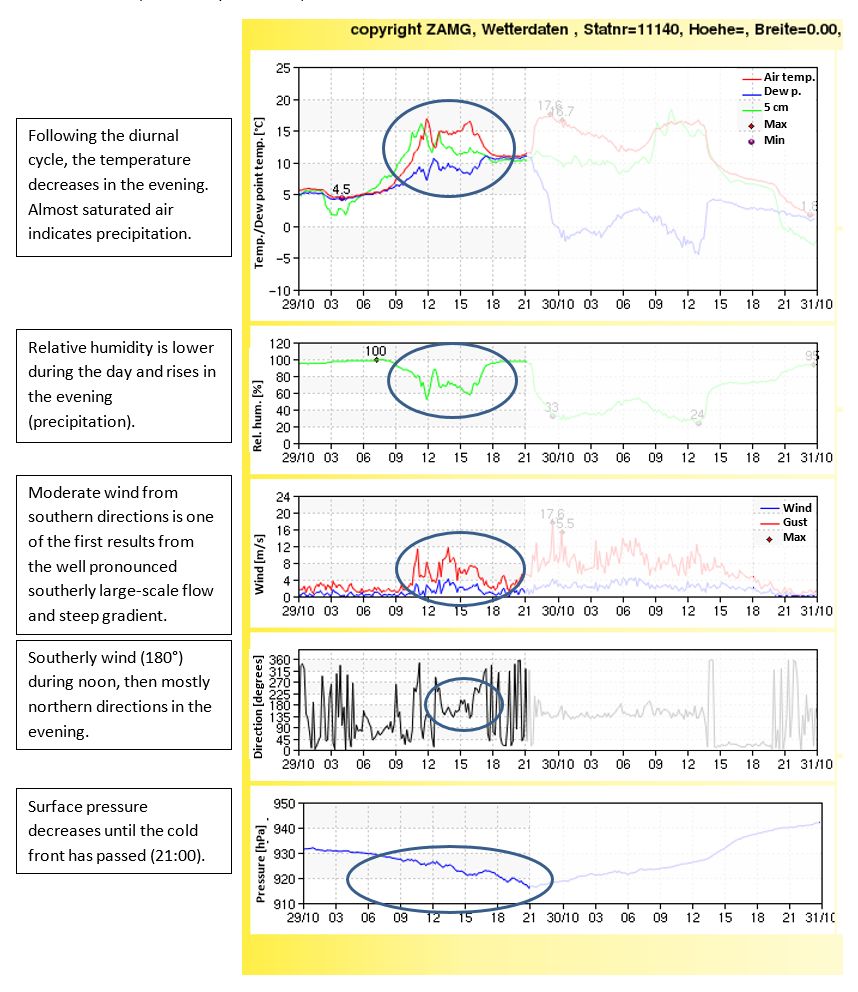
Figure 4: Weather station at Lofer with temperature, dew point temperature, relative humidity, wind speed, wind direction and pressure until 21:00 UTC.
Cold front crossing the Alps
Between approximately 2000 and 2200 hours the cold front passes over the Alps. The regions south of the Alps and inside the Alpine valleys are filled with cold air earlier than the region north of the Alps (e.g. Bavaria).
Animation: AROME 2m temperature, 29 October 19:00 UTC - 30 October 00:00 UTC. The cold front passes the Alps from the southwest.
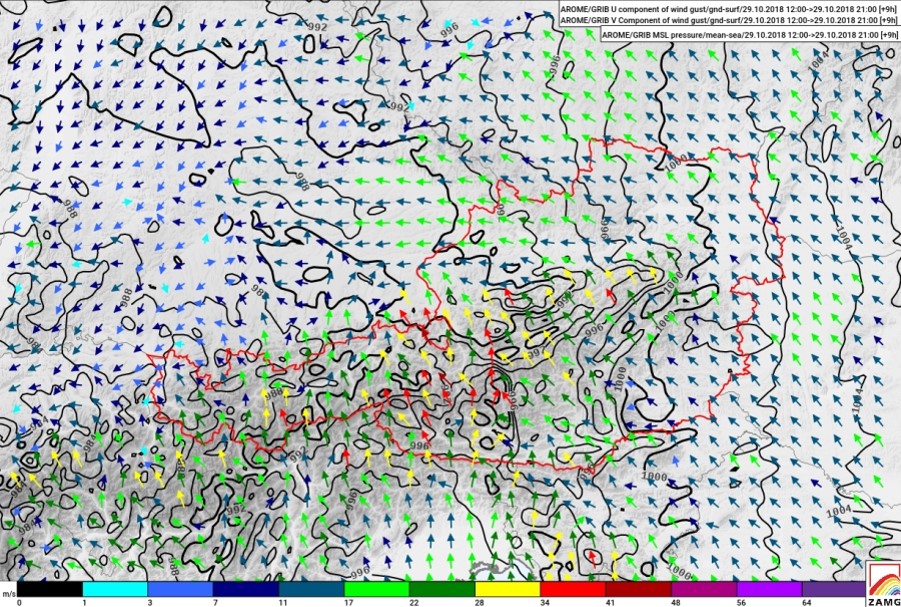
Figure 5: AROME surface wind gusts and surface pressure, 29 October 21:00 UTC. The cold air outflow causes strong wind gusts (red arrows).
When the cold front passes, the development at the station in Salzburg airport is the following:
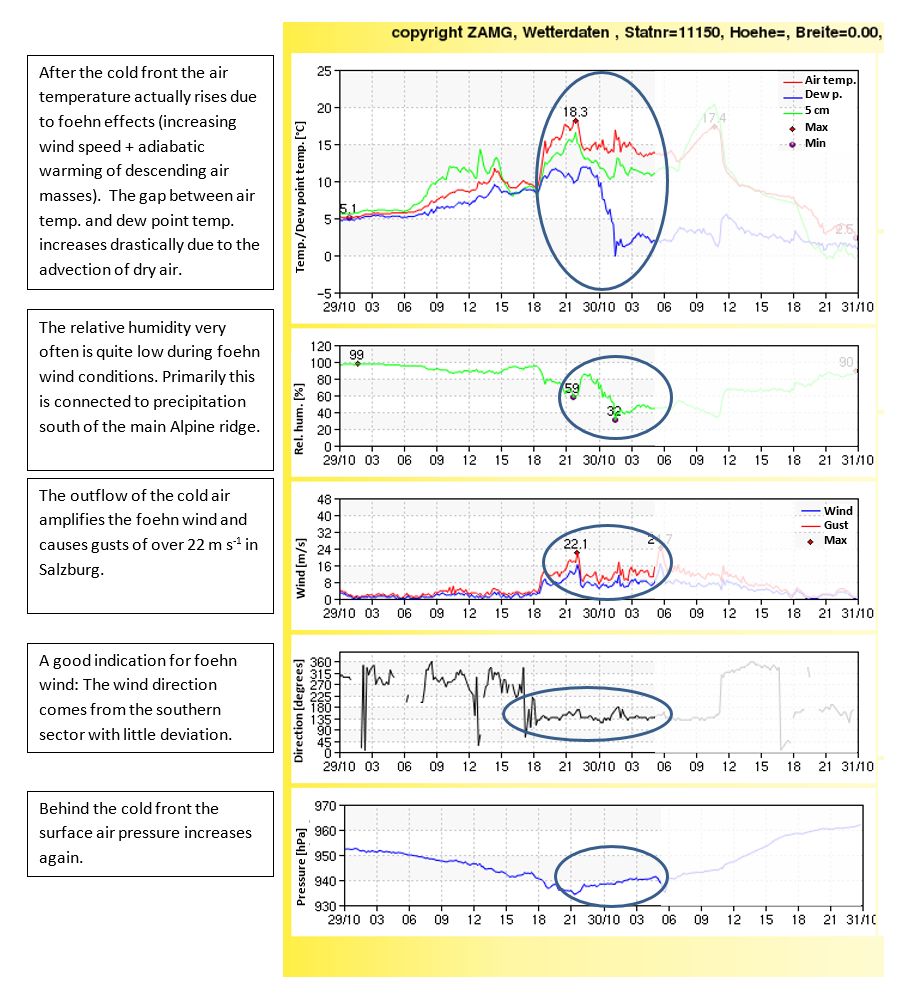
Figure 6: The weather station at Salzburg airport with temperature, dew point temperature, relative humidity, wind speed, wind direction and pressure until 05:00 UTC.
The foehn wind seems to persist until the morning with varying wind gust speeds, very high nocturnal temperature and dry air. So far the strong southerly flow and the cold air outflow from the cold front were the main trigger of the foehn wind. Later on, something else develops in addition to the foehn wind.
Pressure gradient deepens
For example, in the satellite images it can be observed that after the front has passed over the Alps the core of the low pressure system moves rapidly from southeast France over southwest Germany towards northern Germany:
Animation 24h microphysics Zoom
Animation: Satellite IR 10.8, 29 October 20:00 UTC - 30 October 18:00 UTC. The low moves rapidly towards northern Germany.
The continuation of the low pressure towards the northeast can also be observed with the forecasting charts for surface pressure.


Figure 7 a) and b): ECMWF surface pressure, a) 30 October 03:00 UTC, b) 30 October 06 UTC. The low moves to the east, the pressure gradient (N-S) deepens.
By this movement of the low the pressure gradient deepens between north and south of the Alps.
Using the hourly, regional model AROME the movement of the small-scale low is even better visible. A gradient of up to 15 hPa between southern Bavaria and south of Austria could develop through this process in the early morning hours:
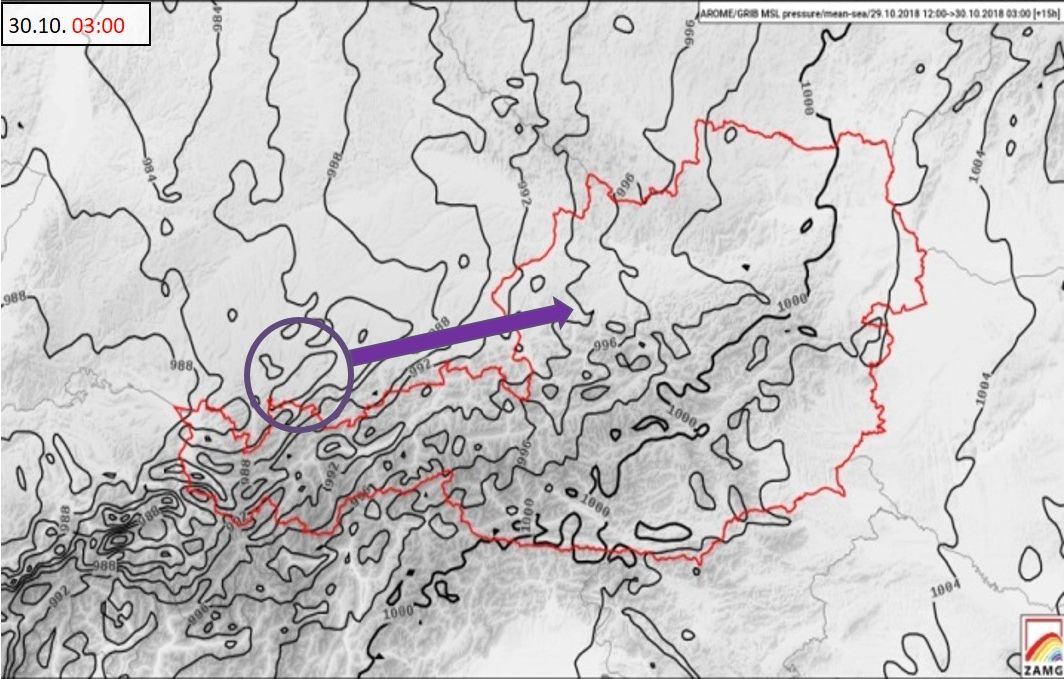
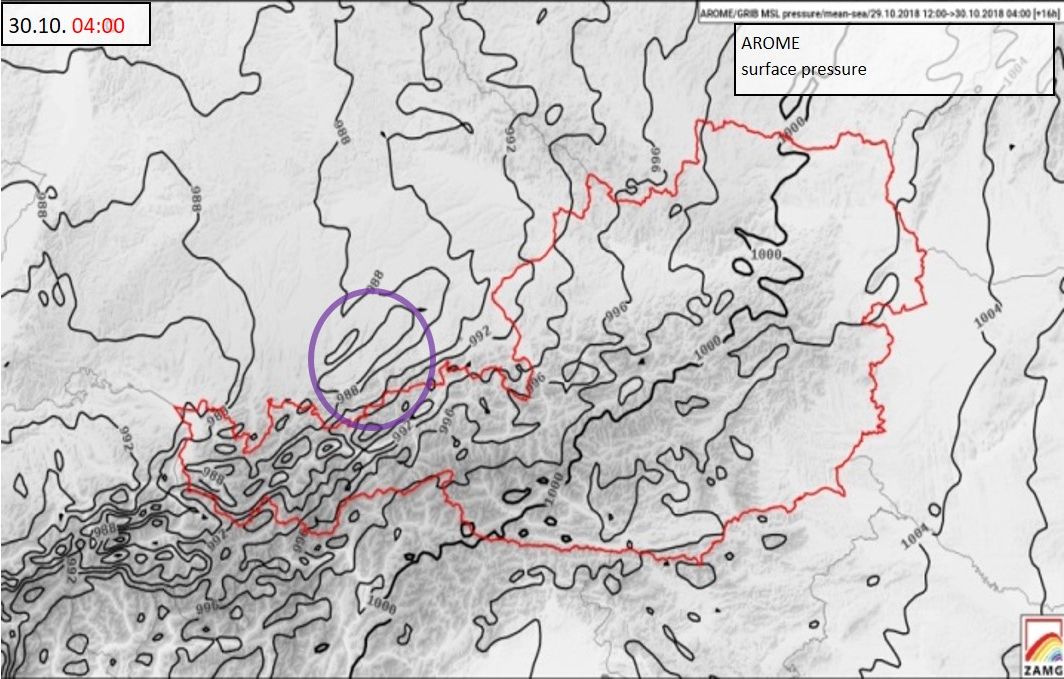
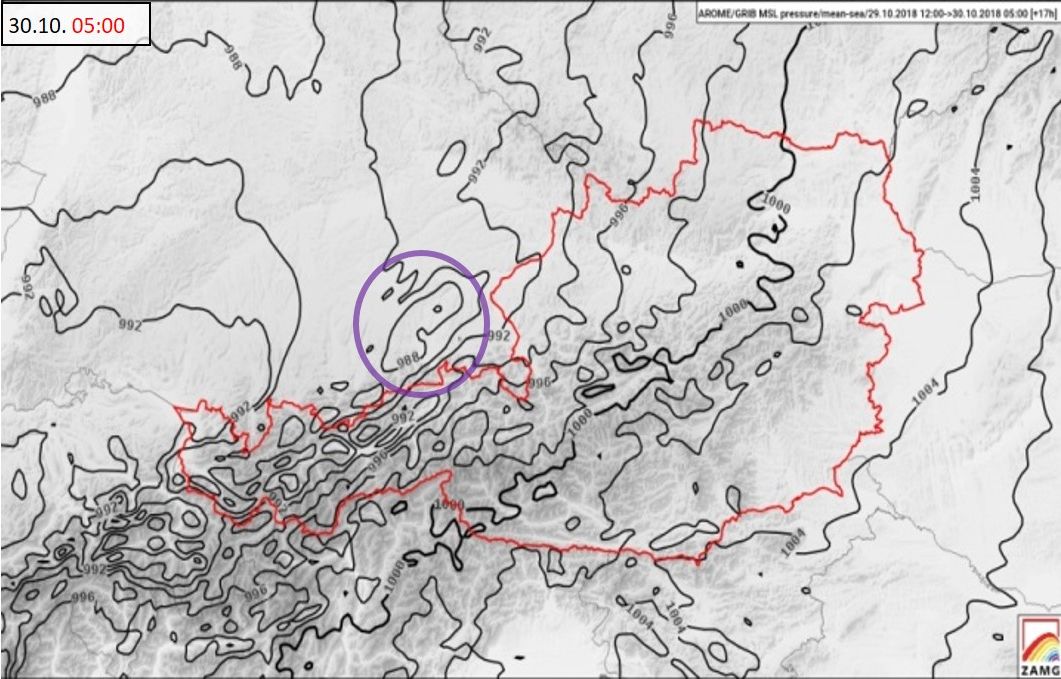


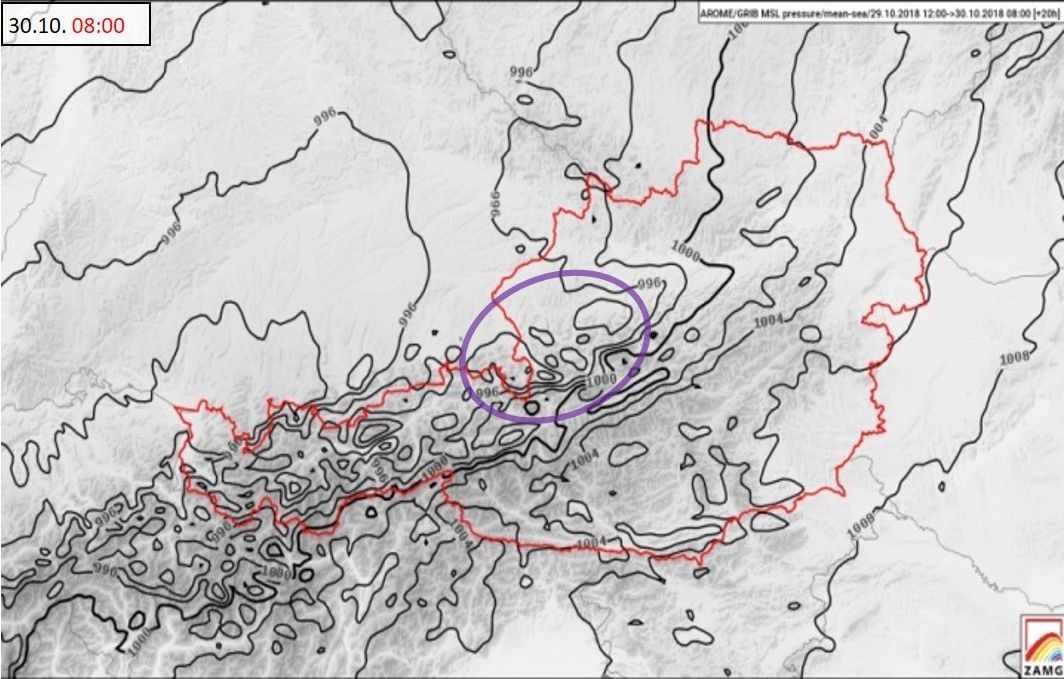
Figure 8 a) to f): AROME surface pressure, a) - f): 30 October 03:00 to 08:00 UTC. At 07:00 UTC the pressure gradient is maximized.
A sudden acceleration of the wind speed is the result of this brief pressure perturbation:

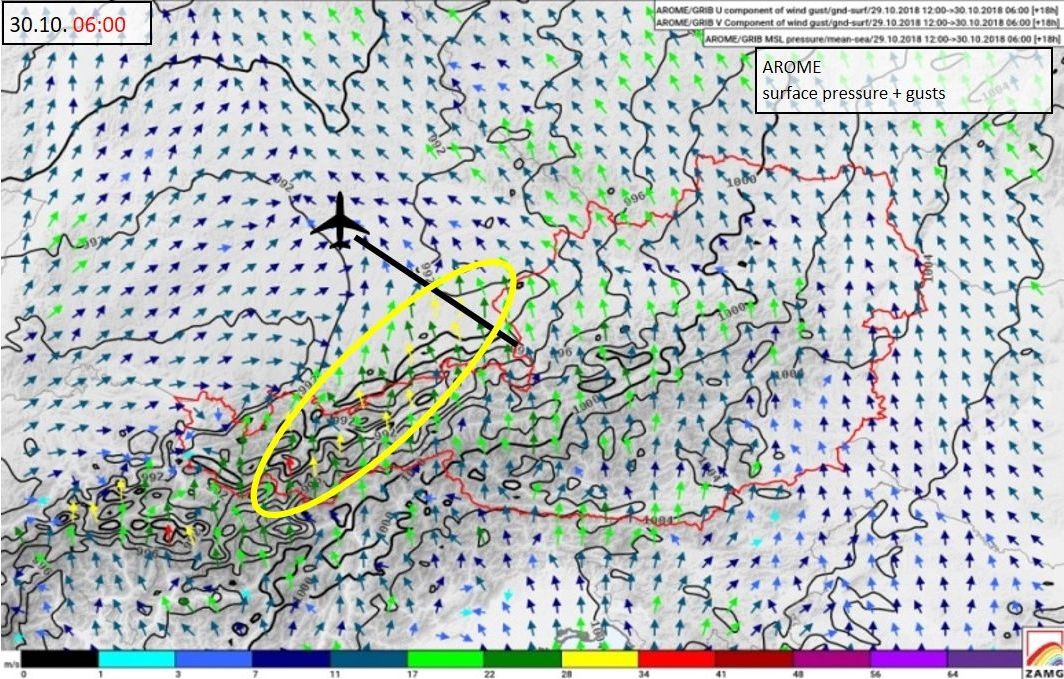
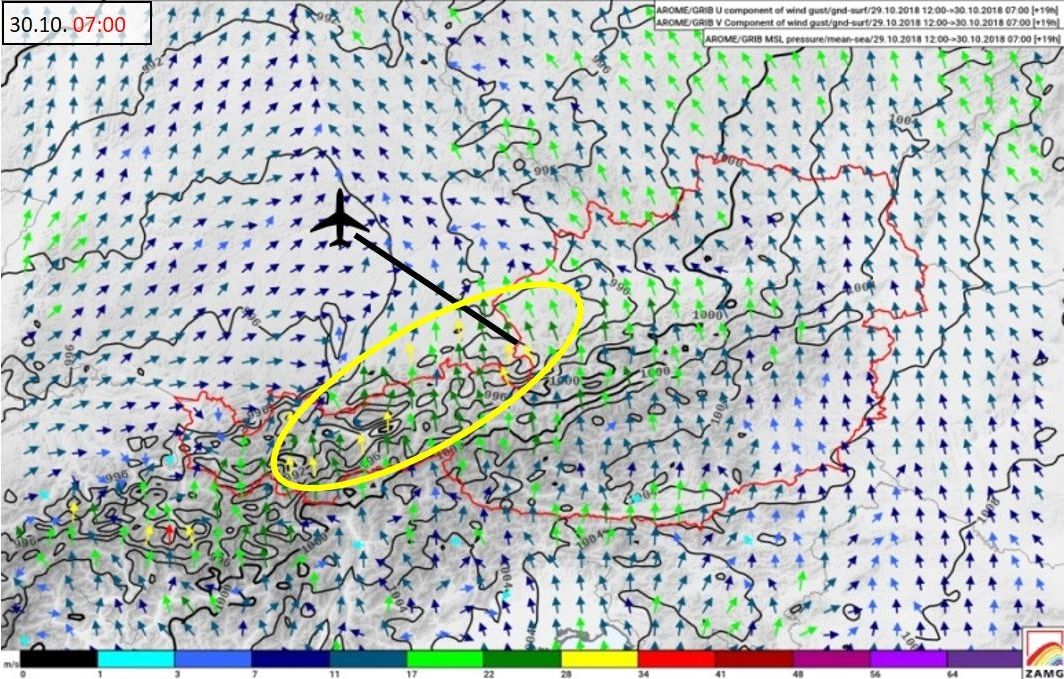
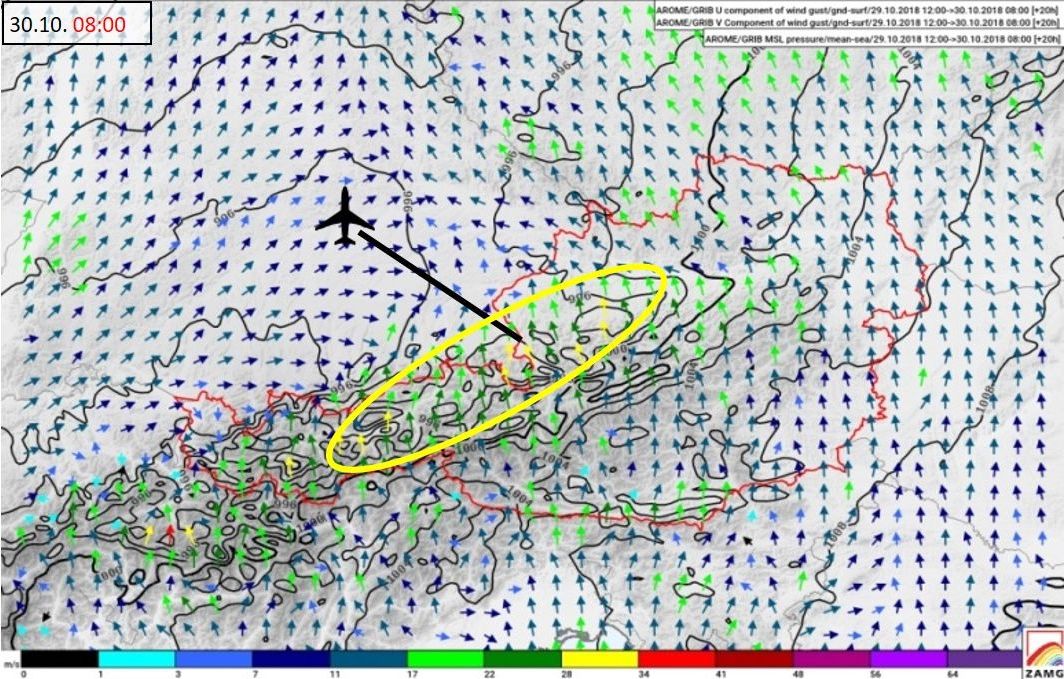
Figure 9 a) to d): AROME surface pressure + gusts, a) - d): 30 October 05:00 UTC - 08:00 UTC. An increase of the wind speed is due to a pressure perturbation. The black line indicates the location of the airport in Salzburg.
Salzburg airport registers a maximum wind speed of 24,7 m s-1 at this time:
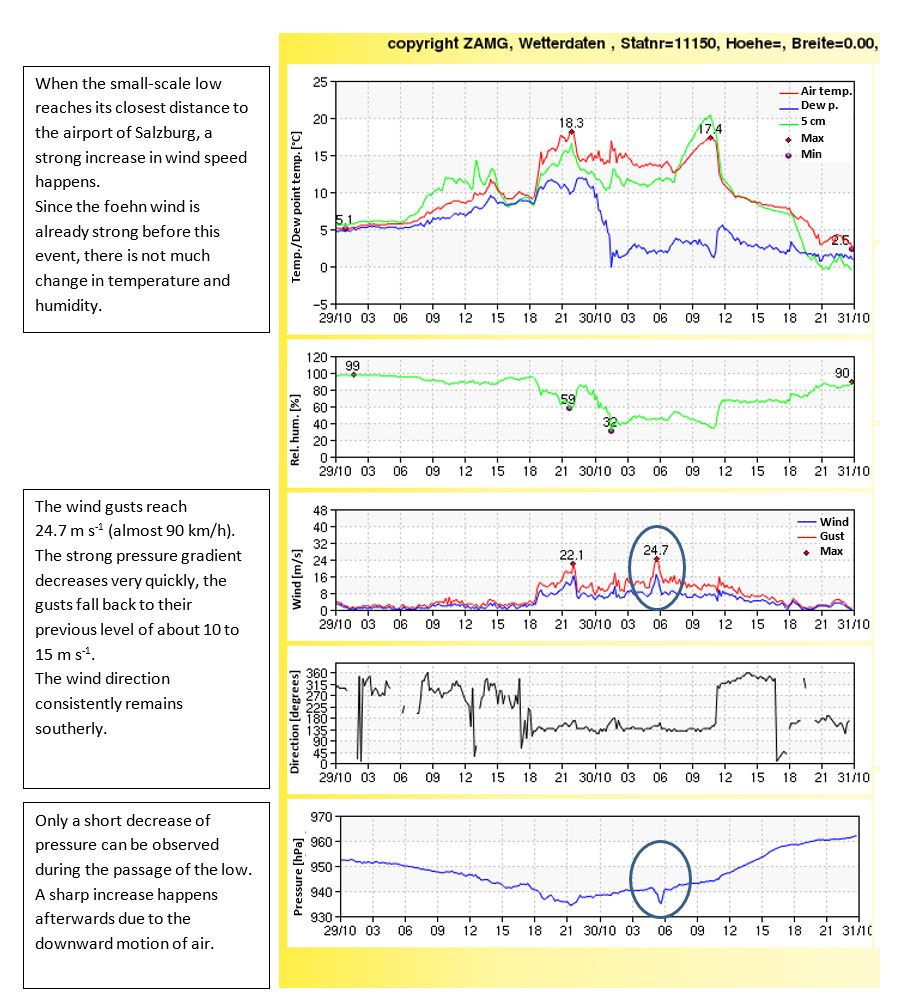
Figure 10: The weather station at Salzburg airport with temperature, dew point temperature, relative humidity, wind speed, wind direction, pressure until 31 October 00:00 UTC.
After 0600 on 30th October, the foehn wind continues for a couple of hours but soon the enhanced wind speed situation dissolves, the low dissipates over southern Scandinavia and moderate wind conditions prevail in the alpine area.
Animation: Satellite Cloud RGB, 30 October 06:00 UTC - 31 October 00:00 UTC. The low dissipates over southern Scandinavia.
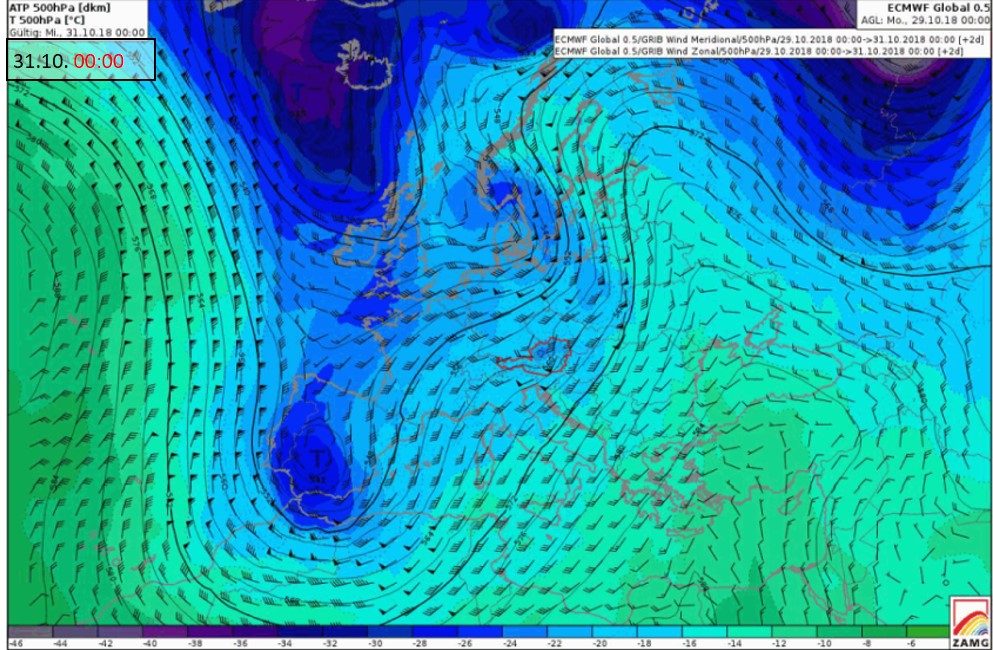
Figure 11: ECMWF geopotential height, temperature 500 hPa & wind barbs 500 hPa. a) - d): 30 October 06:00 UTC - 31 October 00:00 UTC. The strong southerly wind weakens.
* TECHNICAL NOTE: For the best interactive experience throughout this module please use the most recent versions of Firefox or Internet Explorer browser!