Table of Contents
Cloud Structure in Satellite Images
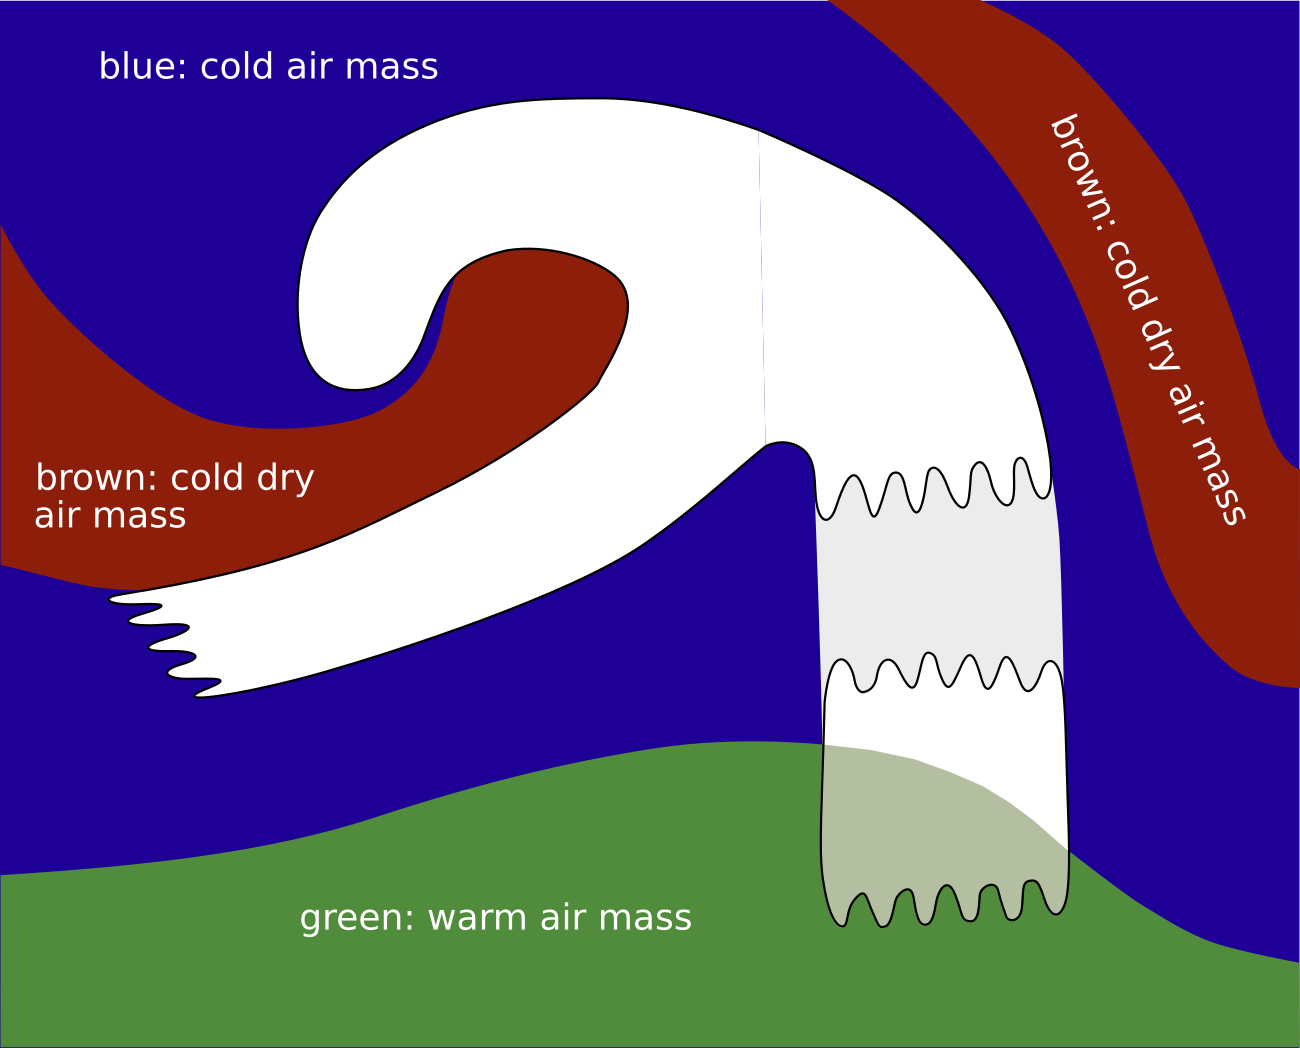
- The satellite image shows a meso- to synoptic scale multilayered cloud field, with a sharp edge along the cyclonic side.
- Typically, the cloud field associated with the Detached Warm Front can be found separated and downstream from the cloud associated with a classical frontal system.
Appearance in the basic channels:
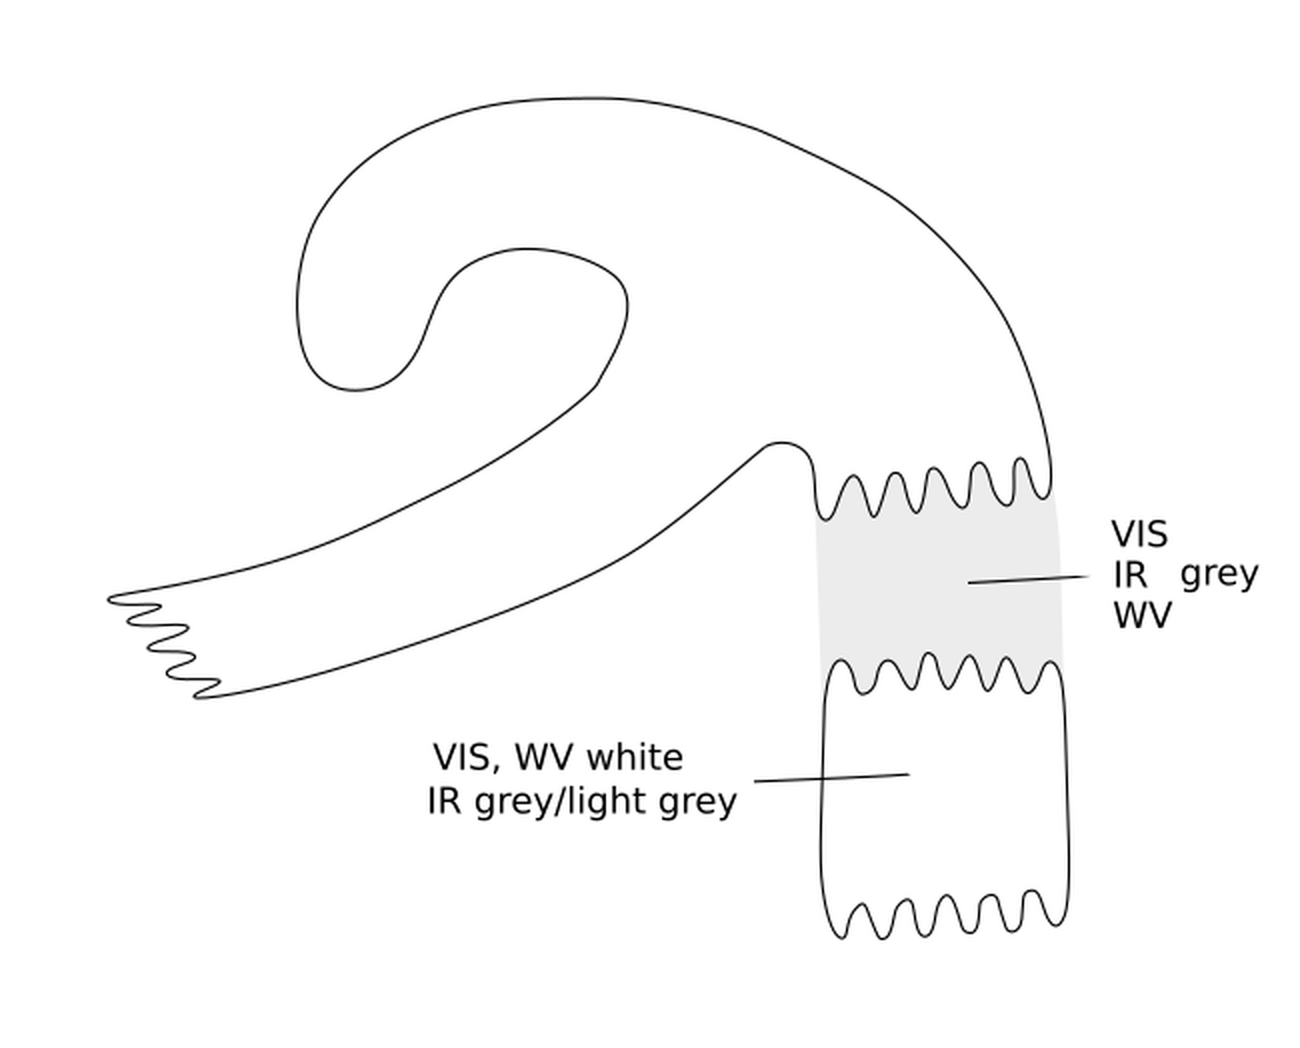
- These configurations have height and thickness with pronounced ridges bound by zones with strong isoline gradients (see Key parameters).
- In the VIS image the cloud field of the Detached Warm Front is white, indicating lower multi-layered cloud.
- In the IR image the grey shades typically vary between light grey and grey; high pixel values can mostly be found on the cold side of the thickness gradient (the leading area of the frontal cloudiness).
- The WV image shows a wide broad anticyclonic curved area with high WV pixel values, indicating high moisture
content within the high-gradient zones surrounding the equivalent thickness ridge.
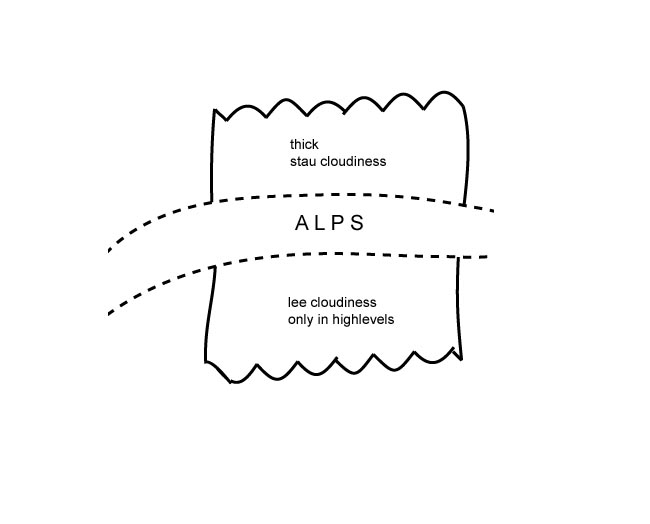
- Detached Warm Fronts typically occur on the windward side of the Alps, being accompanied by
increased weather activity (see Weather features events):
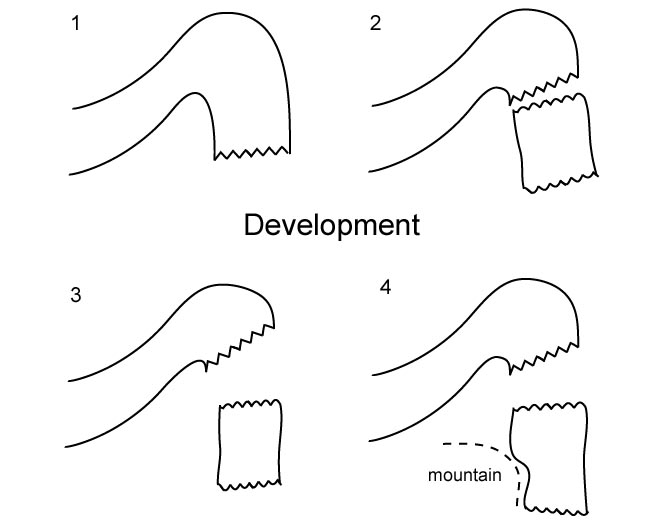
if the Detached Warm Front moves against mountains (for instance the Alps in central Europe), enhanced cloud amounts can be seen on the windward side (see Barrage Cloud ), as well as high Lee Cloudiness on the lee side (see Lee Cloudiness ). - Some features of the life cycle can be observed:
- Often the cloudiness of the Detached Warm Front cloud moves downstream from a classical Warm Front system and becomes an independent system.
- It mostly propagates southward, leading to a movement against the Alps in central Europe.
- In the case of a Detached Warm Front on the windward side of the Alps, if the whole ridge system moves eastward then the following feature is typically observed: the high cloudiness of the Detached Warm Front reaching the eastern edge of the Alps propagates quickly southward while the rest of the cloud remains bounded by the mountain chain.
- During the life cycle, high-level cloud often dissolves so that IR grey shades become darker.
|
|
Appearance in the basic RGBs:
Airmass RGB:
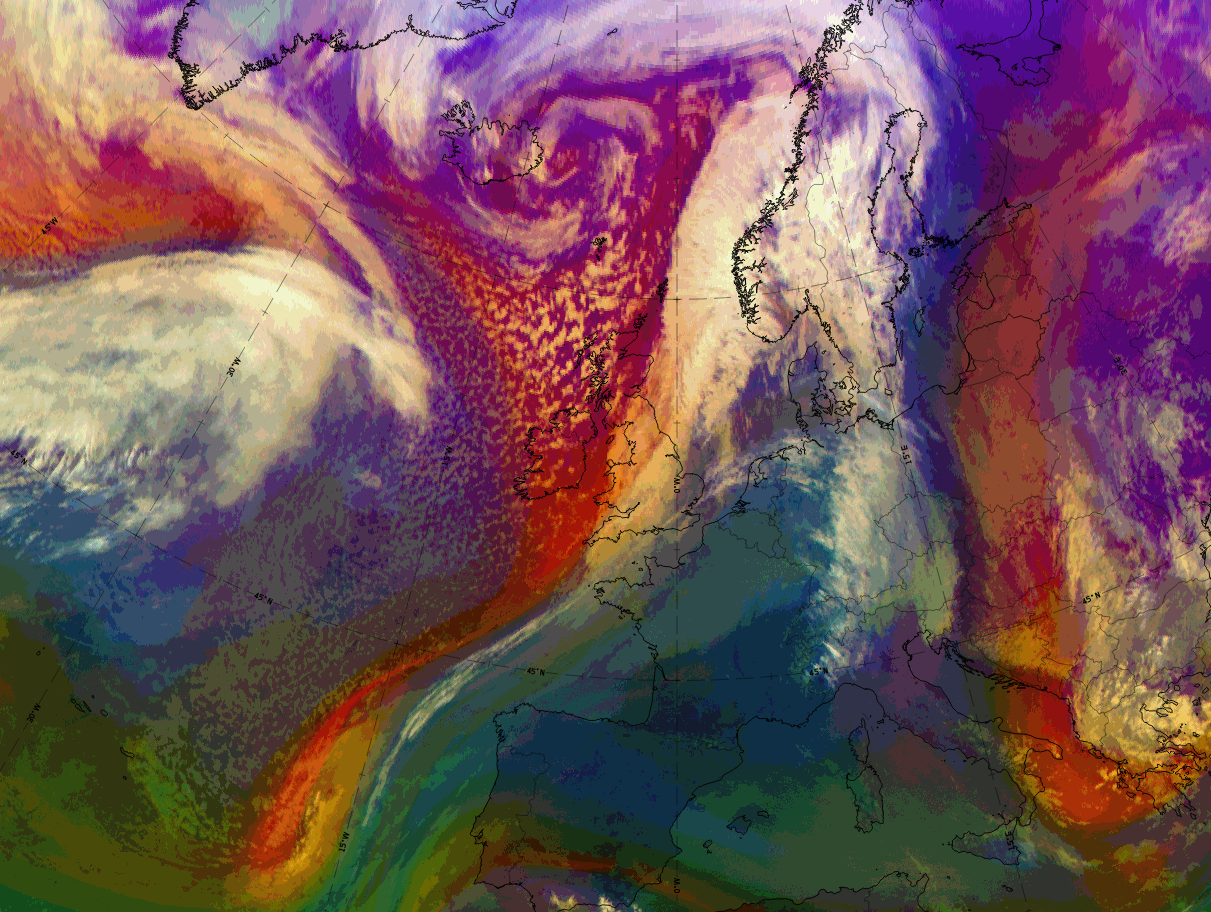
In front of the cloud band of the Detached Warm Front there is blue colour and, predominately, a dark brown stripe. Both belong to the rear side, the trough, of the preceding frontal system (to its rear). On the rear side, which is the area between the detached warm front and the consecutive cold front, greenish colours dominate, indicating the warmer air from the south and southwest.
The cloud band looks very similar to that in the IR image. However, there are often areas overlaid with the greenish colour, representing the approaching warmer air, adding a greenish shade to the white colours of the cloud.
Dust RGB:
The surrounding area of the cloud band of the Detached Warm Front is blue or pinkish blue where there are no clouds, which is mostly in the south and southwest of the cloud band. Ochre colours indicate low cloud patches, which exist more often in the leading part of the cloud band.
The cloud band itself appears in ochre, overlaid by dark red cloud where there is thick ice cloud. However, black fibrous areas also occur, indicating thin translucent ice cloud. These black fibres are mostly at the leading edge, indicating the jet axis there, as well as extending to the south of the cloud band of the Detached Warm Front.
 |
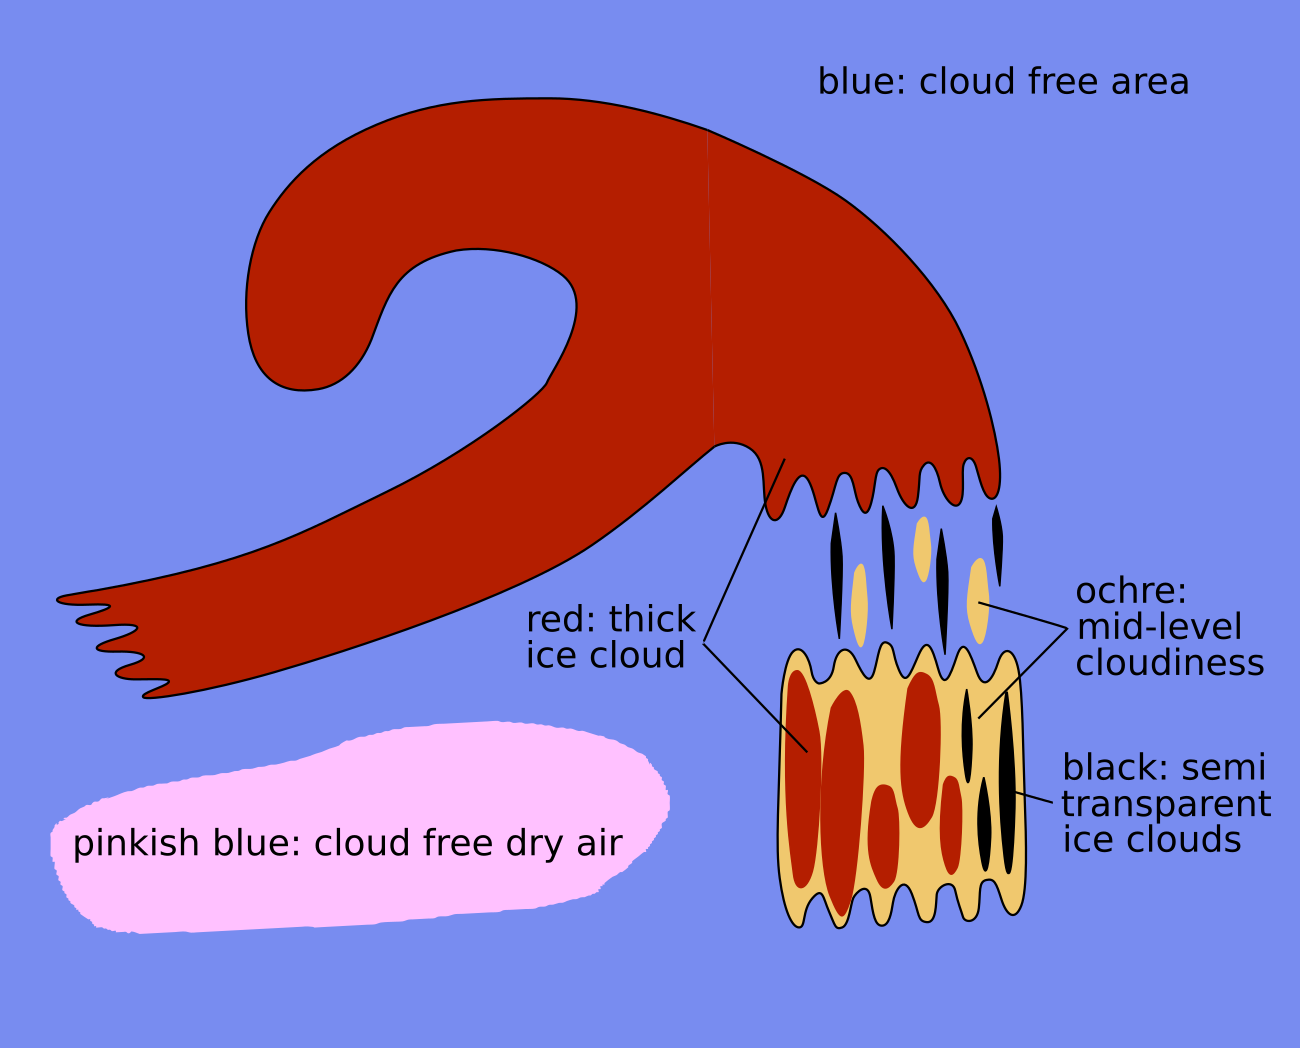 |
Legend: Basic RGBs schematics.
Left: Airmass RGB; right: Dust RGB
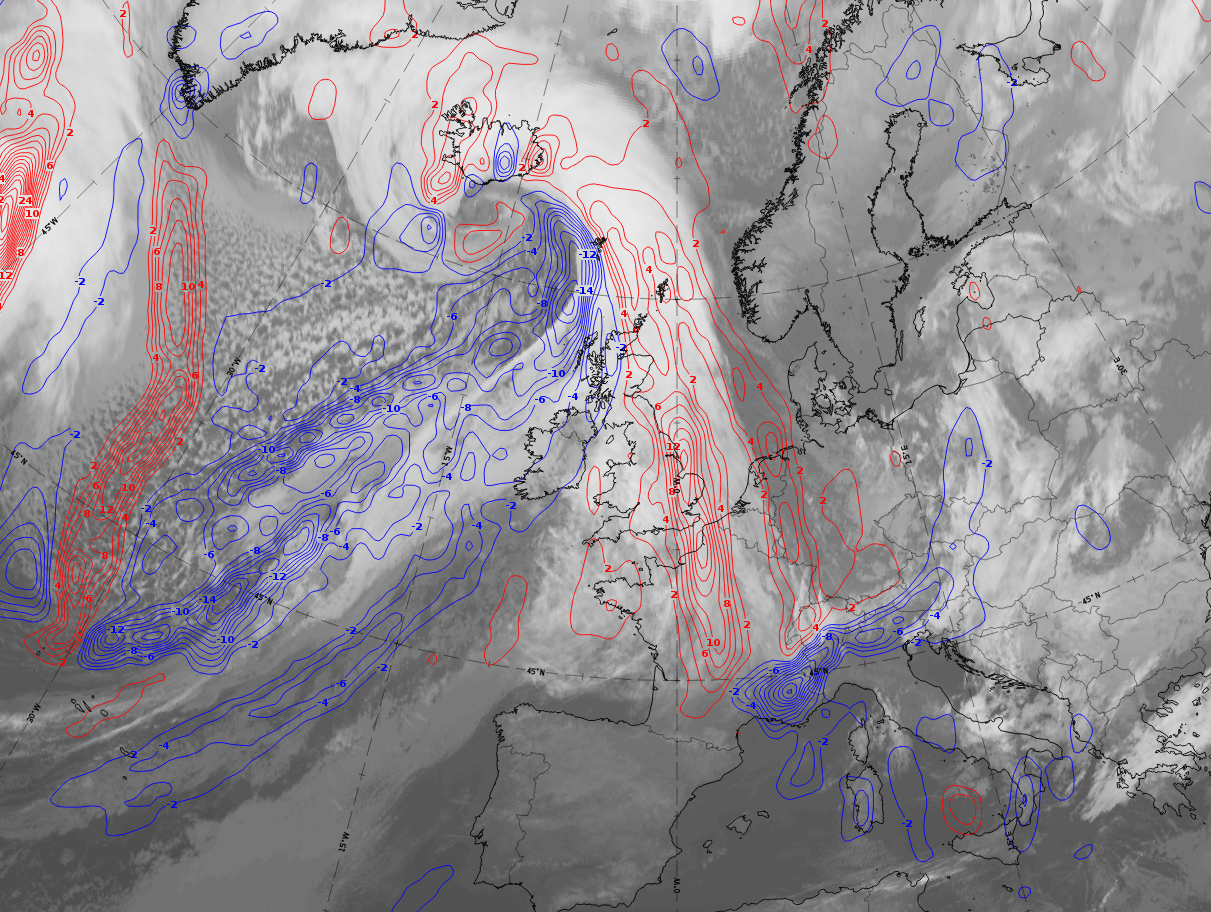
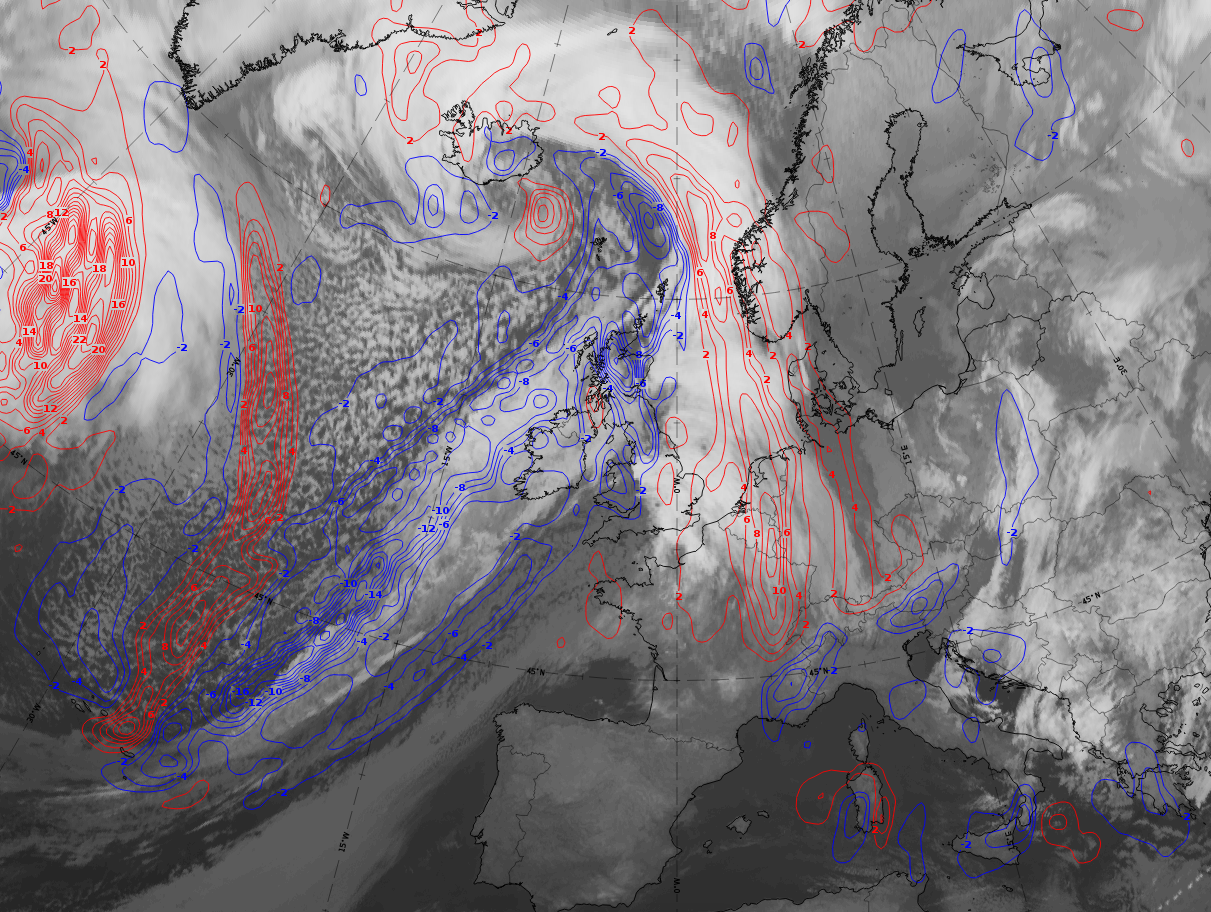
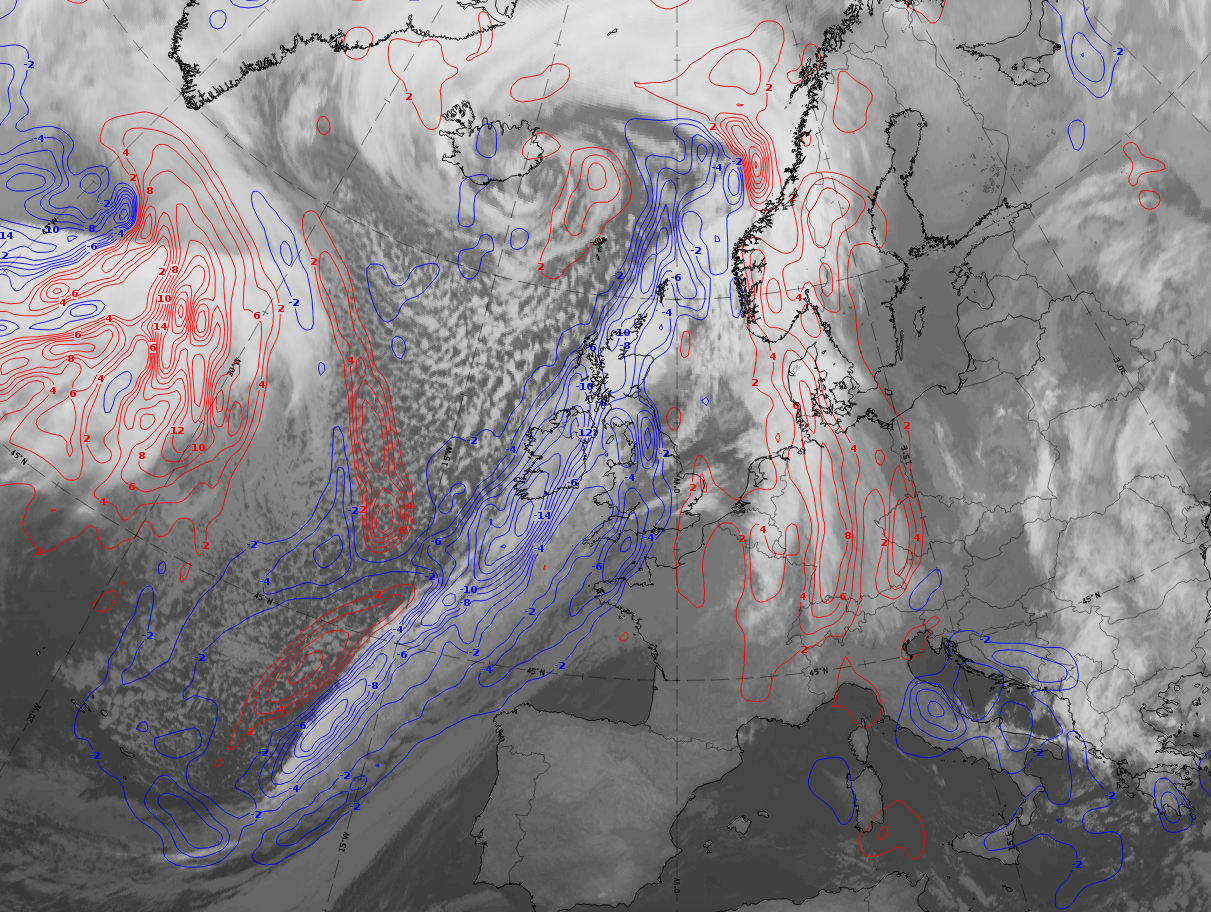
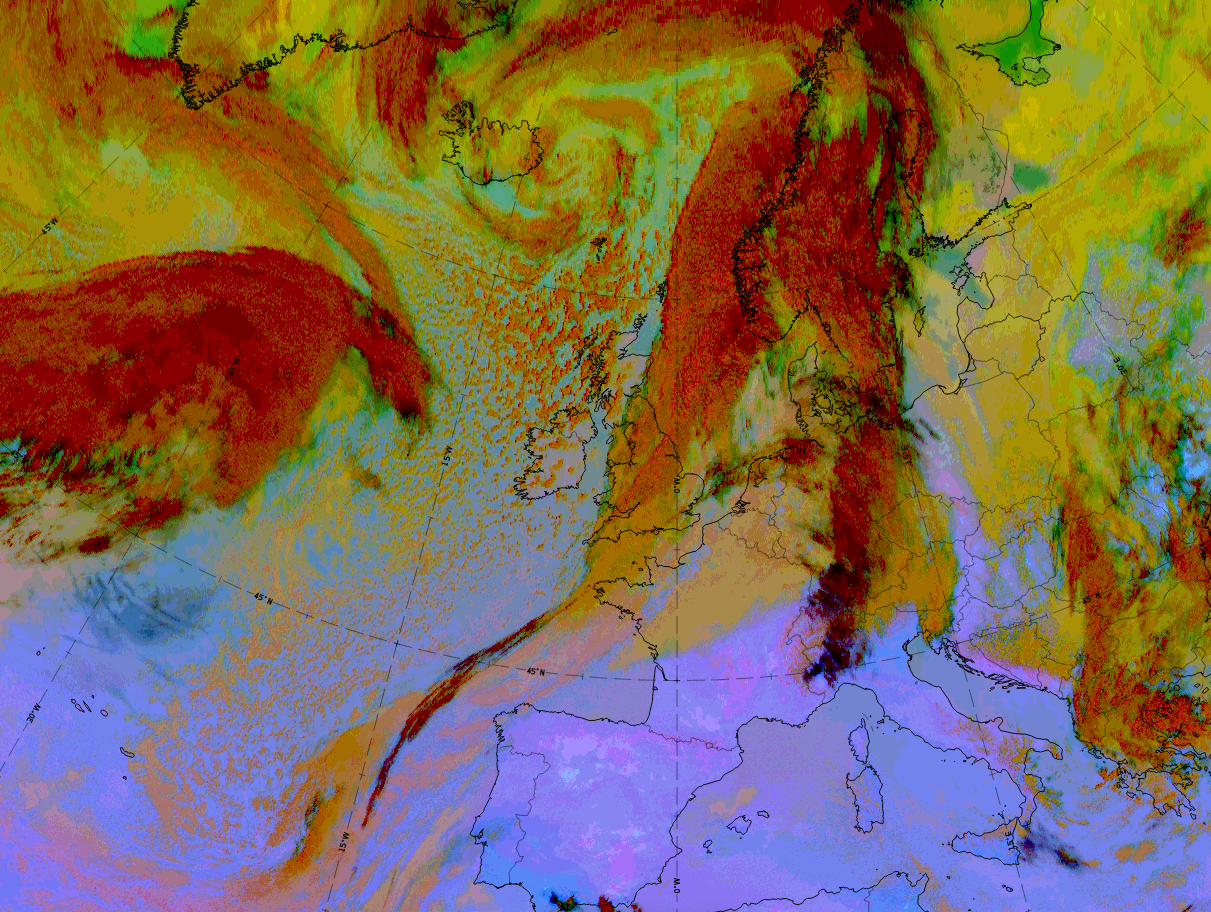
The following demonstration case is from 20 February 2020. It shows, in a 6-hourly sequence from 19 to 20 February, an eastward moving frontal system with cloud bands associated with a cold front and a warm front and a huge occlusion spiral. The warm front cloud is broad and at 18 UTC extends from 60 North southward to 45 North (first image). This band develops into two distinct areas, one in the north over southern Scandinavia, which is connected to the cold front cloud band, and a second in the south over Germany and the windward side of the Alps. This southern cloud area is on the warm side of the frontal surface and under a separate temperature advection maximum, and is therefore called the "Detached Warm Front".
 |
 |
 |
 |
Legend: Detached Warm Front.
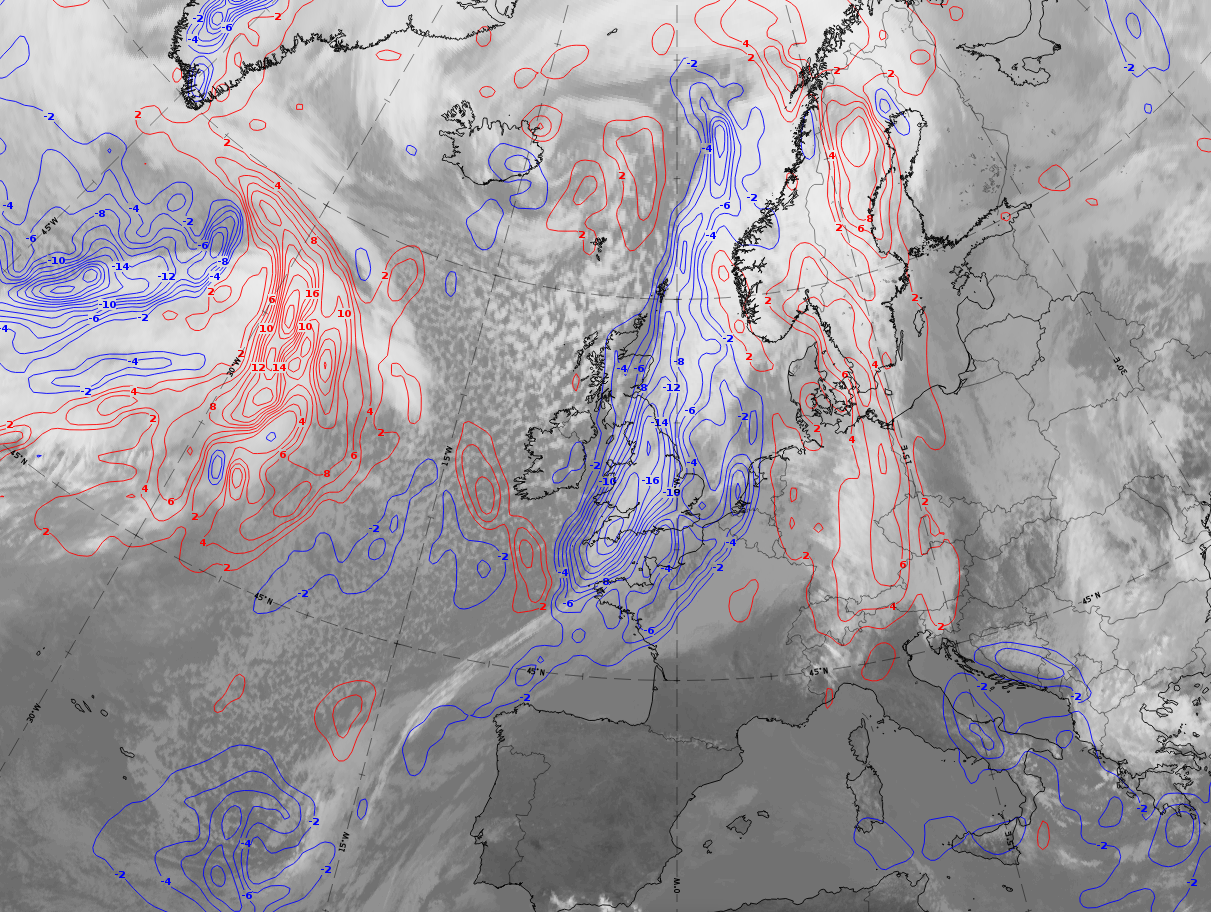
19 - 20 February 2020; 6-hourly sequence; IR + temperature advection at 700 hPa superimposed.
U.l.: 19 February at 18 UTC; u.r.: 20 February at 00 UTC; l.l: 20 February at 06 UTC; l.r.: 20 February at 12 UTC.
*Note: click on the image to access the image gallery (navigate using arrows on keyboard)
|
|
|
|

Legend:
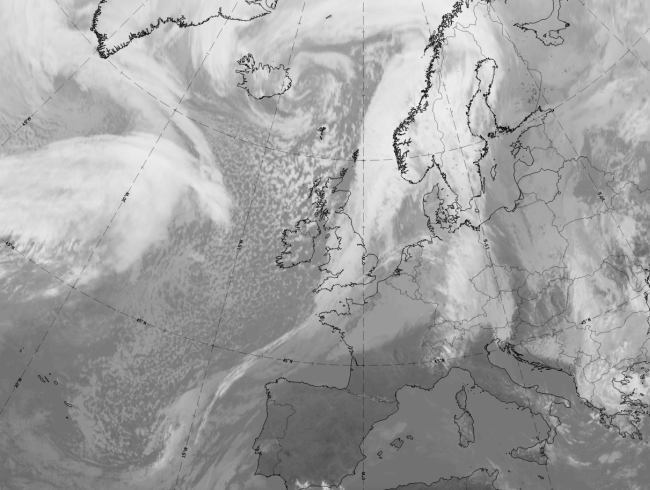
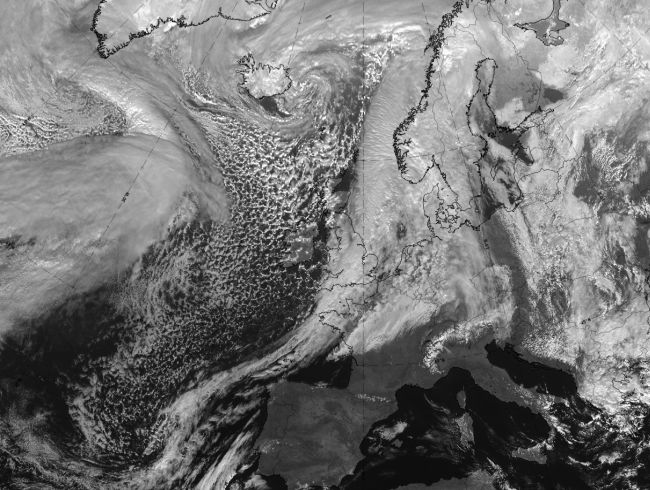
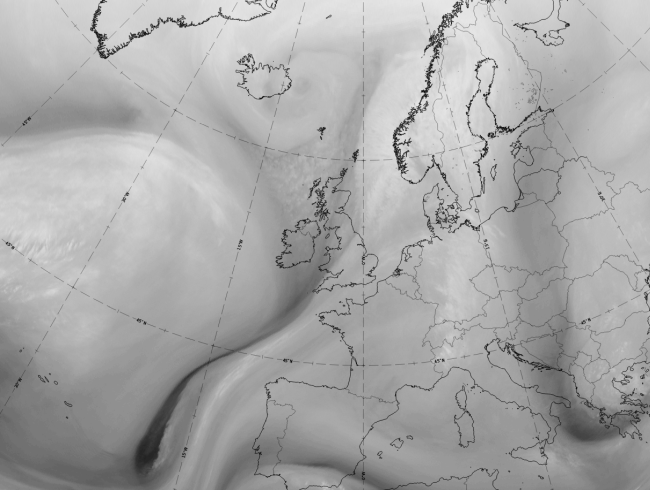
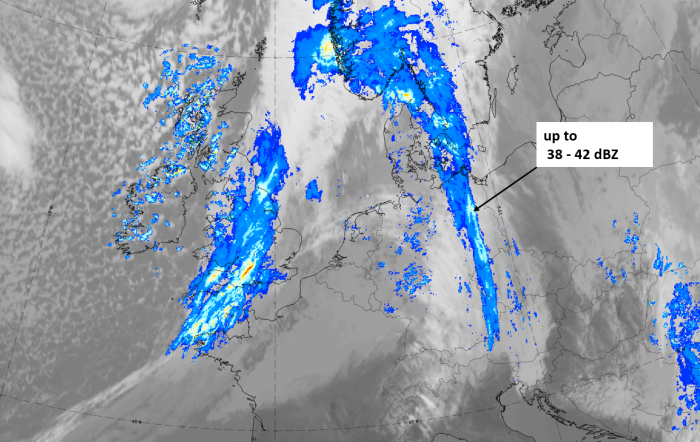
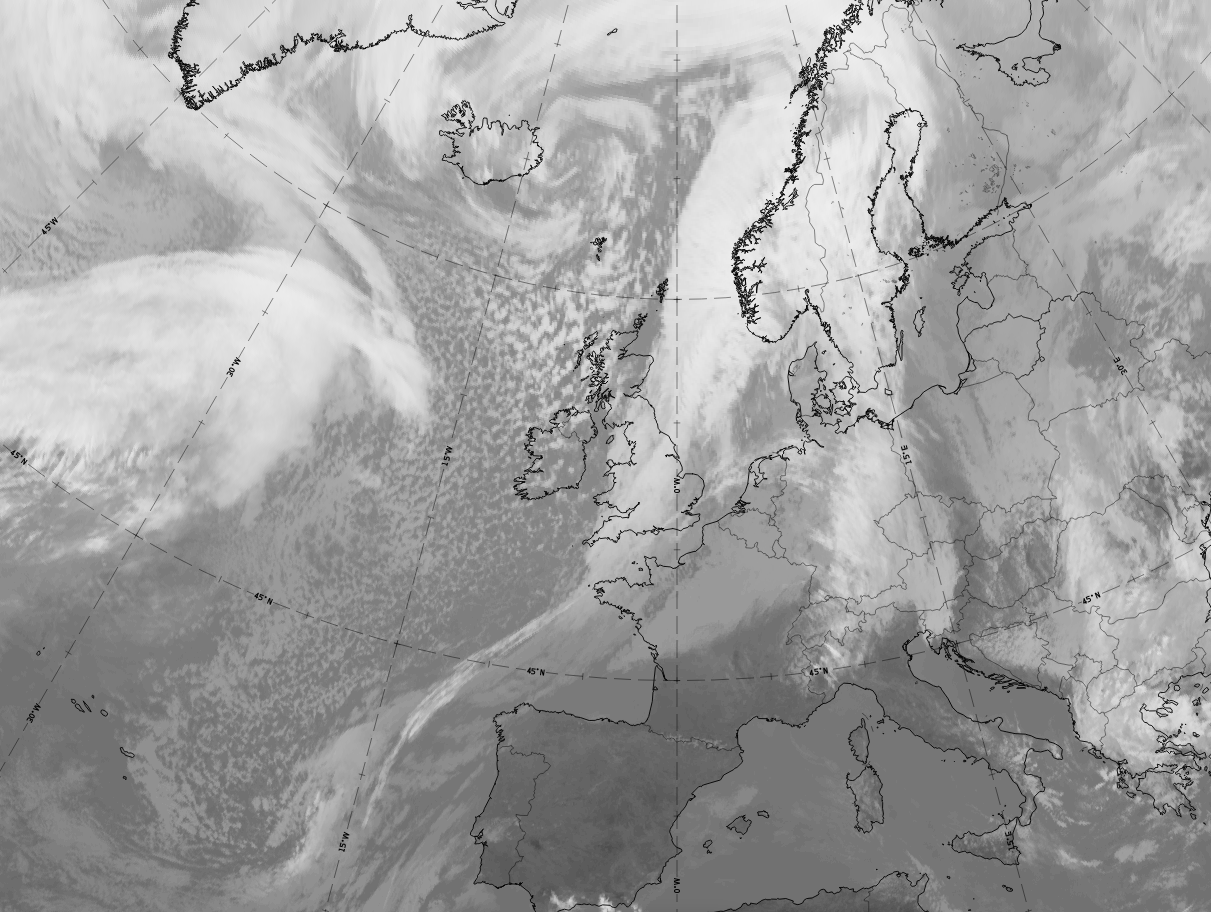
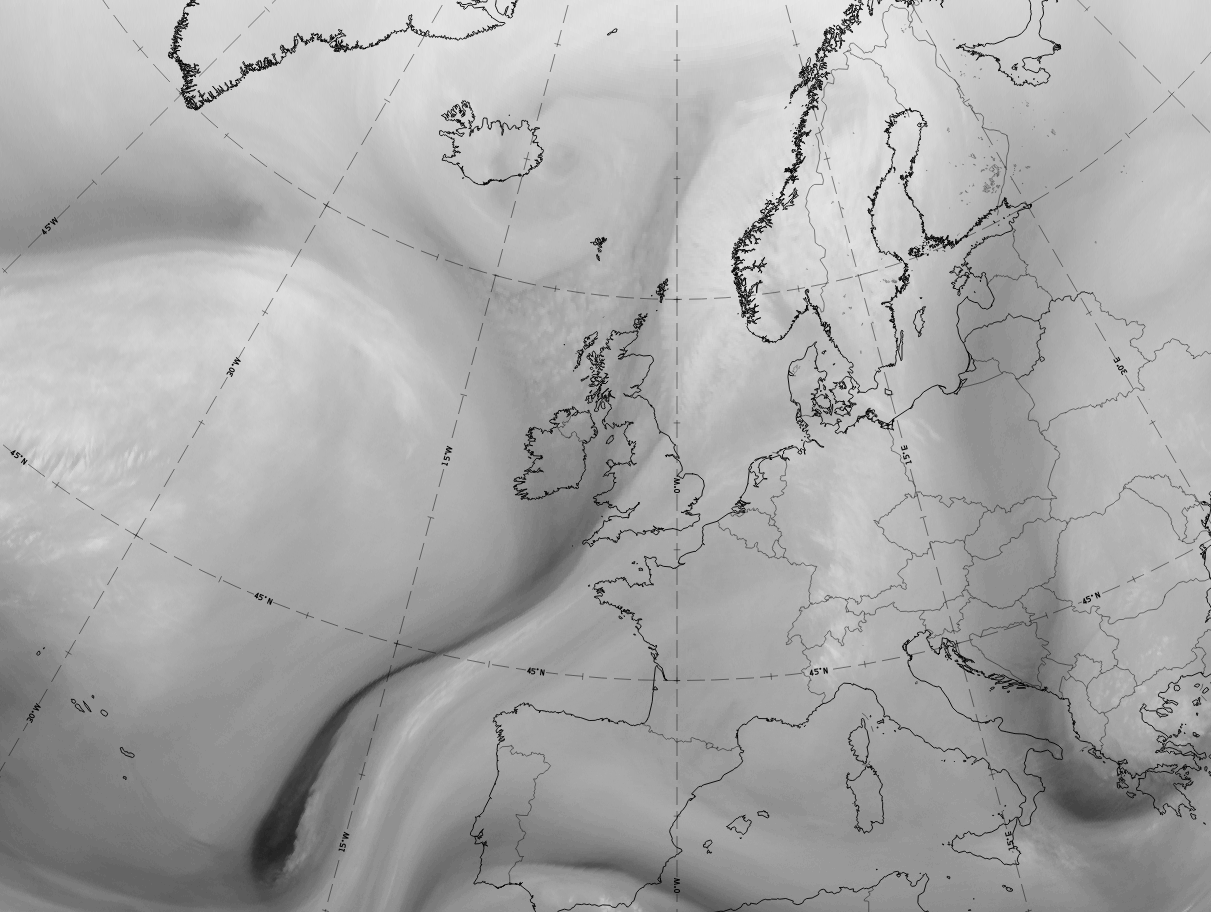
20 February 2020 at 12 UTC: 1st row: IR (above) + HRV (below); 2nd row: WV (above) + Airmass RGB (below); 3rd row: Dust RGB + image gallery.
*Note: click on the image to access the image gallery (navigate using arrows on keyboard)
| IR | Grey areas (especially in the eastern part of the cloud) indicate mid-level cloud; white areas (especially in the western part of cloud) indicate thick and layered cloud. |
| HRV | Bright smaller cloud patches below with grey fibres above. |
| WV | Wide light grey area with bright colours where the white cloud of the detached warm front occurs. |
| Airmass RGB | Greenish colours at the rear and above the white cloud of the detached warm front, changing the white colours of the cloud to a darker shade. A dark brown stripe in front of the WF belongs to the trough area of the preceding system. |
| Dust RGB | Ochre to dark red indicating both, mid-level water cloud and thick ice cloud. Black colours in the south indicate high ice cloud and represent the high lee cloud in the lee of the Alps. |
An older case from 3-4 January 2005 is a good demonstration of the movement and modification of a Detached Warm Front interacting with the Alps.
The IR loop shows the development of the Detached Warm Front. Special attention should be paid at the time when the Detached Warm Front reaches the Alps. As it then moves eastward, more cloud moves southward on the eastern edge of the Alps over Slovenia.
 Loop: 03 January 18.00 - 04 January 18.00 UTC, Meteosat 8 IR 10.8 hourly images
Meteorological Physical Background
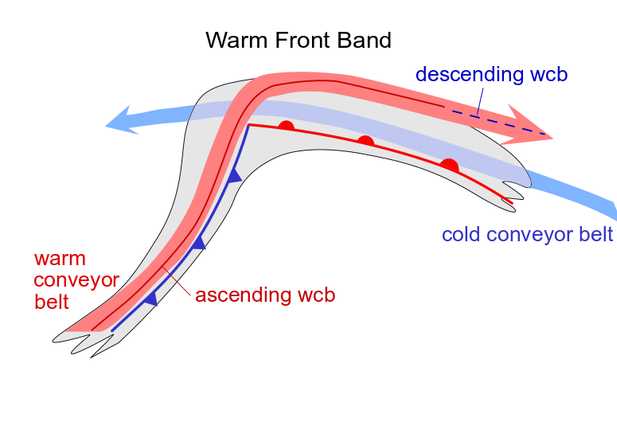
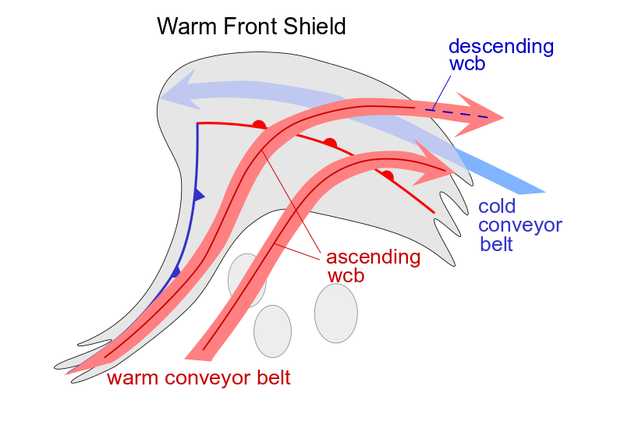
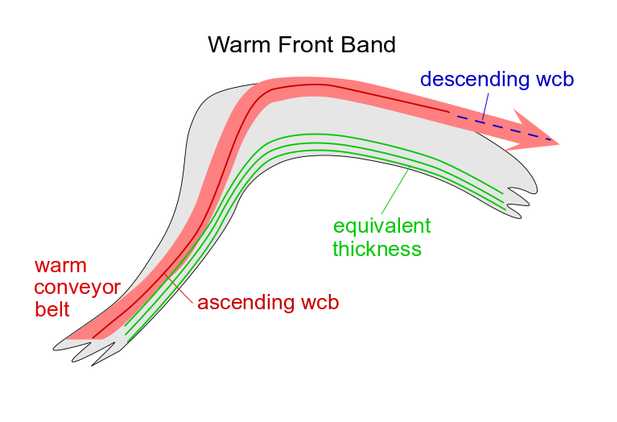
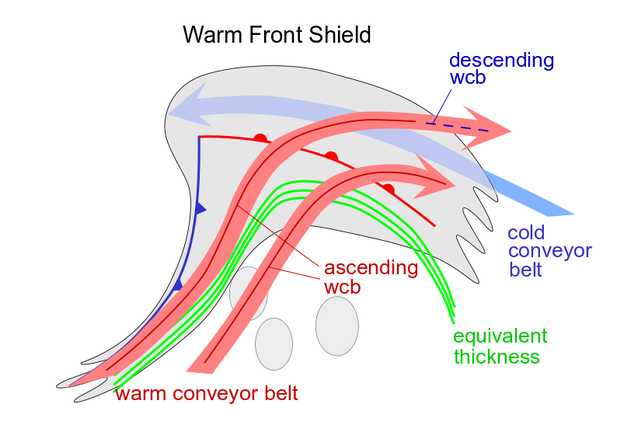
This is a cloud configuration showing some typical Warm Front conditions: WA maxima, crowded thickness isolines and a TFP or a surface front line at the rear edge of the cloud field (see Key Parameters). However it deviates from the classical Warm Front (see Warm Front Band and Warm Front Shield ) in one important way: it can be completely detached from the original frontal system (Cold Front and Warm Front) and can no longer be explained by the frontal processes associated with the circulation in a low. Although not yet thoroughly investigated, there are some indications that conveyor belt theory can explain the maintenance of the Detached Warm Front.
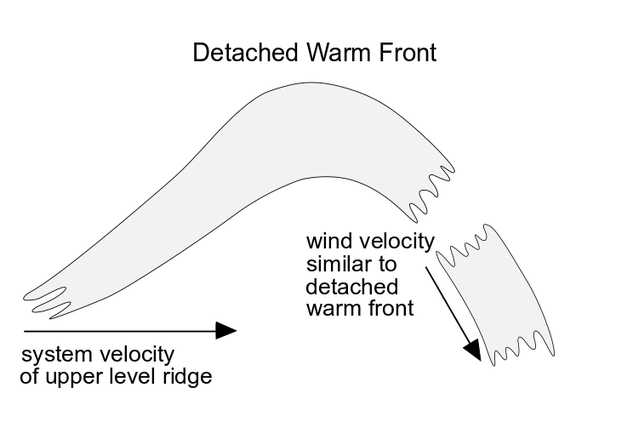
In the case of an eastward moving classical frontal system the Detached Warm Front is mostly observed within the eastern branch of a pronounced synoptic scale ridge in the height and thickness fields, accompanied by strong winds in higher levels of the troposphere (approximately at 500 hPa) which blow normal to the movement of the ridge system.
A possible and often observed indication for the formation of a Detached Warm Front is a splitting of the wind field within the mid- and upper levels of the troposphere in the area of the Warm Front into a north-western and a strong southern stream. This causes the cloud field of the Detached Warm Front to move more or less rapidly southward within the eastern branch of the upper level ridge which is, in this case, very close to the high gradient zone of equivalent thickness. The original frontal system, which is situated further north, moves from west to east. Consequently the different air streams cause two WA maxima. WA maxima contribute to upward motion which is one reason for the maintenance of cloudiness.
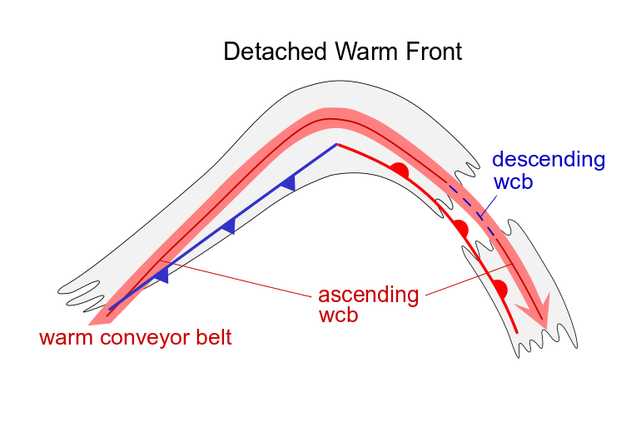
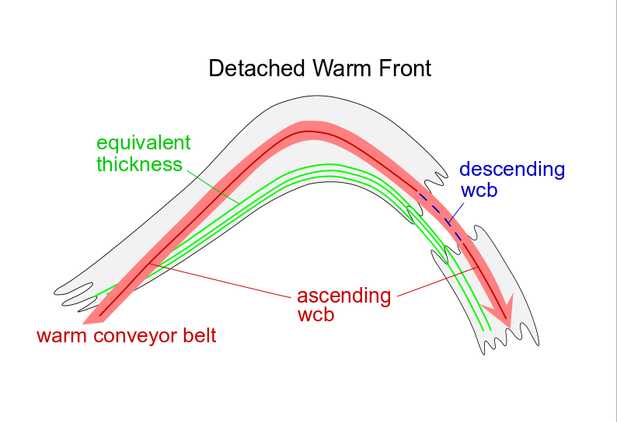
A different view of the development and maintenance of a Detached Warm Front cloudiness is given by the conveyor belt model. For the Detached Warm Front, a rising warm conveyor belt, as already described in detail in the Warm Front chapters, is also the dominant feature. It is the same relative stream which is involved in the band- and shield-formed Warm Front. The cloudiness of the Detached Warm Front appears where the relative streams turn from the northern culmination point to south, south-western directions. But there are two main differences between the classical and the detached types. While in the band and shield type the Warm Conveyor Belt is sinking in the area just described, it is rising in the area of the Detached Warm Front. The reason for this may be the strongly inclined frontal zone, indicated in the high gradient zone of the thickness, as well as in the isentropes of a vertical cross section (see Typical appearance in vertical cross section). In the classical types either no frontal zone (band type) or a weakening (shield type) appears in the area under consideration. A second difference can be found in the location and orientation of the Warm Conveyor Belt which seems to be more to the south of the synoptic scale ridge, which leads to the fact that the rising Warm Conveyor Belt overruns the frontal line in the area of the Detached Warm Front. However, more investigations will be necessary.
Due to the orography in central Europe, the cloud field of the Detached Warm Front is moving against the northern or the windward side of the Alps and therefore Stau effects are superimposed (see Barrage cloud ) causing increased weather events there (see Weather events).
|
|
|
|
|
|
|
4 January 2005/00.00 UTC - Vertical cross section; black: isentropes (ThetaE), orange thin: IR pixel values, orange
thick: WV pixel values
|
|
The two isentropic surfaces used for the relative streams in the figures below are 296K, which is within the main high gradient zone, and 308K which is relevant for upper levels.
|
4 January 2005/00.00 UTC - Meteosat 8 IR 10.8 image; magenta: relative streams 296K - system velocity: 315°
10 m/s, yellow: isobars 296K.
|
4 January 2005/00.00 UTC - Meteosat 8 IR10.8 image; magenta: relative streams 308K - system velocity: 314°
11 m/s, yellow: isobars 308K.
|
|
|
On the lower isentropic surface there is a well developed Warm Conveyor Belt from the Atlantic across Ireland and Scotland to south Scandinavia where it turns to more southerly directions. Above central Europe the relative streams cross the TFP of the Detached Warm Front (see Key Parameters) rising from about 700 hPa (South Sweden, Poland and Slovenia) up to 400 hPa (Eastern Poland to Bulgaria).
On the higher isentropic surface the Warm Conveyor Belt is rather similar. However, the rising in the area of the Detached Warm Front is rather less, from about 500 hPa over Eastern Germany up to about 350 hPa over Poland. The orientation of the relative stream lines fits much better with the orientation of the high cloud shield than on the lower isentropic surface.
Key Parameters
- Equivalent thickness:
The cloud field of the Detached Warm Front is within the high gradient zone at the eastern branch of a pronounced ridge of the (equivalent) thickness. - Absolute topography at 500 hPa:
It is very similar to the (equivalent) thickness, therefore the cloudiness of the Detached Warm Front is also within the high gradient zone at the eastern branch of a pronounced ridge of absolute topography. - Warm advection (WA):
The cloudiness of the Detached Warm Front is superimposed upon a distinct WA maximum. But often two WA maxima can be observed. In this case the northern maximum is associated with the original Warm Front, and the southern one with the Detached Warm Front. - Wind Vectors at 500 hPa:
The wind field has, in the area of the cloud field of the Detached Warm Front, a more or less strong southern component, and blows normal to the displacement of the whole frontal system of the ridge and frontal zones. Consequently, cloud elements of the Detached Warm Front are moving quickly southward while the complete cloud configuration is displaced eastward, much more slowly. - Shear vorticity at 300 hPa:
The zero line coincides with the leading edge of the Warm Front cloud shield. - Isotachs at 300 hPa:
The leading edge of the Warm Front cloud shield is superimposed upon a jet streak with intensities varying from case to case.
|
04 January 2005/00.00 UTC - Meteosat 8 IR 10.8 image; blue: geopotential height 500 hPa, green: equivalent
thickness 500/850 hPa
|
|
|
|
|
04 January 2005/00.00 UTC - Meteosat 8 IR 10.8 image; blue: thermal front parameter 500/850 hPa, red: temperature
advection 500/1000 hPa
|
|
|
|
|
04 January 2005/00.00 UTC - Meteosat 8 IR 10.8 image; yellow: isotachs 300 hPa, black: zero line of shear vorticity 300 hPa
|
|
|
|
The parameter distribution is very similar to the ideal situation described above. If the wind vectors at 500 hPa (green arrows) are compared to the relative streams (see Meteorological Physical Background), differences in the directions can be observed at a height close to 500 hPa (296K isentrope). While the absolute winds are coming from a north-westerly direction the relative streams are coming from a more north-easterly direction, which is very close to the orientation of the cloud structure.
Typical Appearance In Vertical Cross Sections
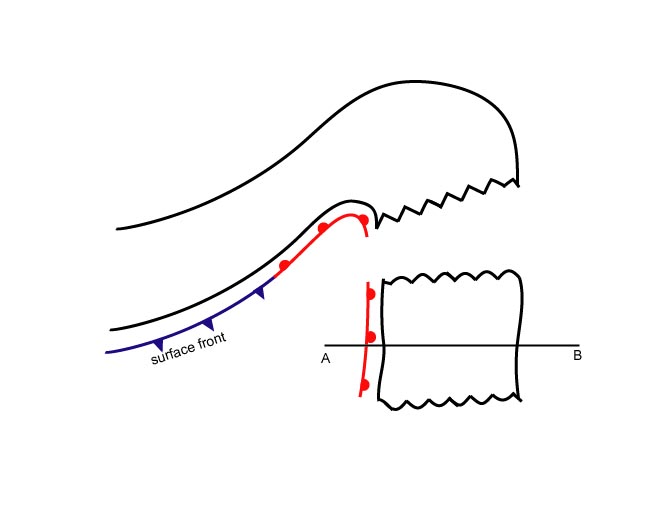
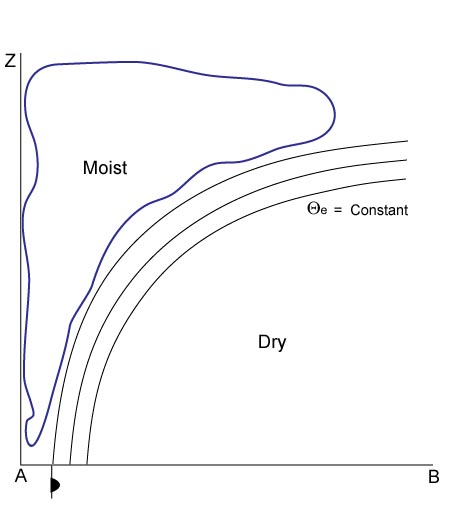
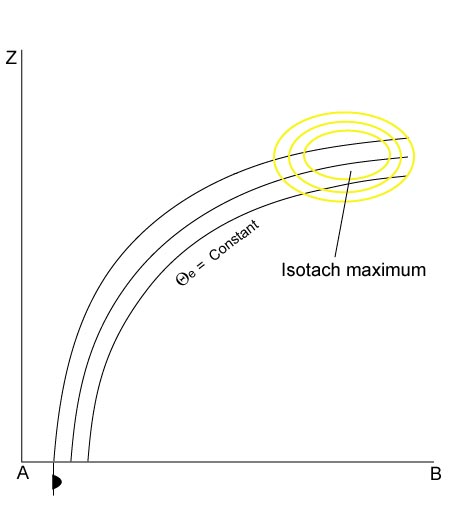
As described before, the isentropes of the equivalent potential temperature across the Detached Warm Front show a high gradient zone through the whole troposphere, which is inclined upwards from low to high levels. The colder air can be found in front of and below the high gradient zone, the warmer air being in front, and above it (see Meteorological physical background).
The field of humidity shows high values immediately behind and above the frontal surface of the Warm Front. Low values can be found below the high gradient zone of the equivalent potential temperature.
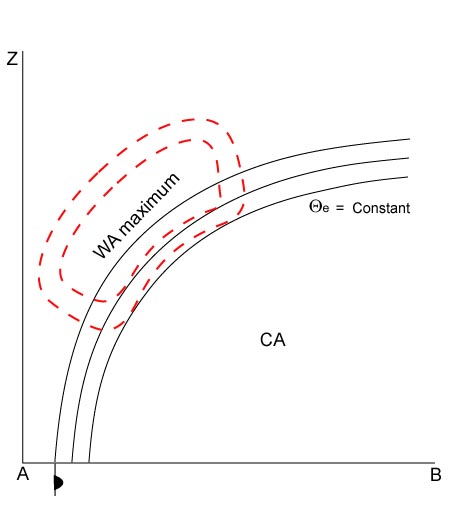
Like the distribution of humidity, the field of temperature advection can also be separated into two parts. WA exists above and within the high gradient zone of the Warm Front. The maximum of the WA can be found within the high gradient zone where it often has several maxima from low up to high levels. On the other hand CA can be found below and in front of the high gradient zone. In actual cases the isentropes forming the lower boundary of the frontal surface do not represent the transition from WA to CA, but WA can also mostly be found far below the frontal surface while CA exists only at a larger distance from the surface front.
At the leading part of the system, above the frontal surface at approximately 300 hPa, a pronounced isotach maximum can be observed.
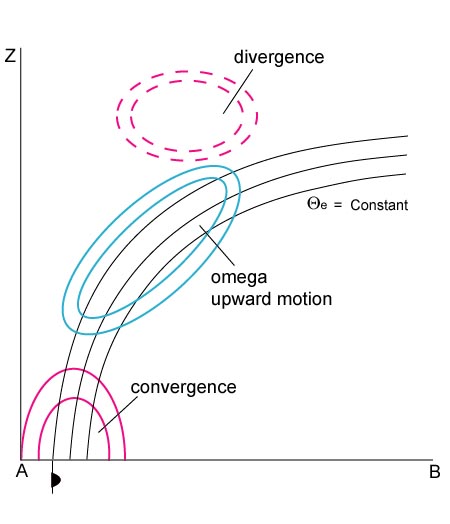
Well developed fronts are accompanied by a zone of distinct convergence within and divergence above the frontal zone. Consequently, upward vertical motion can be found above the frontal zone, responsible for cloud development.
In the ideal case, the satellite radiance values across the Warm Front are characterized by typical distributions. While the IR image shows continuously increasing values of grey shades from the rear to the leading edge across the frontal area, the distribution of the grey shades in the VIS image is reversed (see Cloud structure in satellite image). In contrast, the WV image shows high pixel values within the frontal cloudiness and a pronounced minimum associated with the dry air in front. In reality, these variations of grey shades for Detached Warm Fronts are, by far, not as clear as in the ideal conceptual model.
|
04 January 2005/00.00 UTC - Meteosat 8 IR 10.8 image; position of vertical cross section indicated
|
|
|
|
|
04 January 2005/00.00 UTC- Vertical cross section; black: isentropes (ThetaE), red thick: temperature advection - WA, red thin: temperature advection - CA, orange thin: IR pixel values, orange thick: WV pixel values
|
|
|
|
|
04 January 2005/00.00 UTC- Vertical cross section; black: isentropes (ThetaE), blue: relative humidity, orange thin: IR pixel values, orange thick: WV pixel values
|
|
|
|
|
04 January 2005/00.00 UTC- Vertical cross section; magenta thin: divergence, magenta thick: convergence, cyan thick: vertical motion (omega) - upward motion, cyan thin: vertical motion (omega) - downward motion, orange thin: IR pixel values, orange thick: WV pixel values
|
|
|
|
|
04 January 2005/00.00 UTC - Vertical cross section; black: isentropes (ThetaE), yellow: isotachs, orange thin: IR pixel values, orange thick: WV pixel values
|
|
|
|
Weather Events
| Parameter | Description |
| Precipitation |
|
| Temperature |
|
| Wind (incl. gusts) |
|
| Other relevant information |
|
|
|

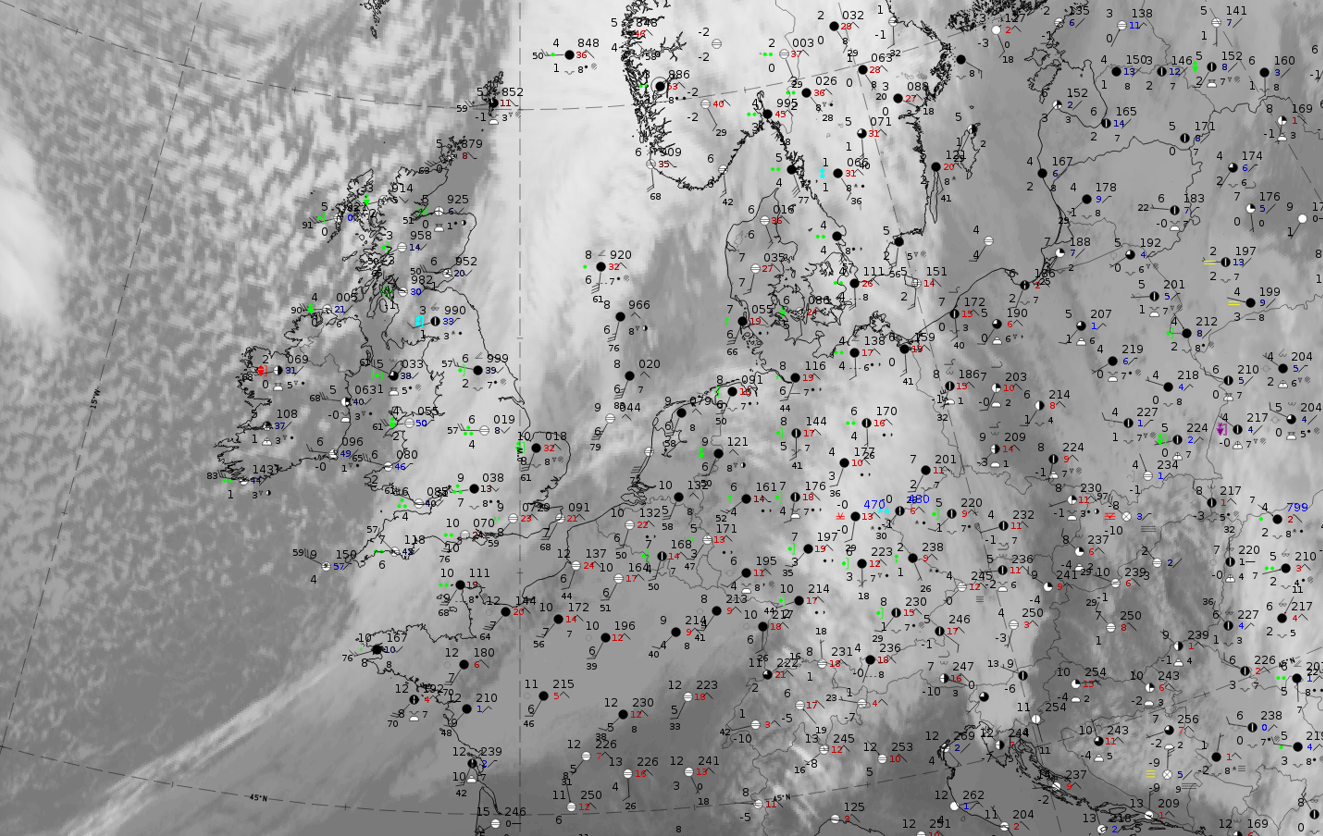
Legend:
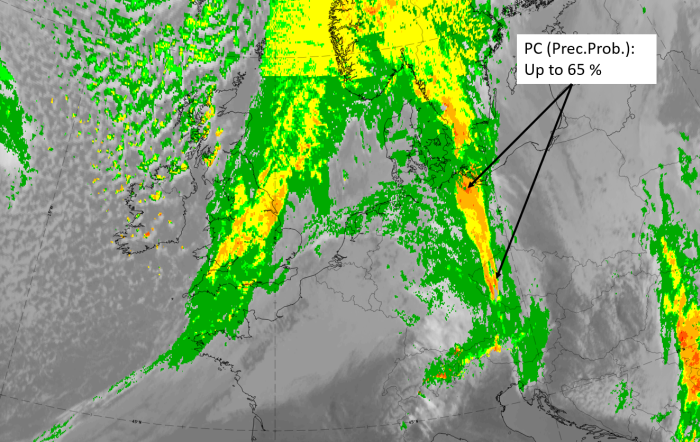
20 February 2020, 12UTC: l: IR + synoptic measurements (above) + probability of moderate rain (Precipitting clouds PC - NWCSAF).
Note: for a larger SYNOP image click this link.
The demonstration example from 20 February 2020 at 12 UTC shows widespread precipitation observations mainly with the rearward two-thirds of the cloud band, with the highest intensities in the centre. This area can also be identified in the image of probability of moderate precipitation image from the NWCSAF, where probabilities are up to about 60 %
|
|
|
|
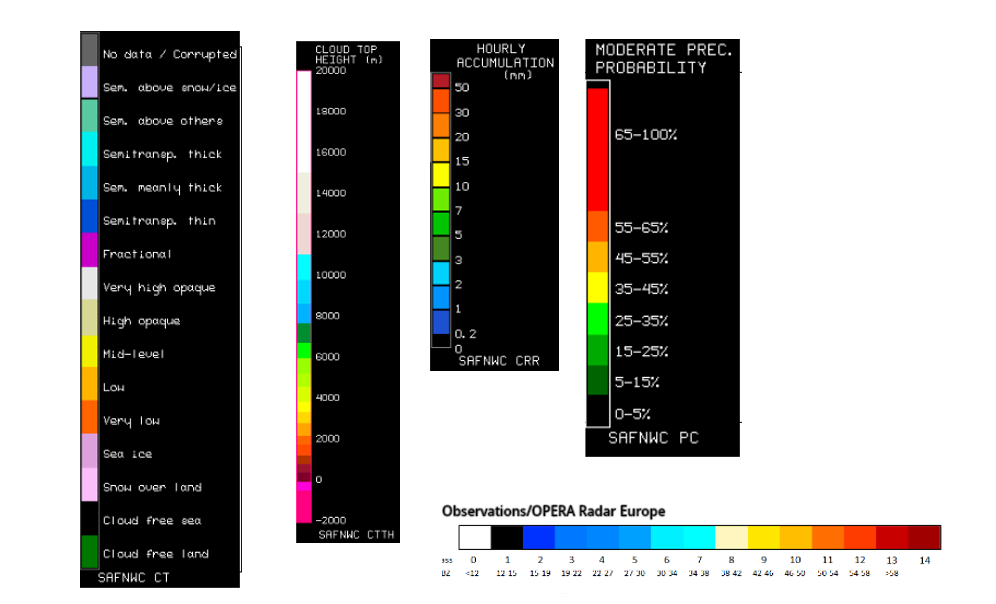
Legend:
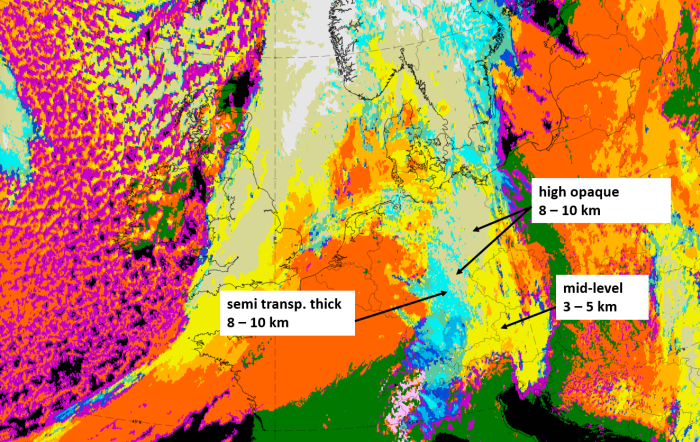
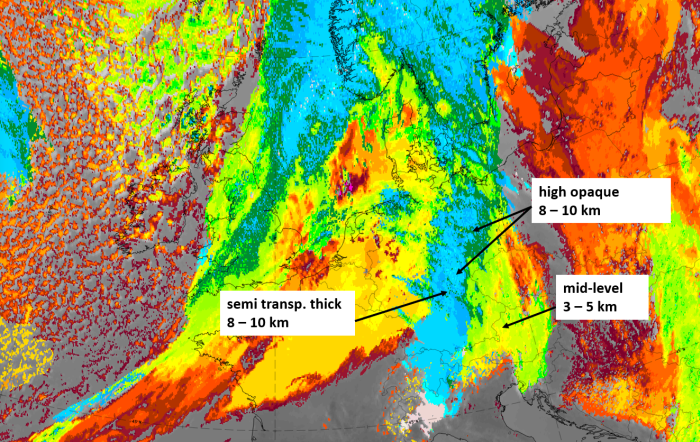
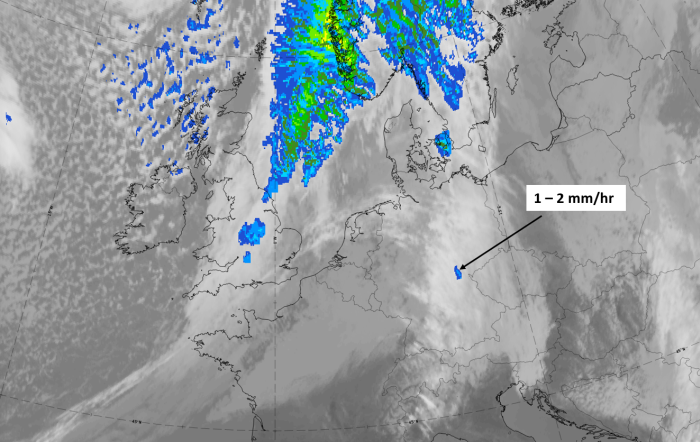
20 February 2012, 12 UTC, IR; with the following fields superimposed:
1st row: Cloud Type (CT NWCSAF) (above) + Cloud Top Height (CTTH - NWCSAF) (below); 2nd row: Convective Rainfall Rate (CRR NWCSAF) (above) + Radar intensities from Opera radar system (below).
For identifying values for Cloud type (CT), Cloud type height (CTTH), precipitating clouds (PC), and Opera radar for any pixel in the images look into the legends. (link)
References
General Satellite Meteorology
- BADER M. J., FORBES G. S., GRANT J. R., LILLEY R. B. E. and WATERS A. J. (1995): Images in weather forecasting - A practical guide for interpreting satellite and radar imagery; Cambridge University Press
- ZWATZ-MEISE V. (1987): Satellitenmeteorologie; Springer Verlag, Berlin - Heidelberg - New York - London - Paris - Tokyo
Specific Satellite Meteorology
- BENNETTS D. A., GRANT J. R. and MCCALLUM E. (1988): An introductory review of fronts. Part I: Theory and observations; Met. Mag., Vol. 117, p. 357 - 370
- BENNETTS D. A., GRANT J. R. and MACCALLUM E. (1989): An introductory review of fronts. Part II: A case study; Met. Mag., Vol. 118, p. 8 - 12