Typical Appearance In Vertical Cross Sections
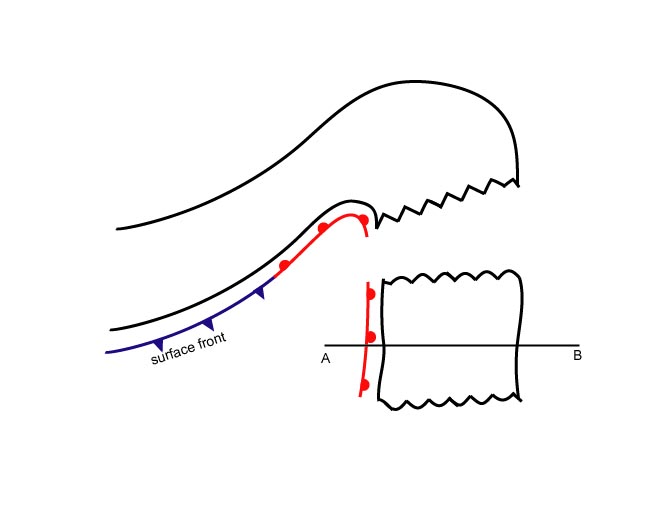
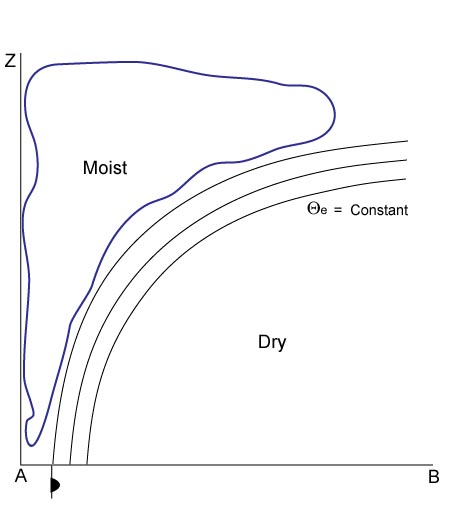
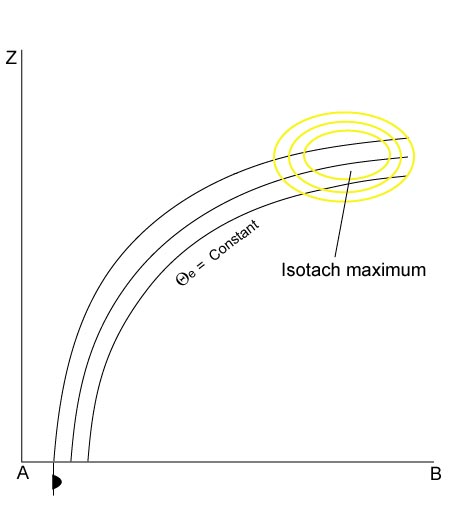
As described before, the isentropes of the equivalent potential temperature across the Detached Warm Front show a high gradient zone through the whole troposphere, which is inclined upwards from low to high levels. The colder air can be found in front of and below the high gradient zone, the warmer air being in front, and above it (see Meteorological physical background).
The field of humidity shows high values immediately behind and above the frontal surface of the Warm Front. Low values can be found below the high gradient zone of the equivalent potential temperature.
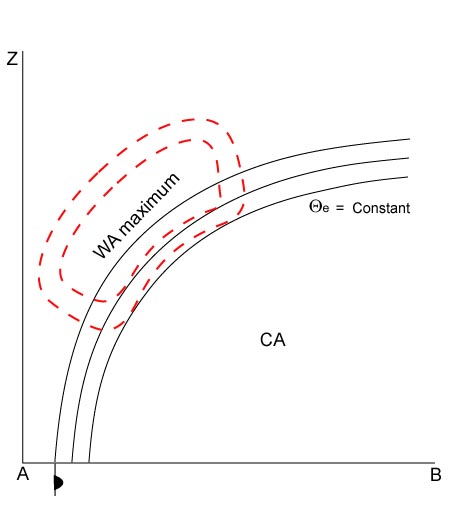
Like the distribution of humidity, the field of temperature advection can also be separated into two parts. WA exists above and within the high gradient zone of the Warm Front. The maximum of the WA can be found within the high gradient zone where it often has several maxima from low up to high levels. On the other hand CA can be found below and in front of the high gradient zone. In actual cases the isentropes forming the lower boundary of the frontal surface do not represent the transition from WA to CA, but WA can also mostly be found far below the frontal surface while CA exists only at a larger distance from the surface front.
At the leading part of the system, above the frontal surface at approximately 300 hPa, a pronounced isotach maximum can be observed.
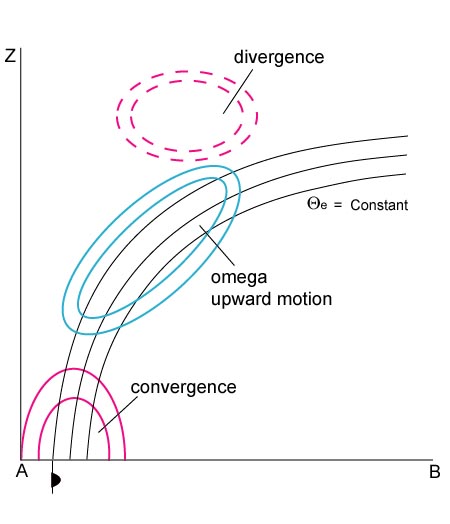
Well developed fronts are accompanied by a zone of distinct convergence within and divergence above the frontal zone. Consequently, upward vertical motion can be found above the frontal zone, responsible for cloud development.
In the ideal case, the satellite radiance values across the Warm Front are characterized by typical distributions. While the IR image shows continuously increasing values of grey shades from the rear to the leading edge across the frontal area, the distribution of the grey shades in the VIS image is reversed (see Cloud structure in satellite image). In contrast, the WV image shows high pixel values within the frontal cloudiness and a pronounced minimum associated with the dry air in front. In reality, these variations of grey shades for Detached Warm Fronts are, by far, not as clear as in the ideal conceptual model.
|
04 January 2005/00.00 UTC - Meteosat 8 IR 10.8 image; position of vertical cross section indicated
|
|
|
|
|
04 January 2005/00.00 UTC- Vertical cross section; black: isentropes (ThetaE), red thick: temperature advection - WA, red thin: temperature advection - CA, orange thin: IR pixel values, orange thick: WV pixel values
|
|
|
|
|
04 January 2005/00.00 UTC- Vertical cross section; black: isentropes (ThetaE), blue: relative humidity, orange thin: IR pixel values, orange thick: WV pixel values
|
|
|
|
|
04 January 2005/00.00 UTC- Vertical cross section; magenta thin: divergence, magenta thick: convergence, cyan thick: vertical motion (omega) - upward motion, cyan thin: vertical motion (omega) - downward motion, orange thin: IR pixel values, orange thick: WV pixel values
|
|
|
|
|
04 January 2005/00.00 UTC - Vertical cross section; black: isentropes (ThetaE), yellow: isotachs, orange thin: IR pixel values, orange thick: WV pixel values
|
|
|
|