Typical Appearance In Vertical Cross Sections
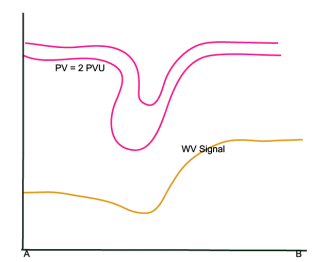
- Potential Vorticity (PV):
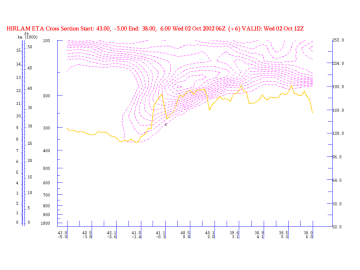
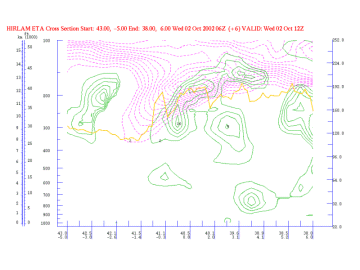
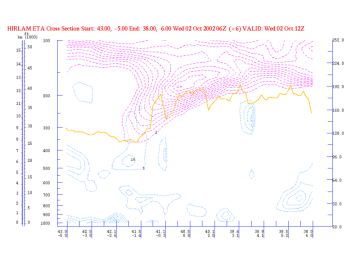
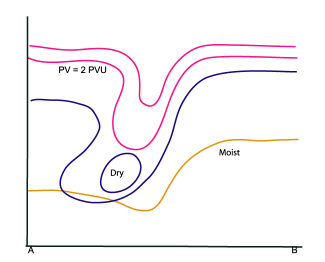
Distinct lowering of the PV=2 value to heights of 400-500 hPa. This lowering of the dynamical tropopause is regarded as the upper level PV anomaly (see Additional Parameters for indicative of the diagnosis of cloudiness - Potential Vorticity ). - Vorticity advection:
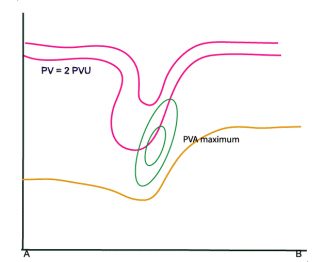
Ahead of the PV anomaly there is positive vorticity advection whilst to the rear there is negative vorticity advection. - Omega:
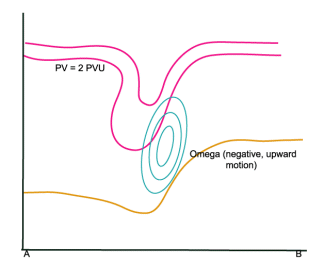
Vertical motion occurs due to the increase of vorticity advection with height. (See omega equation) It can be seen that there is only substantial upward motion in the upper layers of the troposphere, which inplies that cloud development only occurs at higher levels of the troposphere.
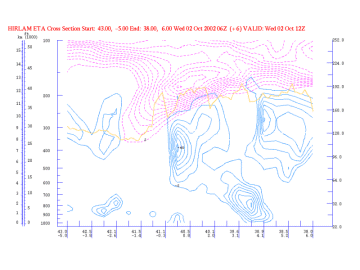
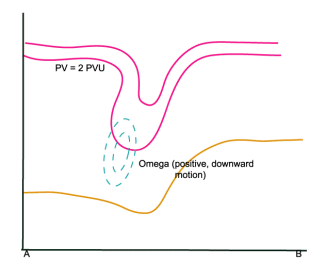
To the rear of the PV anomaly, downward motion occurs due to negative vorticity advection. - Relative Humidity:
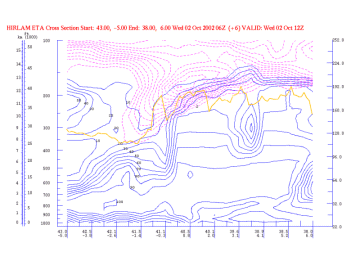
As a result downward motion, dry stratospheric air is transported into the higher levels of the troposphere. This can also be seen in the WV image as a dark area (low pixel values).
|
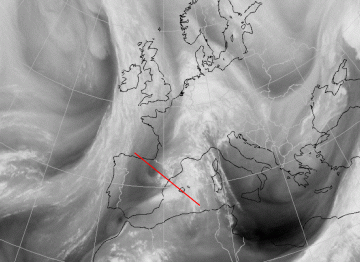
02 October 2002/12.00 UTC - Meteosat WV image; position of vertical cross section indicated
|
|
Potential Vorticity (PV)
|
|
02 October 2002/12.00 UTC - Vertical Cross Section; magenta: PV, yellow: WV pixel values
|
Vorticity advection
|
|
02 October 2002/12.00 UTC - Vertical Cross Section; magenta: PV, green: PVA, yellow: WV pixel values
|
Omega
|
|
02 October 2002/12.00 UTC - Vertical Cross Section; magenta: PV, cyan: Negative Omega, yellow: WV pixel values
|
|
|
02 October 2002/12.00 UTC - Vertical Cross Section; magenta: PV, cyan: Positive Omega, yellow: WV pixel values
|
Relative Humidity
|
|
02 October 2002/12.00 UTC - Vertical Cross Section; magenta: PV, blue: relative humidity, yellow: WV pixel values
|
