Table of Contents
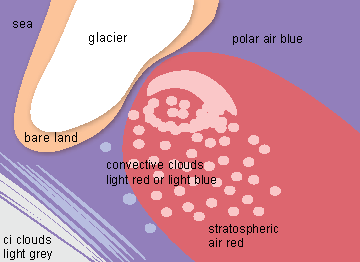
Cloud Structure In Satellite Images
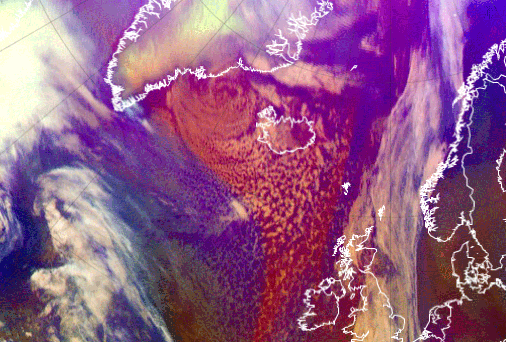
Piteraqs occur in a certain synoptical environment: a low pressure between Iceland and Greenland is moving westward.The low pressure can be an occluded cyclone, a polar low or a large and intense comma. Polar lows and commas occur within cold polar or arctic air masses, whereas occluded cyclones are situated within a very dry and cold airmass originated from the lowest layer of stratosphere. The Meteosat Airmass RGB image from 16 Feb 2015 below shows not only the clouds, but also the cold air mass. The very cold and dry stratospheric air is seen reddish within blue polar air.
|
16 February 2015/12 UTC - Meteosat Airmass combination
|
|
Appearance in high resolution images
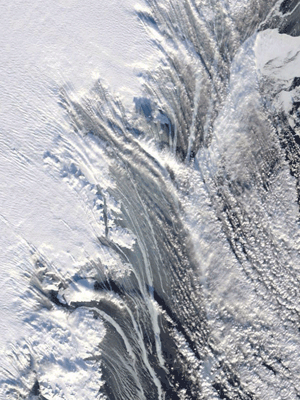
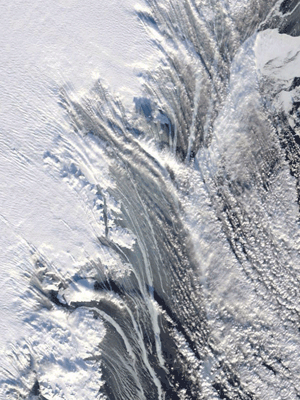
Cold, dry katabatic winds cannot be seen as such in satellite images. They can be sometimes detected, however, in very high resolution visual images as white tendrils of drifting snow over the dark sea, or as trails of foam on the crest of the waves.
|
16 February 2015 - Modis image: snow and foam on the sea near Tasiilaq
|
Meteorological Physical Background
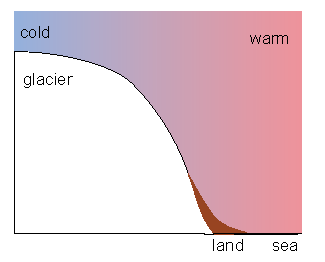
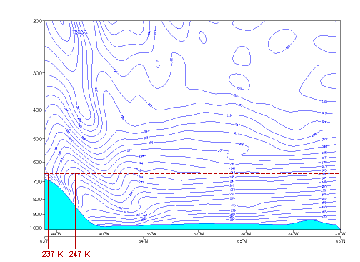
Greenland's glacier rises up to 3000 m. In cloud-free conditions the air near its surface is cold, between -30 and -20 °C even in summer. The air above it is often warmer, so a temperature inversion is usually present. In contrast, the sea-temperature is around 0 °C, and there is no inversion above it. The sea between Greenland and Iceland is open throughout the year, which favours Piteraqs to arise.
A Piteraq-storm forms in cloud-free conditions, when a cold high pressure or a high ridge is situated over the glacier, and a low pressure approaches Greenland from the east.
The low pressure can be an occluded cyclone, a polar low or a comma. They all occur within polar, and in winter also within arctic, air mass.
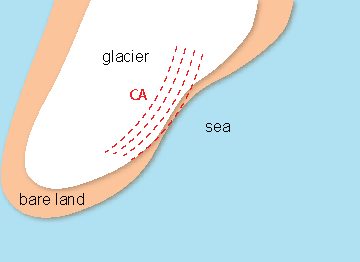
The wind starts over the plateau about 50 km from the coastal valleys as a weak thermal wind. The air temperature is colder over the plateau than over the valley slope at the same height. This creates a pressure gradient and consequently, wind from the glacier towards the sea.The winds start over the plateau about 50 km from the coastal valleys.
|
16 February 2015 at 12 UTC blue: temperature
|
|
When a low pressure approaches the coast, the already present pressure gradient tightens and the wind strengthens, and the dry cold air begins to blow towards the low pressure, canalizing to the coastal valleys, where the pressure gradient is strongest. The wind can become very fast a hurricane scale wind, reaching speed up to even 80 m/s. The height of the maximum wind speed may vary between a few meters up to 200 meters.
The highest winds occur along the valleys and on the coast, weakening over the sea. Piteraqs' zone of influence is typically 100 - 200 km out to the sea (maximum 400 km).
Coastal Latent Heat Polynia
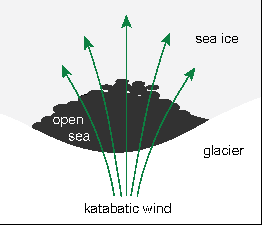
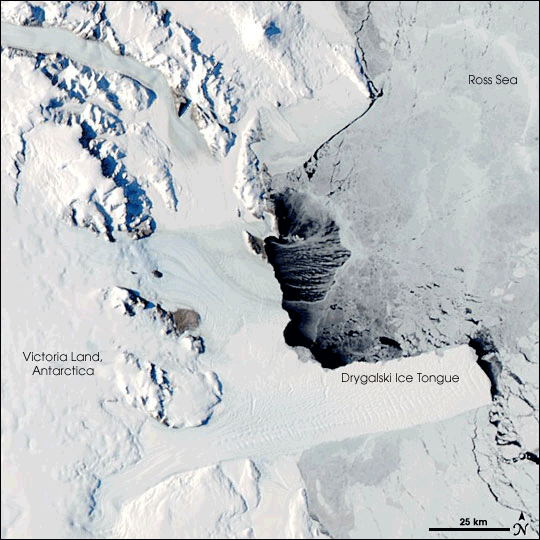
Katabatic winds in northern Greenland, and especially in Antarctica, can also cause a phenomenon called Coastal Latent Heat Polynia.'Polynia' means a pool of water surrounded by ice. Polynias can be seen in very high resolution visual images as black areas surrounded by white/grey ice and snow.
In the case of Latent Heat Polynia the katabatic wind pushes sea ice away from the coast leaving an area of open water. New ice grows rapidly as more cold air comes over the 0 °C sea water, but the wind pushes it forward, and the windward side of the pool remains open. Latent heat is released as the liquid water evaporates into the cold air and when the water freezes.
|
16 October 2007 - Modis image, Antarctica
|
|
Key Parameters
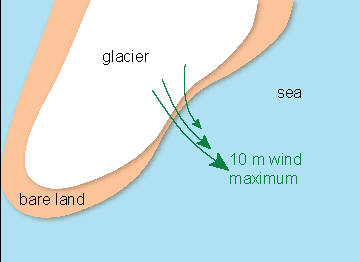
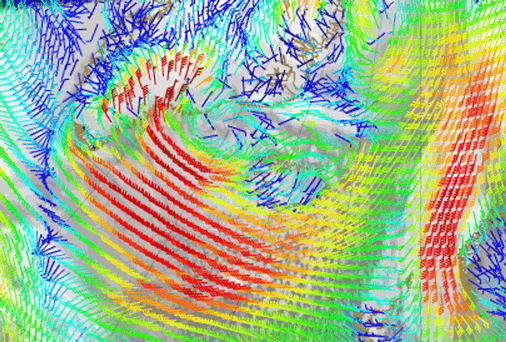
- 10m wind:
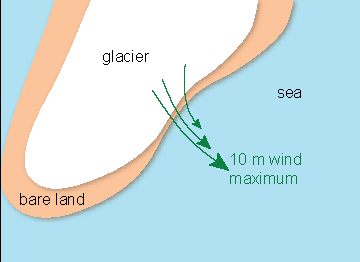
Local maximum of northwestern wind on the southeastern coast of Greenland - 700 hPa temperature advection
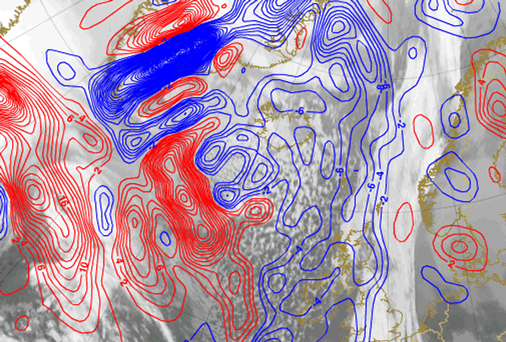
Strong cold advection on the southeastern coast of Greenland - mean sea level pressure
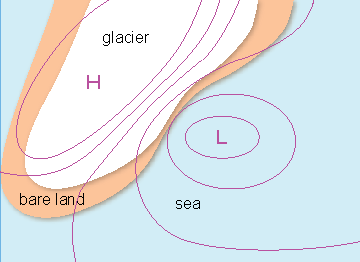
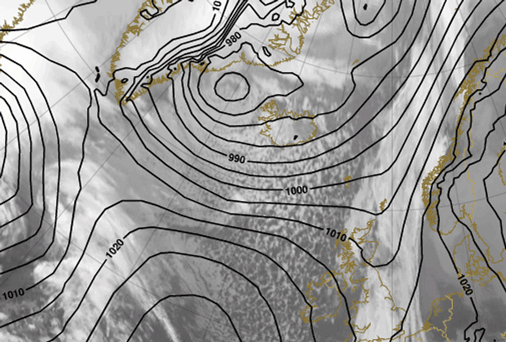
Low pressure over the sea between Iceland and Greenland - lapse rate
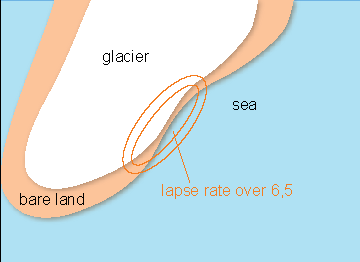
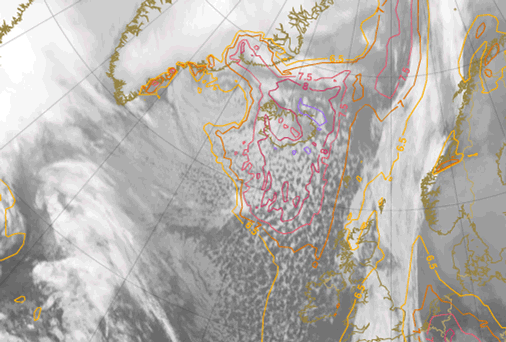
Potentially unstable conditions on the southeastern coast of Greenland, indicated by a lapse rate over 6.5
10m wind
|
16 February 2015/12 UTC - Seviri IR 10.8 image; 10m wind: dark blue: 2-3 m/s, blue: 4-6 m/s, cyan: 7-8 m/s, green: 9-13 m/s, yellow: 14-16 m/s, orange: 17-18 m/s, red: 19-21 m/s, dark red: over 21 m/s
|
|
Temperature advection at 700 hPa
|
16 February 2015/12 UTC - Seviri IR 10.8 image;red: warm advection 700 hPa, blue: cold advection 700 hPa
|
|
Mean sea level pressure
|
16 February 2015/12 UTC - Seviri IR 10.8 image; black: mean sea level pressure
|
|
Lapse rate
|
16 February 2015/12 UTC - Seviri IR 10.8 image; orange to magenta: lapse rate
|
|
Typical Appearance In Vertical Cross Sections
|
16 February 2015/12 UTC - Meteosat IR 10.8 image; position of vertical cross section indicated
|
- Thetae
Thetae decreases down the slope. - Temperature advection
The cold advection above the slope is very strong up to the mid-troposphere. - Relative humidity
The airstream down the slope is very dry, with values of relative humidity even below 10 %. - Divergence
A strong zone of convergence forms above the slope, followed by an area of divergence to counterbalance the vertical motions. - Vertical motion (omega)
The descending motion above the slope is prominent. - Isotachs
There is a wind maxima over the deepest part of the slope. In case of an occlusion also a jet core is situated near the tropopause.
Temperature Advection
|
16 February 2015/12 UTC - vertical cross section; black: isentropes (Θe), blue: cold advection, red: warm advection
|
|
Relative Humidity
|
16 February 2015/12 UTC - vertical cross section; black: isentropes (Θe), green: relative humidity > 69 %, yellow: relative humidity < 70 %
|
|
Divergence
|
16 February 2015/12 UTC - vertical cross section; black: isentropes (Θe), solid red line: convergence, dashed red line: divergence
|
|
Omega
|
16 February 2015/12 UTC - vertical cross section; black: isentropes (Θe), solid cyan line: ascend, dashed cyan line: descent
|
|
Isotachs
|
16 February 2015/12 UTC - vertical cross section; black: isentropes (Θe), light brown: isotachs from 30 m/s up in 10 m/s intervals
|
|
Weather Events
| Parameter | Description |
|---|---|
| Wind (incl. gusts) |
|
| Temperature |
|
| Icing |
|
References
- Heinemann, G. 2013: Katabatic winds and polynya dynamics at Coats Land, Antarctica
- Klein, T., Heinemann, G. 2002: Interaction of katabatic winds and mesocyclones at the eastern coast of Greenland.
- Vihma, T., Tuovinen, E., Savijärvi H. 2011: Interaction of katabatic winds and near-surface temperatures in the Antarctic
- NSIDC (National Snow & Ice Data Center): https://nsidc.org/cryosphere/seaice/characteristics/polynyas.html
