Weather Events
Table 1: Parameter descripitons
| Parameter | Description |
|---|---|
| Precipitation | heavy precipitation (and thunderstorms) in the first phase (related to strong convection) and second phase of development - (within cyclonically curved cloud spiral in the satellite image) in showery and non-showery form (more than 100 mm/h is possible)
slight to moderate precipitation in the third phase of development (dissipating phase) |
| Wind (incl. gusts) | strong winds - the most severe wind just outside of the centre of the eye (eyewall) - the highest wind speed is over the 'flat' sea surface (10 m wind speed up to 80 knots, wind gusts up to 100 knots)
the wind circulates around the eye |
| Temperature | no significant change - warm, less warm after passage of a medicane |
| Pressure | mean sea level pressure continuous falls (and rises after passage) |
| Wave height | significant wave height under influence of Medicane - in some cases maximum heights even up to 6 m |
| Sea level | depending on the wind direction (if the wind is perpendicular to the coast), in some cases the sea level may rise with the passage of the medicane (sea level rise of more than 30 cm) |
In order to show the most important weather events related to Medicanes, the Medicane called Ianos, which started to form in the southern Ionian Sea, on September 14th and lasted until September 20th 2020, is taken as an example.
Medicanes appear in three phases:
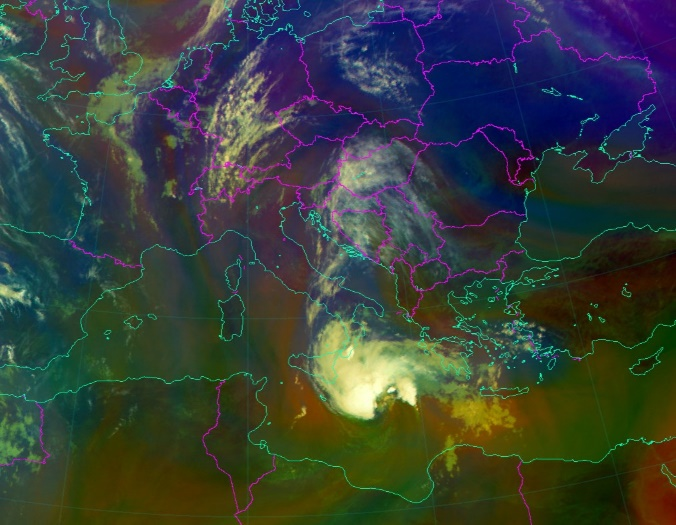
Figure 1: Phase 1 - MSG Airmass RGB - 16 September 2020, 09 UTC
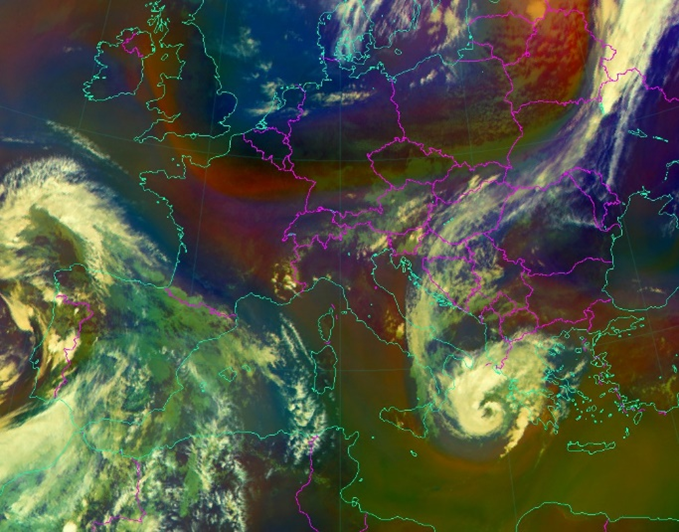
Figure 2: Phase 2 - MSG Airmass RGB - 17 September 2020, 13:30 UTC
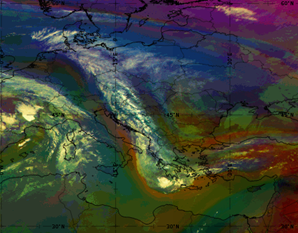
Figure 3: Phase 3 - MSG Airmass RGB - 19 September 2020, 12 UTC
Pre-eyed stage
Phase one ('pre-eyed stage') is before the storm system develops a well-defined eye.
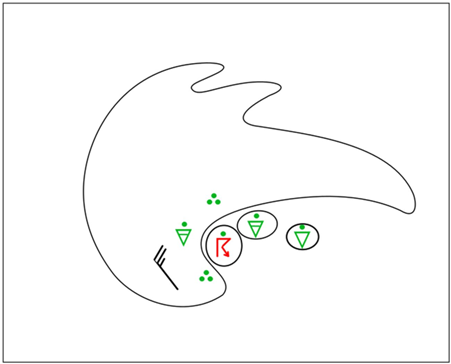
Figure 4: Schemantic of phase one.
|
|
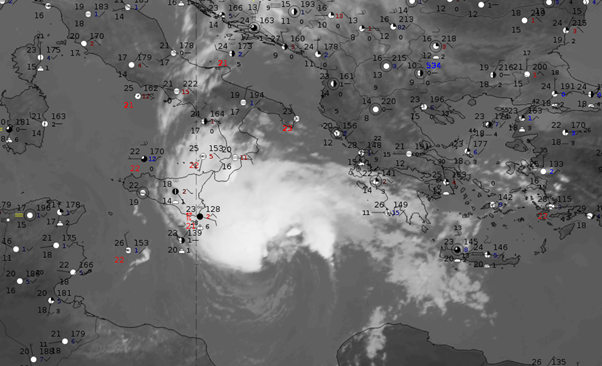
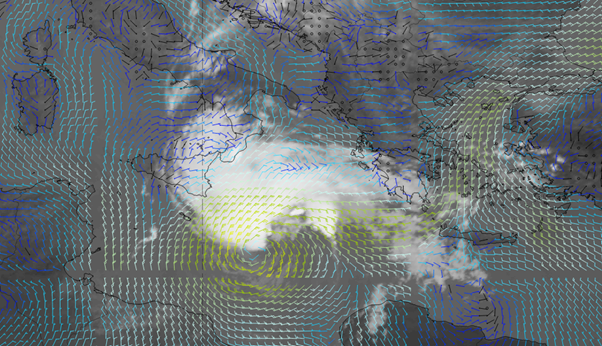
Figure 5: 16 September 09 UTC - IR 10.8 µm with synop (06 UTC) and 10 m wind barbs (ECMWF). Move the slider to compare the images.
The ring frame shows development of both strong convective cloudiness and precipitation, especially on the west side of the cyclone, as well as strong wind and lightning.
Note: To identify the values of Cloud Type (CT), Cloud Top Height (CTH), Precipitating Clouds (PC) and Convective Rainfall Rate (CRR) in any of the images, consult the legend links in the image captions.
|
|
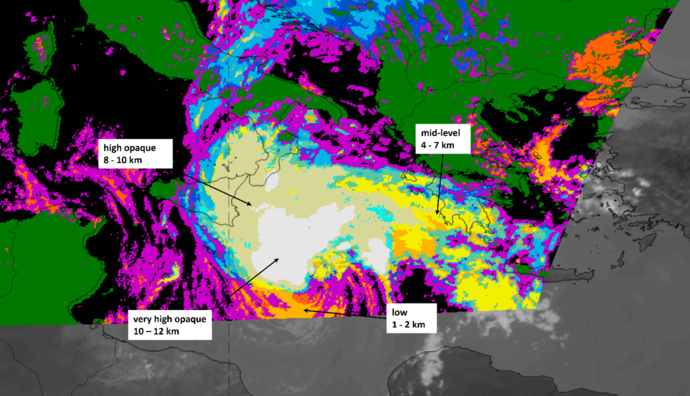
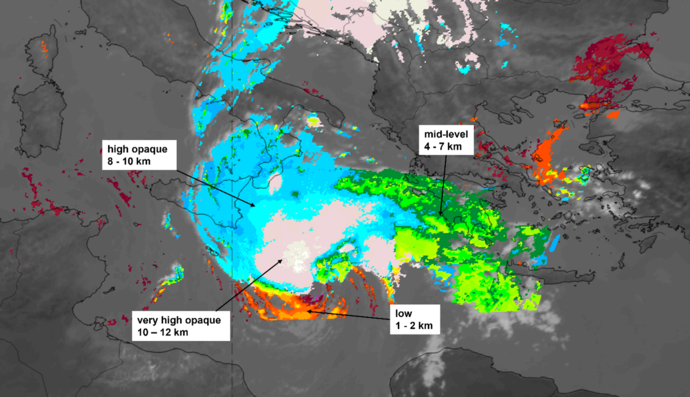
Figure 6: 16 September 09 UTC - NWC SAF products Cloud type (legend) and Cloud top height (legend), (move the slider to compare both images).
|
|
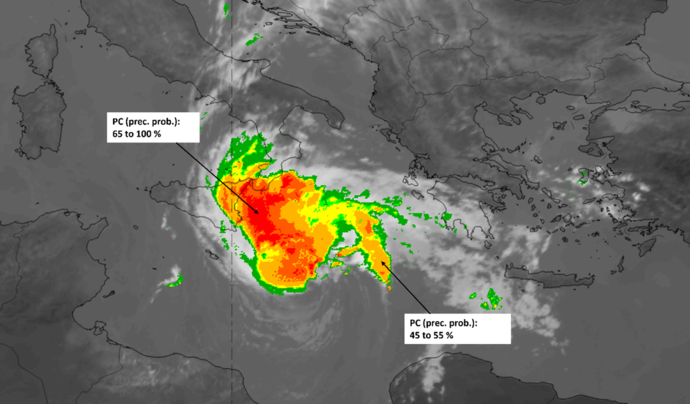
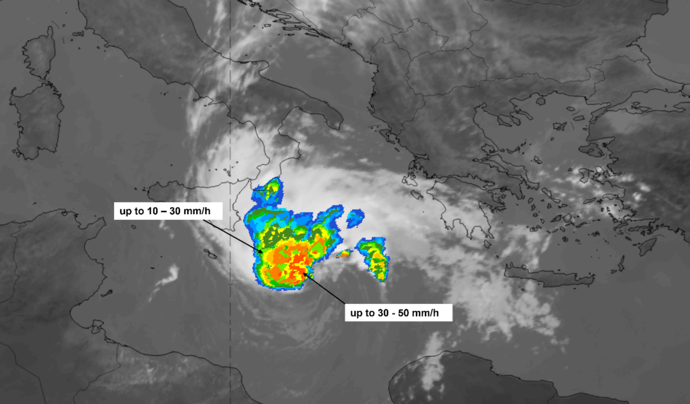
Figure 7: 16 September 09 UTC - IR 10.8 µm with NWC SAF products Precipitating clouds (legend) and Convective rainfall rate (legend), (move the slider to compare both images).
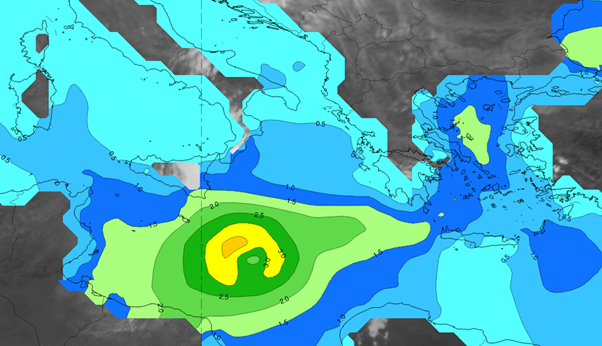
Figure 8: 16 September 09 UTC - Significant wave height (m) (ECMWF).
Stationary phase
In phase two - the stationary phase - an eye forms, surrounded by the cyclone's axisymmetric structure.
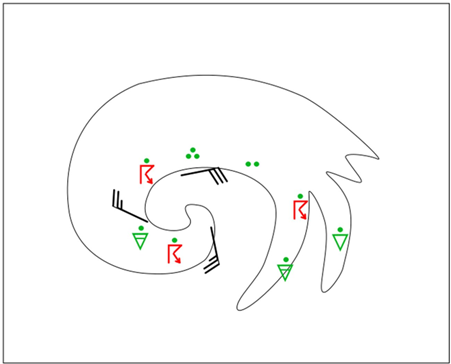
Figure 9: Schemantic of phase two.
|
|
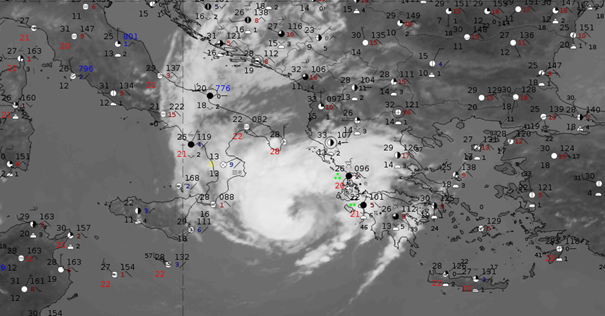
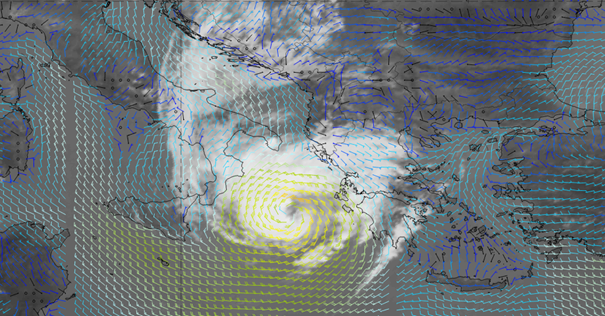
Figure 10: 17 September 12 UTC - IR 10.8 µm with synop and 10 m wind barbs (ECMWF). Move the slider to compare the images.
Ianos became a powerful medicane around 0300 UTC on 17 September. At that time, the system formed clear cyclonic rotation and slowly moved east. Convection in this phase is weaker than it was 24 hours earlier, but the total accumulated rainfall (storm total) was among the highest recorded in parts of western and central Greece (645 mm in 24 hours; 769 mm was recorded on the island of Cephalonia in western Greece during the period from 17 to 19 September). Lightning activity occurred along the cyclonic curvature of the cloud band.
Ianos made landfall in Greece at peak intensity at 03:00 UTC on 18 September, with winds peaking near 80 knots (160 km/h) and gusts of up to 100 knots (195 km/h).
|
|
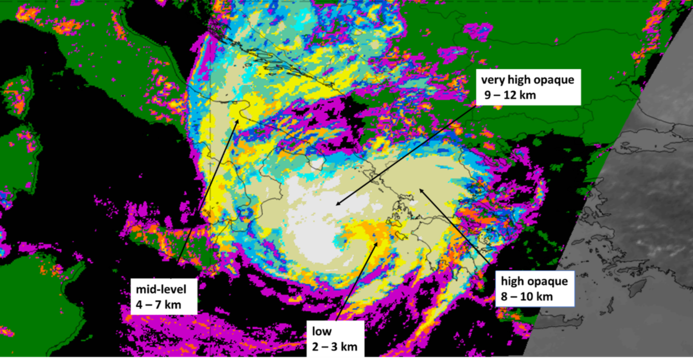
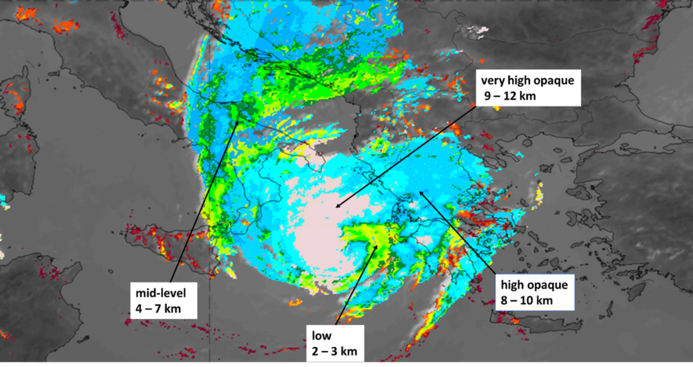
Figure 11: 17 September 12 UTC - NWC SAF products Cloud Type (legend) and Cloud Top Height (legend). Move the slider to compare the images.
|
|
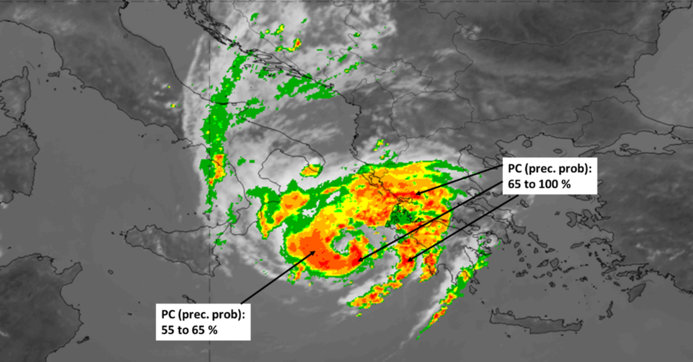
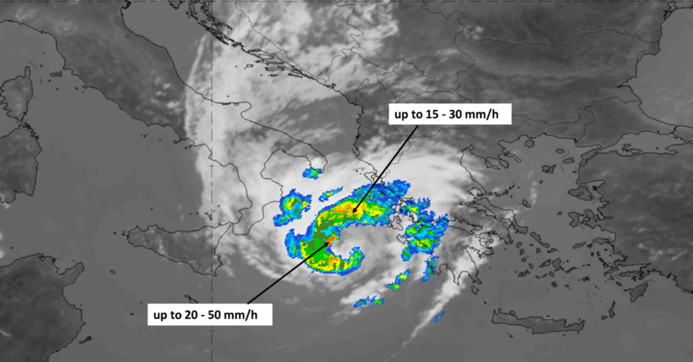
Figure 12: 17 September 12 UTC - IR 10.8 µm with NWC SAF products Precipitating Clouds (legend) and Convective Rainfall Rate (legend). Move the slider to compare the images.
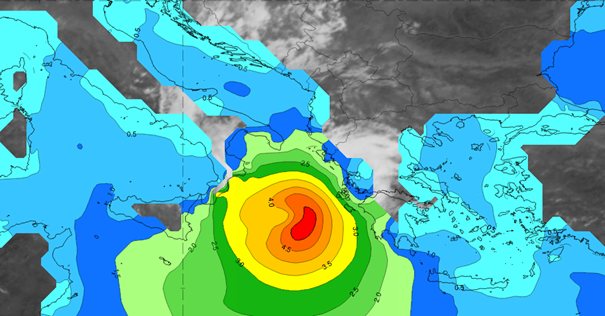
Figure 13: Significant wave height (m) (ECMWF) for 17 September 2020 at 12 UTC.
Figure 13 shows that maximum values reached up to 5 meters in the central Ionian. Approximately 12 hours later high waves hit the coasts of the Ionian islands, with a maximum of 5,9 m on Zakynthos.
Decaying phase
In phase three, the decaying phase, there is less rainfall and weaker winds.
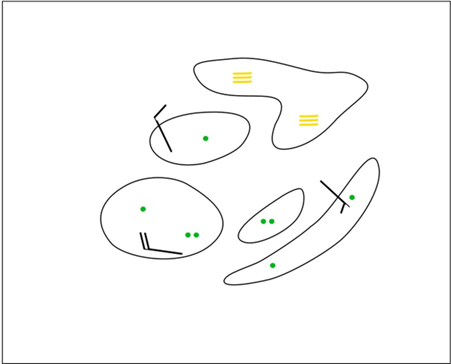
Figure 14: Schemantic of the decaying stage.
|
|
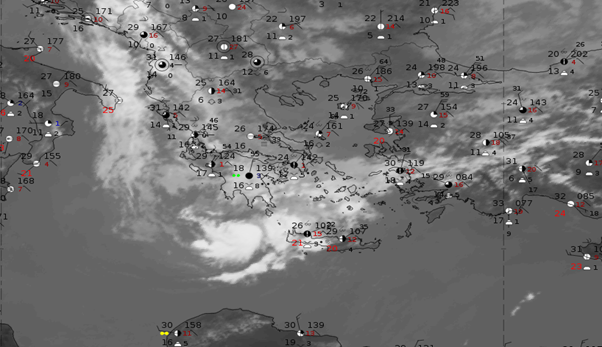
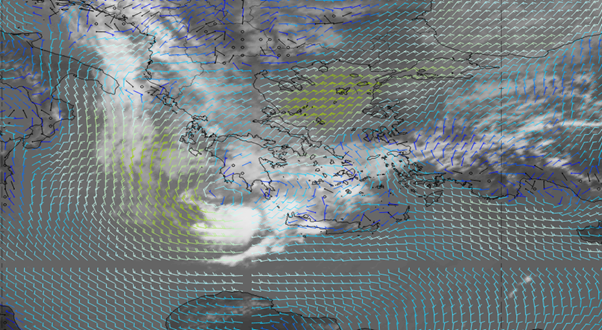
Figure 15: 19 September 12 UTC - IR 10.8 µm with synop and 10 m wind barbs (ECMWF). Move the slider to compare the images.
Precipitation is reduced compared to the two previous phases and average wind speed decreases. During this phase the medicane loses its symmetry but maintains a quasi-symmetric structure around its center. Lightning activity is found mainly far away from center. At the beginning of this phase it is localized while later it becomes scattered.
The winds associated with Ianos caused surface currents which increased the sea level by some 25 cm, with peaks of 30 cm near the Ionian islands.
|
|
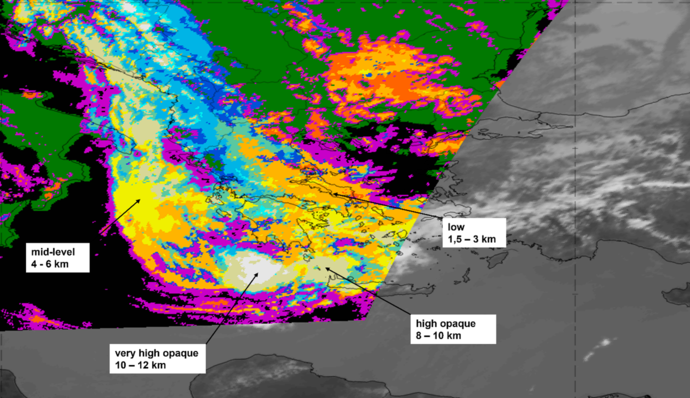
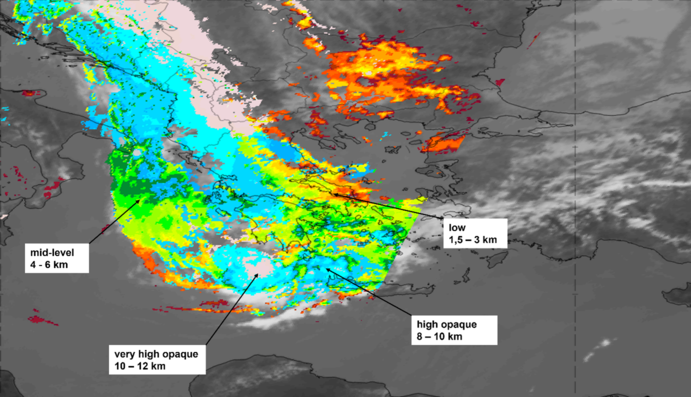
Figure 16: 19 September 12 UTC - NWC SAF products Cloud Type (legend) and Cloud Top Height (legend). Move the slider to compare the images.
|
|
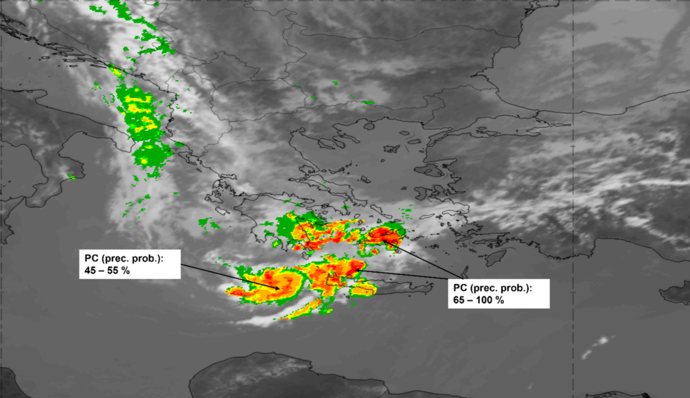
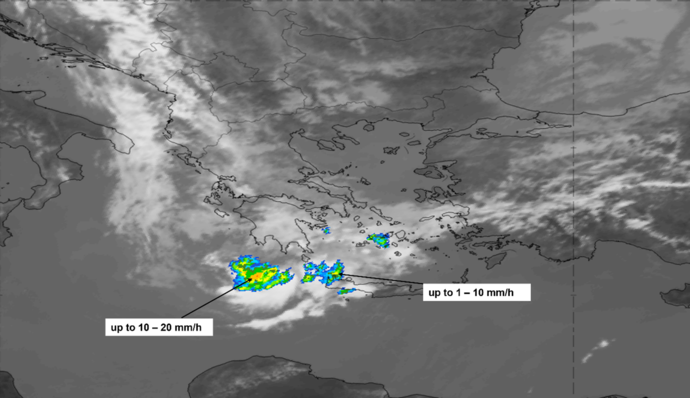
Figure 17: 19 September 12 UTC - IR 10.8 µm with NWC SAF products Precipitating Clouds (legend) and Convective Rainfall Rate (legend). Move the slider to compare the images.
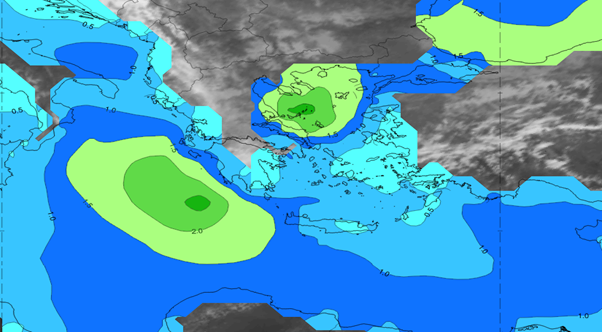
Figure 18: 19 September 12 UTC - Significant wave height (m) (ECMWF).
In the decaying phase waves up to 3 meters high were still hitting the Greek coast.